
Abstract
Machine vision inspection technology provides an efficient tool for surface defects inspection. However, because of the multiformity of surface defects, the existing machine vision methods for surface defects inspection are limited by application scenarios. In order to improve the versatility of algorithms, and to process various kinds of images more accurately, we propose a new adaptive method for surface defect detection, named neighborhood gray-level difference method using the multidirectional gray-level fluctuation. This method changes thresholds and step values by extracting gray-level-fluctuating condition of images, and then it uses the neighborhood gray-level difference to segment defects from background. Experimental results demonstrate the effectiveness of the proposed method for inspecting different surface defects. Compared with other methods, the proposed method can be applied to inspect various surface defects, and it can provide more accurate defect segmentation results.
Keywords
Introduction
Surface defects will decrease the quality of products, and at the same time, they will also impair the economic benefits of enterprises. Therefore, in the past decades, a lot of efforts have been made on the surface defects inspection systems. Since the traditional methods like artificial visual inspection are time-consuming and costly, automatic nondestructive inspection systems are urgently needed now. 1,2 Compared with other existing nondestructive inspection methods, such as methods of magnetic testing, 3 eddy current 4 and penetrant testing, 5 machine vision inspection is widely recognized by many modern enterprises for its higher speed and lower price. 6 As this method integrates many advanced technologies including image processing, optics, pattern recognition, artificial intelligence, and so on, it has obtained advantages such as being real time, high accuracy rate, and reliability. In recent years, the machine vision inspection technology has become a research hot spot in the field of surface defects inspection. 7,8 Among them, however, the number of algorithms which deal with visible light directly is much smaller, 9 –11 most of defect segmentation algorithms still need to use infrared and laser technology, which will increase the cost of defects inspection.
Image segmentation is the foundation of machine vision applications, 12 and automatic thresholding has been widely used in the machine vision inspection, 13 which is used to extract objects from the image background. Thresholding techniques can be classified into global thresholding and local thresholding. 14 To divide image pixels into object class or background class, the global methods use one calculated threshold value, while the local thresholding techniques use several different adapted threshold values which are selected according to the local region information.
Among them, Otsu method is a commonly used global thresholding method. Otsu’s method confirms a threshold which makes the between-class variance maximum or the within-class variance minimum. Otsu method can obtain satisfactory results when the objects and background have the similar variance, but it fails when the sizes of objects and image background are greatly different. To solve this problem, a number of improved Otsu methods have been proposed. For example, Ng proposed valley emphasis (VE) using the valley point information in the objective variance. 13 Fan and Lei took neighborhood information at the valley point into consideration and came up with an improved Otsu method named neighborhood VE (NVE). 15 Yuan et al. used the weighted object variance to revise Otsu method. 16 It is worth mentioning that all these improved Otsu methods have high speed and achieve satisfactory results when the histogram distribution of the image is of bimodal pattern or close to bimodal pattern. But the complexity of environment will affect the histogram distribution of images. For example, nonuniform illumination will make the histogram distribution become unimodal pattern or close to unimodal pattern. In this situation, the effectiveness of these improved Otsu methods may greatly decrease. Therefore, Rosin proposed unimodal thresholding (UT), 17 which is one of the most popular thresholding algorithms having good performance processing images with unimodal distributions. Martínez et al. 18 successfully utilized UT method in industrial applications for surface defect inspection.
The local thresholding methods can segment objects from background more flexibly. The local information in each small region taken into account, local thresholding methods usually get better segmentation results in complex environment, so they can deal with nonuniform illumination images very well. Classic local thresholding methods include Bernsen, 19 Niblack, 20 and Sauvola and Pietikäinen. 21 However, there is no uniform standard to decide the number of blocks to divide images. Researchers usually select the number based on experience, thus the robustness of algorithms may be decreased. Dialectically, local thresholding methods are also limited by the regional information, which often leads to wrong classification. 7 In conclusion, the existing thresholding methods for automatic inspection usually have low efficiency and narrow application scope.
In addition to those above, some very interesting ways are introduced to analyze surfaces with three-dimensional (3-D) models, which can process images from buildings till the limit of resolution of few microns, and they can be used in inspecting drilling, 22 surface reconstruction, 23 laser ranging, 24 and so on; these methods also have a great value to further research.
In order to accurately inspect defects, we develop a new automatic method for surface defects inspection, named neighborhood gray-level difference method using multidirectional gray-level fluctuation (NDF). The contributions of this research are summarized as follows: The proposed method combines the advantages of global characteristics with local characteristics. NDF changes thresholds and step values by extracting gray-level-fluctuating condition of the image, and then it uses the neighborhood gray-level difference to segment defects images and obtain the final results. Experimental results demonstrate that the proposed method can be applied to various surface defects inspection, such as metal, woods, and walls. At the same time, it provides more accurate results than the existing methods, and we validate it by the misclassification error (ME).
The rest parts of the article are organized as follows. “Problems of the existing methods for surface defects inspection” section introduces the existing thresholding methods. “Proposed method” section introduces the proposed method (NDF) for surface defects inspection in detail. Experiments and analysis are discussed in “Experimental results and analysis” section. Finally, the last section concludes the article and describes future research.
Problems of the existing methods for surface defects inspection
The global thresholding methods
Global thresholding methods select a single threshold value from the information of gray-level histogram. Sezgin and Sankur did a thorough survey in global thresholding techniques and discovered that the Otsu was one of the most commonly used methods. 25
Otsu method
An image consists of many pixels, each pixel has a value, named gray-level value q, ranging from 0 to L − 1. The size of the image M × N decides the total number of pixels n. An image can be described as f(x, y), and the value of f(x, y) equals q. Define the number of pixels equal q as nq . Then, the probability of gray-level q can be calculated by the following formula

Now, suppose the selected threshold is


The calculation formula of between-class variance

Then, keep changing the selected threshold
The improved Otsu methods
Ng13 proposed a revised Otsu method named VE by weighting the between-class variance. The weighted value W equals

Fan and Lei15 suggested neighborhood information should be taken into consideration and proposed NVE method. He changed the weighted value W according to the sum probability of the neighborhood gray-level values around the gray level k in interval t.

Yuan et al.
16
introduced the weighted object variance (WOV) method; in his research,

Otsu methods select threshold according to the histogram of images. 26 In an ideal situation, the Otsu optimal threshold should be located at the valley point of the histogram when the histogram of image is of bimodal distribution. For images, which are of unimodal distribution, threshold should be located at the left bottom rim of the single peak. However, histogram can be affected by illumination easily. For those uneven illuminative images, histograms cannot accurately represent the difference between the objects and the background. The lighter portions of defective area may be recognized as background. Similarly, the darker portions without defects may also be recognized as defects.
Problems of the existing Otsu methods
Figure 1 presents the disadvantages of Otsu methods. Original images are showed in Figure 1(a).

Disadvantage of the Otsu methods in segmenting uneven illuminative images: (a) original images; (b) to (e) the segmentation results of Otsu, VE, NVE, and WOV; (f) to (g) histograms and threshold values of original images, respectively (in this article, defects are indicated by black pixels and background is indicated by white pixels). VE: valley emphasis; NVE: neighborhood VE.
The first line of Figure 1 shows a metal surface image with scratches. The Otsu method segments part of background as defects. The result of VE method loses most of the defects. NVE and WOV cannot recognize these scratches at all. Figure 1(f) is the histogram of first original image; it indicates that Figure 1(a) is of unimodal distribution. The results show that Otsu methods cannot provide satisfactory results when the images are of unimodal distribution.
The second line of Figure 1 shows an uneven illuminative image of the first original image. The top part and the left bottom part of the second original image are brighter than other parts, while the right part is darker and the right bottom region is the darkest. Otsu method and VE segment the whole darker right part as defect incorrectly. NVE provides completely wrong result, which segments the whole image as defect. WOV method recognizes the darkest part as object incorrectly. By comparing Figure 1(f) with Figure 1(e), we can discover that illumination has enormous influence on histogram. The experimental results further demonstrate that the effectiveness of Otsu methods may be greatly decreased by nonuniform illumination.
The local thresholding methods
Local thresholding techniques determine the thresholds according to per-pixel neighborhood statistics features. Classic local thresholding methods include Bernsen method, Niblack method, and Sauvola method.
Bernsen method
Bernsen adopts local contrasting technologies. Assume that there is a
Finally, Bernsen method attains binary image by the following formula

Niblack method and Sauvola method
Niblack and Sauvola obtain thresholds by computing mean value and mean variance of local region. Assume that there is a
The threshold

where k is a parameter for correcting result, which usually ranges from 0 to 1.
Sauvola improves Niblack by redefining the threshold
where R is a dynamic range parameter, which is usually set to R = 128.
Disadvantages of Bernsen, Niblack, and Sauvola
The above three methods compute statistical property based on a
After analyzing the disadvantages of existing methods for surface defects inspection, we find three difficult challenges to be overcome. These challenges are as follow: The surface defects show the characteristics of multiformity and complexity. Firstly, there are various materials, such as wood, metal, fabric, the wall, and so on. Secondly, the common defects contain scratches, indentation, cracks, stains, and so on.
28
–30
The diversity of defects makes surface defects inspection more difficult. Some products are highly reflective, especially products composed of metal.
31
Even worse, the surface images of some products are often of illumination inequality. Both of them lead to low contrast between defects and background. Some products are exposed to complex outdoor environments, where defects easily hide in the dirt. It makes defects harder to be found accurately.
In order to overcome these challenges, we propose a new automatic method for surface defects inspection. The proposed method is based on NDF. It can overcome the drawbacks of existing methods and obtain satisfactory results.
Proposed method
The proposed NDF method
Defects on product surface are various, including scratches, holes, cracks, and so on. Therefore, the gray-level values of surface defects images are usually unevenly distributed. Using only a single threshold cannot overcome the influence of variety of defects. Meanwhile, it is certainly not enough to obtain accurate segmentation results relying on the absoluteness of gray-level information merely. Through the analysis above, we propose a new method. The algorithm not only takes local gray-level-fluctuating information into consideration but also takes advantage of global algorithms. The proposed algorithm greatly enhances the effectiveness and accuracy of surface defects inspection.
Four steps are required in this method, as shown in Figure 2.
Step 1. Analyze gray-level fluctuation information of surface images from four directions containing 0°, 45°, 90°, and 135°.
Step 2. Based on the gray-level-fluctuating condition of images, change thresholds and step values automatically.
Step 3. Segment the images according to the thresholds and step values selected by step 2 and use the segmentation algorithm of gray-level difference in local region.
Step 4. Condense these images generated in step 2 into one image to form the final result.

Processing steps of the proposed method.
Adaptive step values and thresholds for the NDF method
Intuitively, images can be treated as two-dimensional fluctuations. As is shown in Figure 3, protuberances of it are waves of gray level. X-axis and Y-axis represent the directions of height and width of the image, respectively.

Schematic of gray-level-fluctuating condition.
As is shown in Figure 3, the proposed method analyzes gray-level fluctuation in the directions of 0°, 45°, 90° 135° and obtains step values and thresholds automatically.
Extract all one-dimensional (1-D) gray graphs of every direction (0°, 45°, 90°, 135°). The total number of each 1-D gray-graph in every direction is n. F(n) represents each 1-D gray-graph mean gray-level value in every direction

where F(i) is the gray-level value of pixel i. The mean-variance K of 1-D gray-graph pixels group is as follows

Select the pixels group of every direction (0°, 45°, 90°, 135°), which maximizes K, and then define each direction’s pixels group selected above as principal curves
The gray-level-fluctuating of 1-D pixels group is abstracted, as shown in Figure 4. Then compute the difference Hd between

The gray-level fluctuation of the principal curve Fd (i).
The proposed method selects step value Jd according to Ld

The threshold of each direction is decided as follows

The step values and thresholds of each direction are decided in this section, which take full advantages of the global characters of the images. Then, the proposed method segments the images according to the neighborhood gray-level difference, which makes use of the advantages of local information. Both of them combine the global characteristics with local characteristics, thus the proposed method provides more accurate results. Segment image in different directions as follows

where

Schematic of neighborhood gray-level difference in different directions.

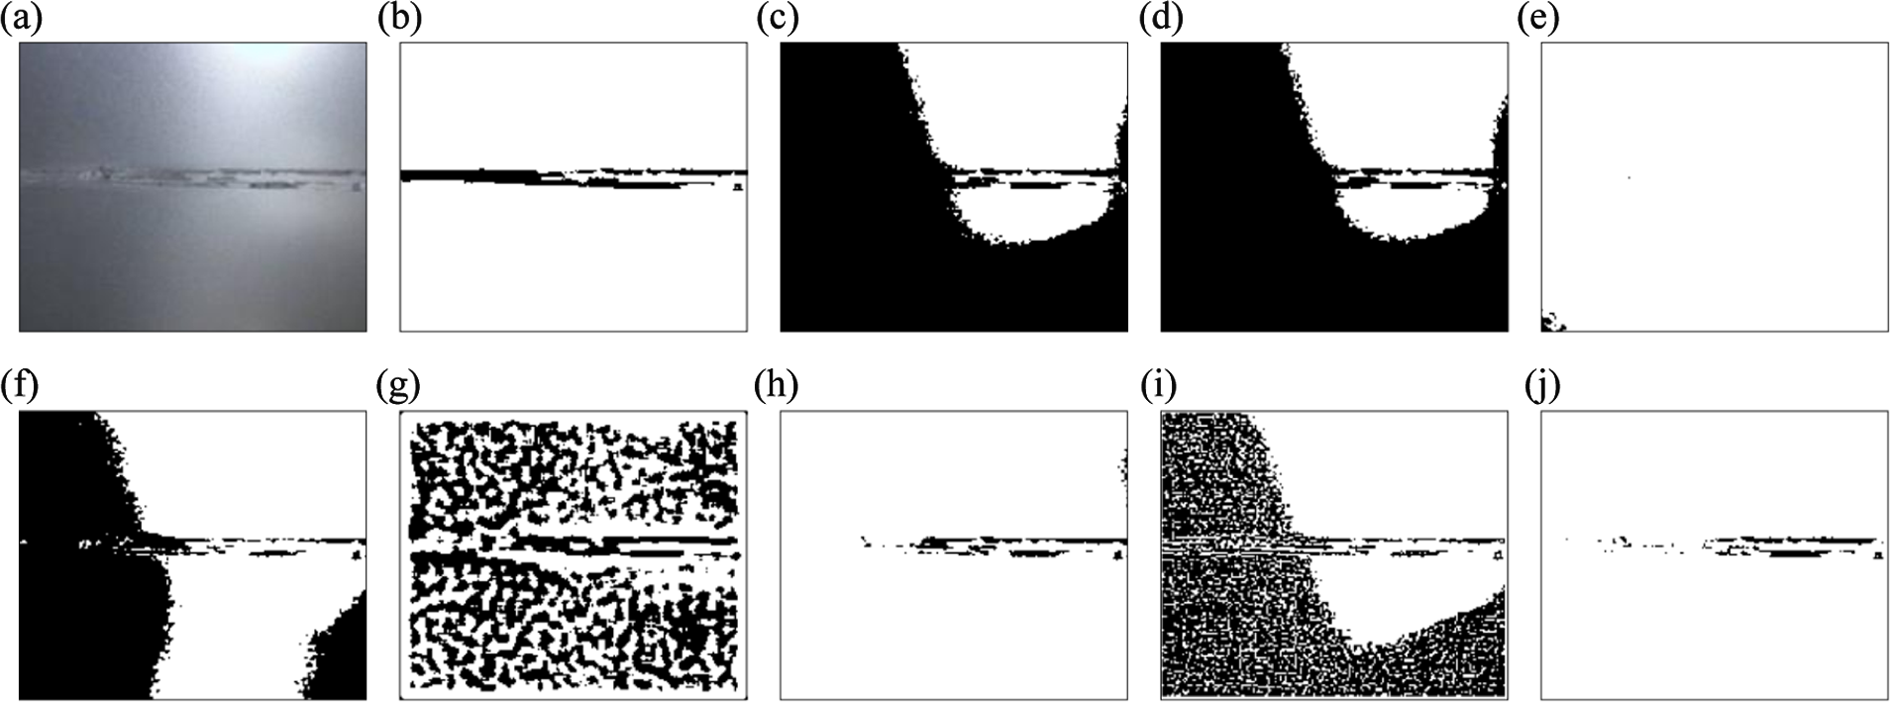
Segmentation results of neighborhood gray-level difference in different directions: (a) original image, (b) segmentation result T 0, (c) segmentation result T 45, (d) segmentation result T 90, (e) segmentation result T 135, and (f) the final result T (in this article, defects are indicated by black pixels and background is indicated by white pixels).
As in Figure 6(b), segment image in direction 0° and 180° using step value J0 and threshold G0 and obtain result T0;
As in Figure 6(c), segment image in direction 45° and 225° using step value J45 and threshold G45 and obtain result T45;
As in Figure 6(d), segment image in direction 90° and 270° using step value J90 and threshold G90 and obtain result T90;
As in Figure 6(e), segment image in direction 135° and 315° using step value J135 and threshold G135 and obtain result T135.
The final segmentation result is
Experimental results and analysis
Experiments are conducted in a computer using MATLAB R2010a (MathWorks, Massachusetts, U.S.A.), with Intel Core I7 2.60 GHz CPU and 8 GB memory. The proposed method can be applied to various defects inspection. To verify this, three groups of surface images are chosen for experiments. The first group contains metal surface images. The second tested data are made up of wooden surface images. The last one is used to test the segmentation results for cracks in the wall. In this stage, many researchers use ME to test the effectiveness of segmentation methods. 32 –35 We also adopt ME as the validation criterion to validate the effect of the proposed method.
The ME is computed as follows

where Bo and Fo are the foreground and background of the ideal segmentation result, respectively. The ideal segmentation results are usually made by researchers themselves. The value of ME can intuitively reflect the accuracy of segmentation. The value of ME ranges from 0 to 1, and the smaller ME represents better results, while bigger ME means lower accuracy.
In this article, we use seven existing methods to compare with the proposed method (NDF), including Otsu, VE, WOV, Bernsen, Niblack, Sauvola, and UT. Among these local thresholding methods, Bernsen computes different thresholds using a 100 × 100 window. Niblack adopts a 11 × 11 window, and Sauvola deals with images using a 80 × 80 window.
Inspection of metal surface
In order to test the effectiveness of NDF for inspecting metal surface, we set five images including common defects: mixed other impurities, rusts, cracks, concaves, and scratches, and most of these images have uneven illumination. Especially, illumination has bigger influence on metal because metal is a highly reflective material. Therefore, illumination is an important factor which cannot be neglected. In order to quantitatively and intuitively compare the results of different methods, we express ME values of different methods for metal image I–metal image VI by histograms in Figure 12(a) to (e).
Figure 7(a) is metal image I with impurities. The Otsu and VE methods define most of the background as defects. Nonuniform illumination makes some area darker than other part of image. Otsu, VE, and UT methods classify the darker area as foreground because the darker area has lower gray-level values. WOV segments all defects as background, while it inspects the darkest pixels as foreground. Bernsen method is also influenced by the nonuniform illumination and classifies part of dark area as objects wrongly. Niblack recognizes most of defects but it generates too much noises. Although it loses some details of defects, Sauvola provides a better result. But it also segments part of background as defects wrongly. For metal image I, the proposed method provides the best result among the other seven methods. Figure 7(b) is the ideal segmentation result of metal image I and Figure 12(a) is the ME histogram of eight methods. Obviously, the proposed method has the smallest ME that is 0.0219. It means the proposed method provides the most accurate result.
Segmentation results of metal image I with impurities: (a) origin image; (b) ideal segmentation result; (c) to (j) the segmentation results of the Otsu, VE, WOV, Bernsen, Niblack, Sauvola, UT, and the proposed method (NDF; in this article, defects are indicated by black pixels and background is indicated by white pixels). VE: valley emphasis; UT: unimodal thresholding; NDF: neighborhood gray-level difference method using multidirectional gray-level fluctuation.
Figure 8(a) is metal image II with rusts. Its illumination is not homogeneous too. The rusts are of point shape and distributed randomly. Otsu, VE, Bernsen, and UT methods segment most of darker area as object incorrectly. WOV fails to recognize defects and just inspects the darkest part of the image. Niblack method generates too much noise. Sauvola method segments most of the defects, but it is also affected by the illumination and classifies bottom part of metal image II as object improperly. The proposed method recognizes almost all the defects, but it is affected by textures of the image and generates a small amount of noise. Figure 8(b) presents the ideal segmentation result of metal image II. Figure 12(b) shows the ME of eight methods for Figure 8(a). Otsu and VE have the highest ME values, while the proposed method has the smallest one. The proposed method provides the best segmentation result for Figure 8(a).

Segmentation results of metal image II with rusts: (a) origin image; (b) ideal segmentation result; and (c) to (j) the segmentation results of the Otsu, VE, WOV, Bernsen, Niblack, Sauvola, UT, and the proposed method (NDF; in this article, defects are indicated by black pixels and background is indicated by white pixels). VE: valley emphasis; UT: unimodal thresholding; NDF: neighborhood gray-level difference method using multidirectional gray-level fluctuation.
Figure 9(a) is metal image III with cracks and rough textures. The illumination at the bottom of metal image III is lower than that of other parts. Otsu and VE obtain almost the same results, while they segment the darker bottom as object. Bernsen has the same problem as Otsu and VE. WOV loses a lot of details of defects. Sauvola and UT are affected by the rough textures and generate some noise, while Niblack generates much noise. The proposed method recognizes the border of the cracks. Comparing with Figure 9(b), all the methods make out defects accurately, but most of them generate varying degrees of noise. In Figure 12(c), the highest value of ME is created by Niblack, and the smallest one is generated by the proposed method. The proposed method obtains relatively better result than other methods.

Segmentation results of metal image III with cracks: (a) origin image; (b) ideal segmentation result; and (c) to (j) the segmentation results of the Otsu, VE, WOV, Bernsen, Niblack, Sauvola, UT, and the proposed method (NDF; in this article, defects are indicated by black pixels and background is indicated by white pixels). VE: valley emphasis; UT: unimodal thresholding; NDF: neighborhood gray-level difference method using multidirectional gray-level fluctuation.
Figure 10(a) is metal image IV with concaves. The gray-level values of defect are not lower than background as most defective images. In this case, global thresholding methods are invalid. As is shown in Figure 10(c) to (e), Otsu, VE, and WOV fail to process metal image IV. Bernsen, Sauvola, and UT recognize nothing of this image. Niblack has too much noise. For this image, only the proposed method segments concave properly. Figures 10(b) and 12(d) further prove the effectiveness of the proposed method for metal image IV.

Segmentation results of metal image IV with concaves: (a) origin image; (b) ideal segmentation result; and (c) to (j) the segmentation results of the Otsu, VE, WOV, Bernsen, Niblack, Sauvola, UT, and the proposed method (NDF; in this article, defects are indicated by black pixels and background is indicated by white pixels). VE: valley emphasis; UT: unimodal thresholding; NDF: neighborhood gray-level difference method using multidirectional gray-level fluctuation.
Metal image V with scratches is presented in Figure 11(a). Comparing with Figure 11(b), this image has a slight scratch and it contains some textures in shape of oblique lines, which confuses the textures with the true scratches. Otsu segments lots of background into foreground. VE, WOV, Bernsen, and Sauvola fail to inspect Figure 11(a) completely. Niblack recognizes the whole textures of the image. UT segments part of the defects but introduces some noise. The proposed method is affected by the textures and segments some textures as defects. In Figure 12(e), the ME of the proposed method is close to 0, and it still provides the best result.

Segmentation results of metal image V with scratches: (a) origin image; (b) ideal segmentation result; and (c) to (j) the segmentation results of the Otsu, VE, WOV, Bernsen, Niblack, Sauvola, UT, and the proposed method (NDF; in this article, defects are indicated by black pixels and background is indicated by white pixels). VE: valley emphasis; UT: unimodal thresholding; NDF: neighborhood gray-level difference method using multidirectional gray-level fluctuation.

Ideal segmentation results and ME of metal images above: (a) to (e) MEs histogram of eight methods for metal surface images above (in this article, defects are indicated by black pixels and background is indicated by white pixels). ME: misclassification error.
Experiments of inspecting the above metal surface images show that the proposed method provides good results for metal images. But it may be affected by the surface textures, which will result in a little noise and false targets, and the false targets mean the false objects wrongly inspected.
Inspection of wooden surface
Common defects on wooden surface include wormholes, concaves, cracks, rots, and so on. We set four images covering all types of defects introduced above (Figures 13(a), 14(a), 15(a), and 16(a)). In this section, effect of the proposed method on wooden surface will be tested completely. The ideal results of original wooden images are shown in Figures 13 to 16(b). The ME of different methods for the provided images is presented in Figure 17(a) to (d).

Segmentation results of wooden image I with wormholes: (a) origin image; (b) ideal segmentation result; and (c) to (j) the segmentation results of the Otsu, VE, WOV, Bernsen, Niblack, Sauvola, UT, and the proposed method (NDF; in this article, defects are indicated by black pixels and background is indicated by white pixels). VE: valley emphasis; UT: unimodal thresholding; NDF: neighborhood gray-level difference method using multidirectional gray-level fluctuation.

Segmentation results of wooden image II with concaves: (a) origin image; (b) ideal segmentation result; and (c) to (j) the segmentation results of the Otsu, VE, WOV, Bernsen, Niblack, Sauvola, UT, and the proposed method (NDF; in this article, defects are indicated by black pixels and background is indicated by white pixels). VE: valley emphasis; UT: unimodal thresholding; NDF: neighborhood gray-level difference method using multidirectional gray-level fluctuation.
Segmentation results of wooden image III with cracks: (a) origin image; (b) ideal segmentation result; and (c) to (j) the segmentation results of the Otsu, VE, WOV, Bernsen, Niblack, Sauvola, UT, and the proposed method (NDF; in this article, defects are indicated by black pixels and background is indicated by white pixels). UT: unimodal thresholding; NDF: neighborhood gray-level difference method using multidirectional gray-level fluctuation.

Segmentation results of wooden image IV with rotten areas: (a) origin image; (b) ideal segmentation result; and (c) to (j) the segmentation results of the Otsu, VE, WOV, Bernsen, Niblack, Sauvola, UT, and the proposed method (NDF; in this article, defects are indicated by black pixels and background is indicated by white pixels). VE: valley emphasis; UT: unimodal thresholding; NDF: neighborhood gray-level difference method using multidirectional gray-level fluctuation.
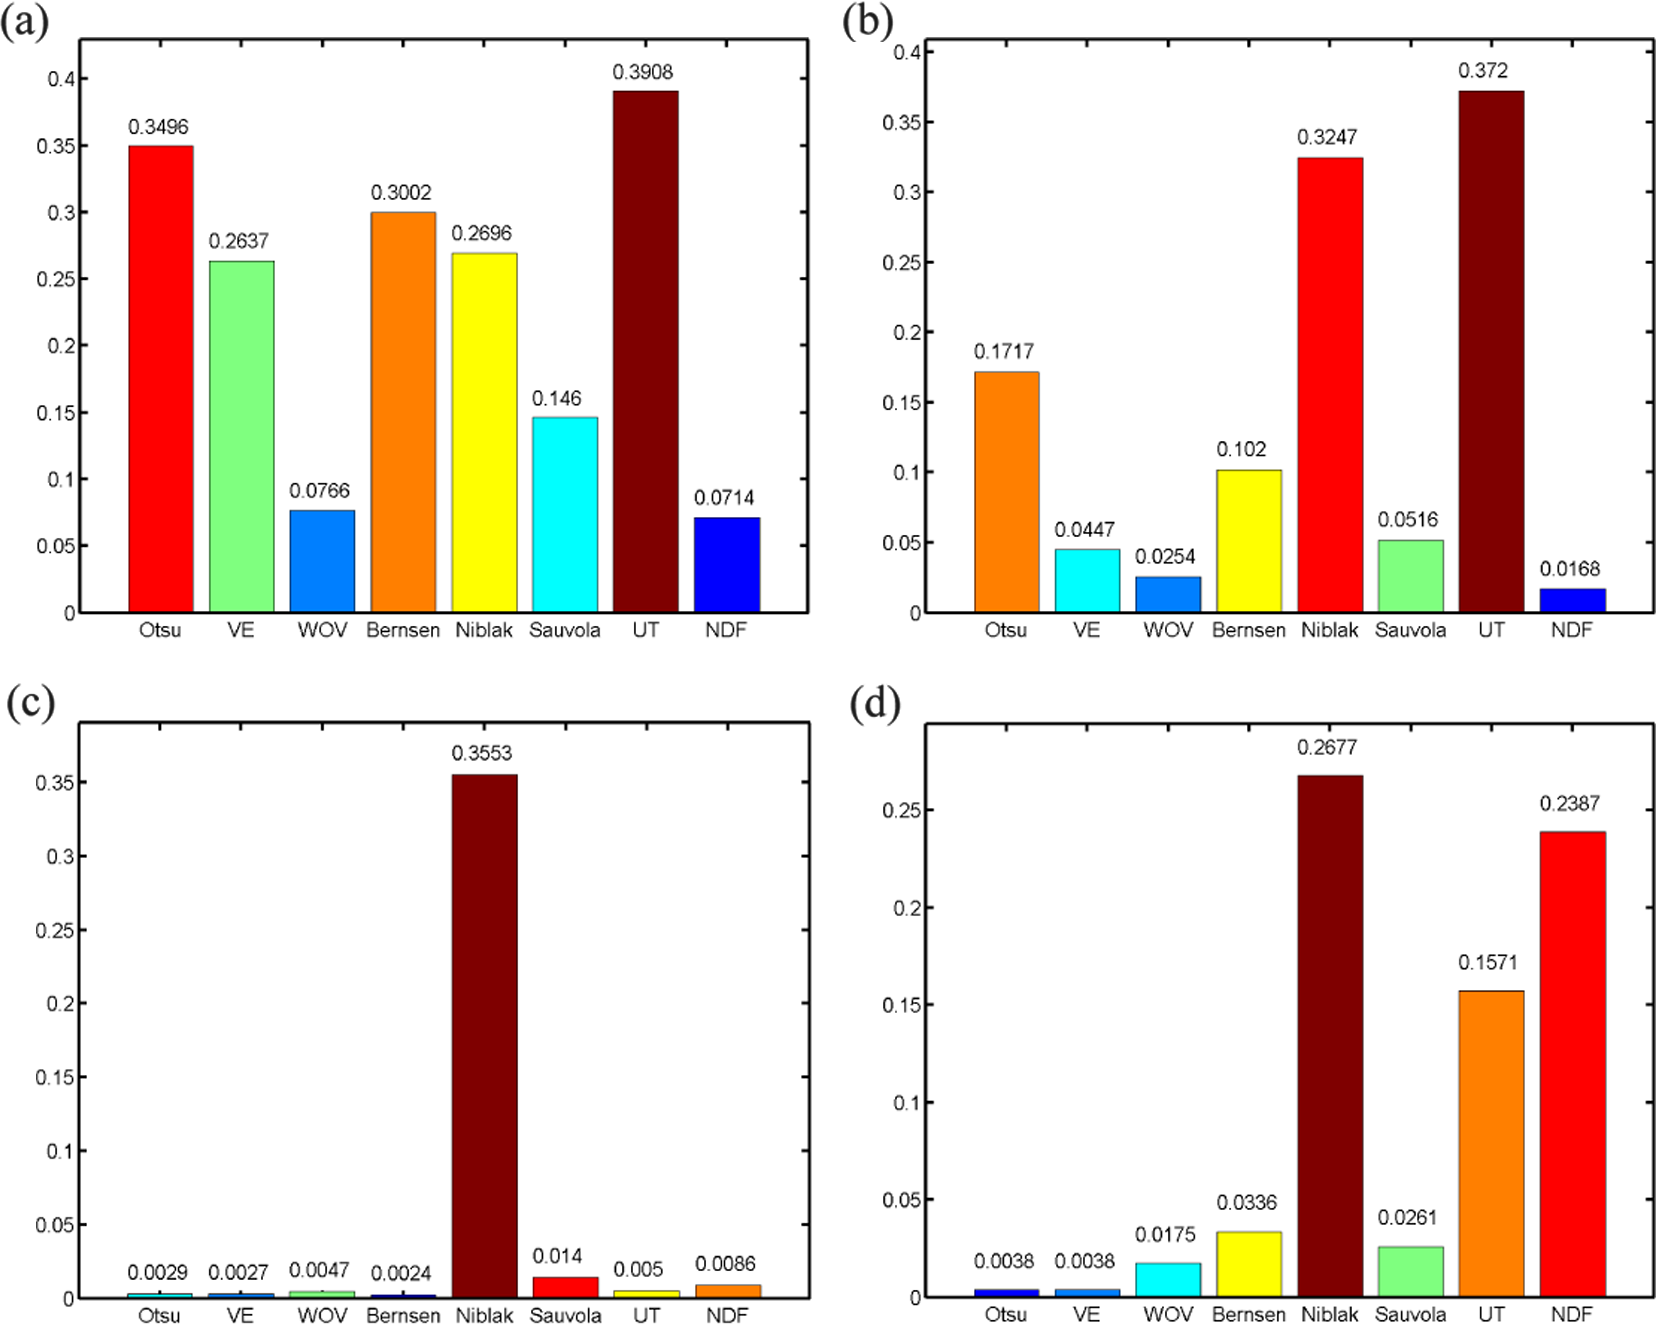
Ideal segmentation results and ME of wooden images above: (a) to (d) MEs histogram of eight methods for wooden surface images above (in this article, defects are indicated by black pixels and background is indicated by white pixels). ME: misclassification error.
In Figure 13(a), wooden image I contains some cracks and lots of small wormholes. The top of image is dark and some tan plaques are randomly distributed in the image. Otsu and VE classify dark area and tan plaques as defects wrongly. Bernsen also segments plaques into objects. Niblack generates serious noise. UT fails to make out defects. WOV recognizes most holes and all cracks, but it incorrectly identifies some plaques as objects and loses some details of defects. Compared with Figure 17(a), though generating a small amount of noise, the proposed method still provides the most accurate result and generates the smallest ME.
In Figure 14(a), wooden image II has a deep concave in the middle of it. On both sides of the concave, there are some slight cracks. The area around the concave has lower gray-level values than other regions, which increases the challenge of inspection. As predicted, Otsu and Bernern define most of the area around the concave as objects improperly. VE and Sauvola segment part of the area around the concave as defects, too. Niblack and UT obtain almost completely wrong result. WOV fails to make out the crack on the left of the image. The proposed method gets the best result but it generates some noise. Figure 17(b) shows the proposed method has the most correct result compared to Figure 14(b).
Wooden image III in Figure 15(a) is smooth and illuminated uniformly. Otsu, VE, WOV, and Bernsen obtain satisfactory results. Niblack has the worst effect. Under the influence of wooden texture, Sauvola, UT, and the proposed method generate some noise in segmentation results. As is shown in Figure 17(c), the ME values of all methods tested except Niblack method are close to 0.
Figure 16(a) is wooden image IV with a big rotten area in the middle. Apart from Niblack and the proposed method, the rest methods make out the rotten area correctly. UT loses some details of the defect. The proposed method only recognizes the border of the object. It is caused by the segmentation method which the proposed method adopts. Because the object is big, the gray-level values around have no difference with the pixel to be processed. Therefore, the pixels within object cannot be made out by the proposed method. However, the border of the defect is also of great significance to the defect inspection system.
The proposed method has better effect on segmenting small wooden defects. But it can only recognizes the border of big objects.
Inspection of cracks in the wall
Inspection of cracks in the wall also has practical meaning. It can be applied to dam detection and high buildings inspection, which are time-consuming and difficult to conduct. We provide experiments for the detection of cracks in the wall using the proposed method. The data to be tested include three shapes of cracks in the wall.
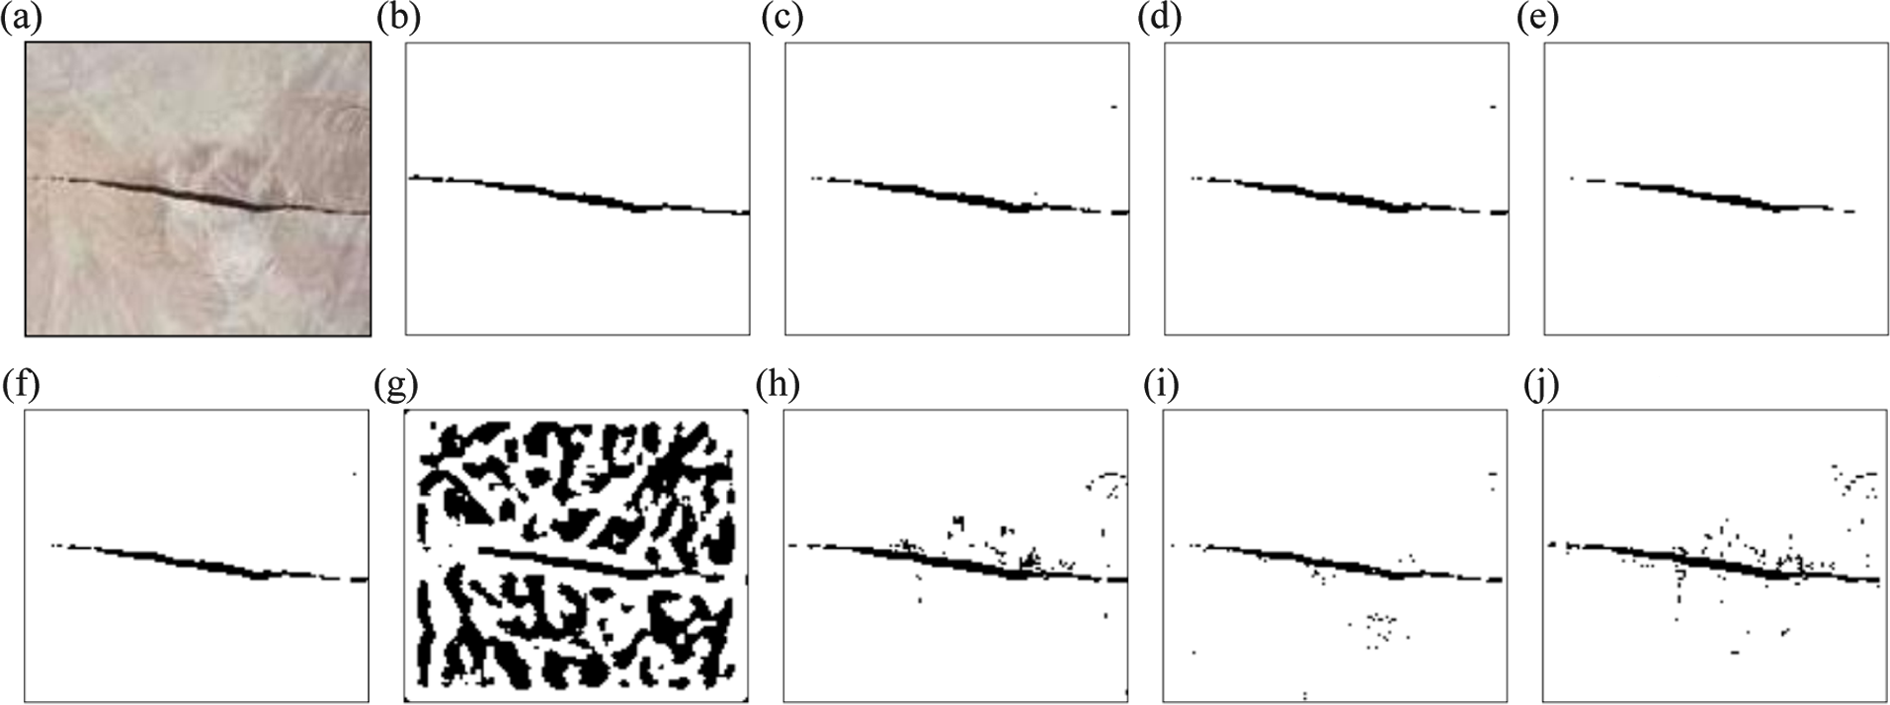
Wall image I is shown in Figure 18(a). It has a long crack throughout the whole image. The areas around the crack have lighter color. Otsu and VE segment most of the background into object wrongly. UT introduces much noise. WOV loses some details of the defect. Bernsen, Sauvola, and the proposed method make out the crack successfully, but they generate different degrees of noise.

Segmentation results of wall image I with cracks: (a) origin image; (b) ideal segmentation result; and (c) to (j) the segmentation results of the Otsu, VE, WOV, Bernsen, Niblack, Sauvola, UT, and the proposed method (in this article, defects are indicated by black pixels and background is indicated by white pixels). VE: valley emphasis; UT: unimodal thresholding.
In Figure 19(a), the cracks of wall image II are more complex than other wall images. Otsu, VE, Bernsen, Sauvola, and UT segment some dark areas in background as defects wrongly. Niblack completely fails to segment this image. WOV and the proposed method provide better results. As is shown in Figure 21(a), the ME values of them are ME = 0.0409 and ME = 0.0416, respectively.
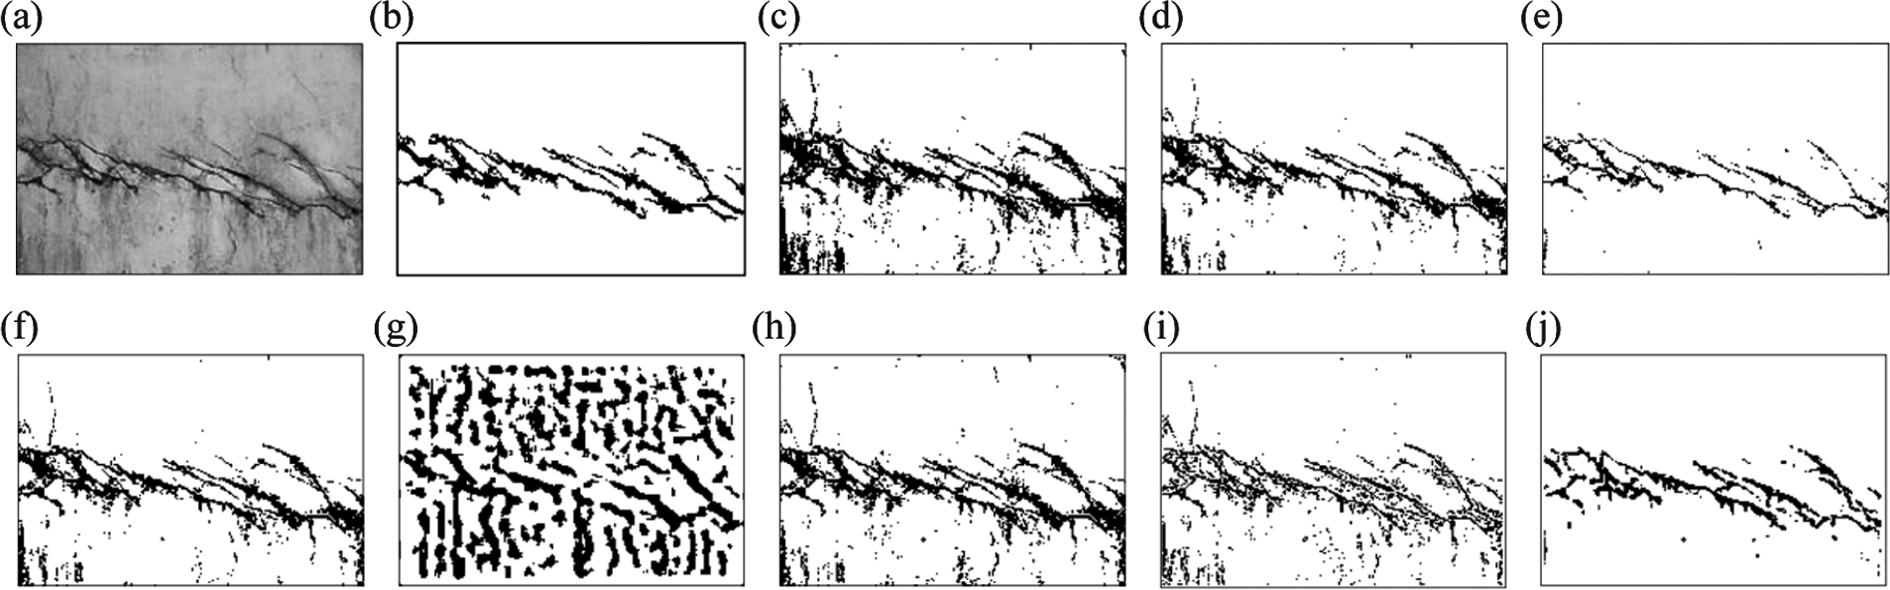
Segmentation results of wall image II with cracks: (a) origin image; (b) ideal segmentation result; and (c) to (j) the segmentation results of the Otsu, VE, WOV, Bernsen, Niblack, Sauvola, UT, and the proposed method (in this article, defects are indicated by black pixels and background is indicated by white pixels). VE: valley emphasis; UT: unimodal thresholding.
Wall image III is shown in Figure 20(a), and the cracks are not obvious. In other words, the gray-level value of defective areas has no obvious difference with the background. The VE method, Niblack, and UT cannot segment wall image III. WOV and Bernsen fail to recognize the crack. Otsu method classifies part of the background as defects wrongly. Sauvola and the proposed method make out the cracks successfully. But Sauvola loses some details. The proposed method provides the best result with ME = 0.0026 (Figure 21(c)).

Segmentation results of wall image III with cracks: (a) origin image; (b) ideal segmentation result; and (c) to (j) the segmentation results of the Otsu, VE, WOV, Bernsen, Niblack, Sauvola, UT, and the proposed method (in this article, defects are indicated by black pixels and background is indicated by white pixels). VE: valley emphasis; UT: unimodal thresholding.

Ideal segmentation results and ME of wall images above: (a) to (c) MEs histogram of eight methods for wall images above (in this article, defects are indicated by black pixels and background is indicated by white pixels). ME: misclassification error.
The proposed method has good results in detecting various kinds of cracks in the wall. But it is affected by the texture of the wall surface and it may lead to a little noise.
False positive rates for nondestructive surface images
In a practical application, only the ME value as the evaluation is not enough. Researchers also concern false positive rates (FPRs) for nondestructive surface images. FPR can be described as follows

FPR ranges from 0 to 1; lower FPR value represents more accurate judgment.
Values of FPRs of the eight methods for different tested images are presented in Table 1. In the table, three kinds of nondestructive surface images are tested, including metal images, wooden images, and wall images. A data set with 100 metal nondestructive images, 100 wooden nondestructive images, and 100 wall nondestructive images is constructed to comprehensively test the defects detection results. Otsu and Niblack both have high FPR values in three kinds of tested images. WOV has the lowest FPR values in eight methods, but this method cannot complete the defect detection work in most of the time. The proposed method (neighborhood gray-level difference method using the multidirectional gray-level fluctuation (DNF)) performs not so well, especially in wall images, it has high FPR value. Because wall images usually contain complex textures, the proposed method will be greatly affected by these textures. However, the proposed method can complete the task of defect detection almost every time, and the optimization of the algorithm for different textures is the next step of our research.
Comparison of false positive rates for eight methods.

VE: valley emphasis; UT: unimodal thresholding.
Conclusion
In this article, we provide a new automatic method based on NDF. It selects four thresholds and step values according to fluctuation of different directions (0°, 45°, 90°, 135°). Then, DNF method segments the image by neighborhood gray-level difference method using the thresholds and step values computed before. Therefore, this proposed method combines the advantages of global properties and local properties. It can obtain more accurate results than the existing methods for surface defects inspection.
The experimental results verify the efficiency of NDF. This new method can be applied to detecting defects in different situations, such as metal surface, wooden surface, and wall surface. The proposed method provides satisfactory results in all these three situations. It can overcome the influence of illumination and the shape of defects. However, this method may generate different degrees of noise under influence of the texture in the surface. Because of the principles of neighborhood gray-level difference method, the proposed method can only segment the borders of big objects. In conclusion, compared with other existing methods, the proposed new method obtains better results for inspecting various material surface defects.
In the future, our efforts can focus on both decreasing the influence of surface texture and improving the validity of recognizing big objects. Besides, we will attempt to combine our method with 3-D models 22 –24 for getting better and more accurate surface analysis results.
Footnotes
Declaration of conflicting interests
The author(s) declared no potential conflicts of interest with respect to the research, authorship, and/or publication of this article.
Funding
The author(s) disclosed receipt of the following financial support for the research, authorship, and/or publication of this article: This work was supported by the National Natural Science Foundation of China (no. 41306089).