
Abstract
Magnetic particle inspection is typically used to detect the magnetic leakage caused by defects. This method is mainly used to detect the surface and subsurface defects of ferromagnetic materials. The conventional detection method involves inspectors performing visual inspection under high-power ultraviolet light. However, the intense ultraviolet light can easily damage the eyes of the inspectors. Furthermore, the aforementioned process is not only time consuming but also susceptible to human errors. Therefore, this study developed an automated optical inspection system to perform magnetic particle inspection. Analysis of several image features revealed that a contour compactness between four and five can be used to distinguish defective and non-defective features effectively. The defect identification ability obtained with several input combinations of image features for neural networks was analyzed. The results revealed that a high identification ability can be achieved for defective features when the input combination of area, mean width, and compactness is used.
Keywords
Introduction
Magnetic particle testing (MT) involves detecting the magnetic leakage caused by defects in a material by using small magnetic particles with fluorescent properties. MT is commonly used to detect the surface and subsurface defects of ferromagnetic materials, such as castings, forgings, rolled steel plates, heat treatment parts, and machining and grinding parts.1–3 MT testing is simple and enables fast inspection with high flaw detection and sensitivity.
Ma et al. 4 used a magnetic particle inspection machine equipped with an industrial camera with a filter to detect cracks on the surface of train wheels. The authors performed image processing, including top-hat processing and Otsu’s adaptive binarization, on quantitative quality indicators and actual defects and subsequently extracted the altered image as a feature to determine the size and location of the defect.
Lundh 5 used cameras to capture green cracks appearing on the surface of a forged part. Noise filtering was then performed through image processing, followed by feature extraction on the detected image. Finally, the thresholds of various characteristic parameters were defined for the defect inspection of forged parts.
Ray detection is a nondestructive technique for detecting aircraft wing defects. However, conventional ray detection is not only time consuming and laborious but also depends on the assessor. Therefore, the results are subjective and have low accuracy. Wang et al. 6 proposed a set of automatic crack defect detection algorithms for detecting flaws on aircraft wings by combining the region of interest minimization and improved Canny edge detection techniques. The results revealed that the method can automatically detect cracks up to a width of 2 mm in the fixed hole of the aircraft wing.
Surface quality is a crucial quality control factor in industrial products. However, most machine-vision-based surface defect detection systems have low defect detection rates and high false alarm rates. Different types of defects provide different types of information for various directions and image scales, and traditional feature extraction methods (such as wavelet transform) cannot obtain information in all directions. Therefore, Xu et al. 7 introduced a shear wavelet transform method to obtain information from all directions. Excellent classification rates were achieved when this method was tested on the production line for continuous casting slabs, hot rolled steel, and aluminum plates.
Galan et al. 8 developed visual-inspection-based methods to identify surface defects of metal parts produced during the casting process. The cast surface was rough, and the defects were flaky protrusions. Therefore, in this study, the authors focused on identifying the shadows caused by flaws on the casting process. The detection method was used to obtain the dark and light areas of the image through binarization. Defects were identified by assuming dark areas were shadows caused by defects.
In rail transportation, rail quality is critical for safety. Rail inspections were typically performed through visual examination. This method is not only time consuming but also inefficient. To address this problem, researchers have proposed various noncontact rail inspection techniques.9,10
The large-scale adoption of automatic optical inspection technology in defect detection in various industries is a challenge because of the numerous types of surface defects. Therefore, many researchers have proposed methods to improve the accuracy of automated optical inspection.11–14
This study proposes installing an automatic optical particle inspection machine on an existing magnetic particle flaw detection machine. Considering that the metal product may reflect light and magnetic powder is irradiated with ultraviolet light to displays defects clearly, a semicircular tube light source cover can be developed.
Design of the inspection system
Description of the inspection object
In this study, a constant-velocity (CV) joint was used as the research object (Figure 1). A CV joint allows the transmission shaft to transmit power through a variable angle under a constant rotational speed. This joint is manufactured through forging. However, cracks may appear on the joint during the forging process. Therefore, nondestructive testing is required to detect defects.
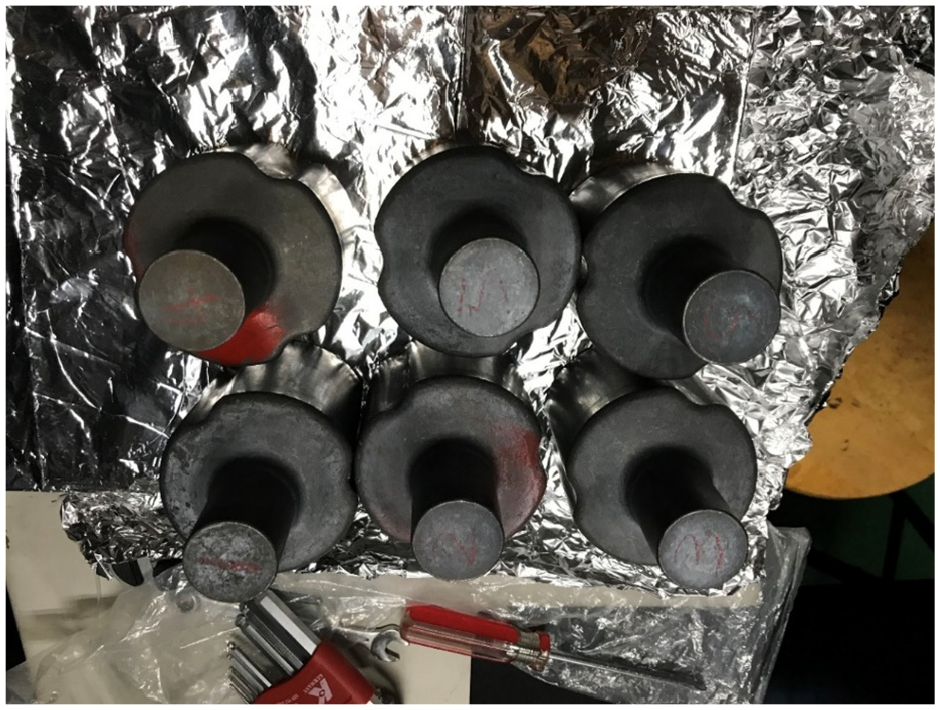
Research object.
Architecture of the image acquisition system
The inspection system (Figure 2) consists of four parts, namely the light source, image capturing device, lens, and light source cover.
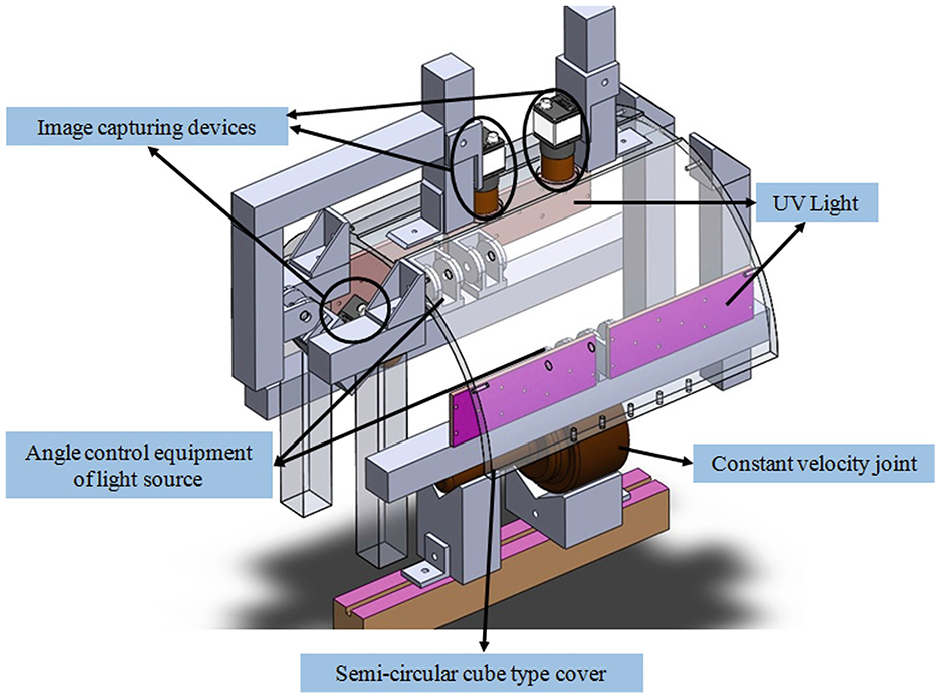
Architecture of the automatic inspection system.
Research methods
Color separation
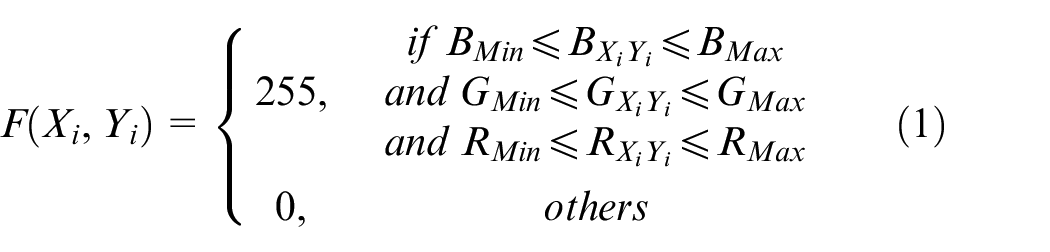
Color separation is used to filter pixels in images that satisfy a specific red, blue, and green (RGB) value range and to highlight the pixel characteristics for subsequent image processing. If the R, G, and B values in the image are within the upper and lower thresholds, the gray value of the pixel is set as 255. When one of the values exceeds the upper or lower thresholds, the gray value of the pixel is set as 0. The mathematical formula for pixel filtration is presented in equation (1), where BXiYi, GXiYi, and RXiYi represent the RGB value of the input pixel; BMin, GMin, and RMin represent the lower RGB threshold of the pixel; BMax, GMax, and RMax represent the upper RGB threshold of the pixel; and F (Xi, Yi) is the gray value of the output pixel.
Top-hat morphological operation
The top-hat operator combines the image subtraction and opening operations. The operator is mainly used to separate blobs brighter than the adjacent pixels. The top-hat operator subtracts the altered image from the original image. The operator formula is presented in equation (2), where Top Hat (src) is the altered image obtained after top-hat operation, Src is the original image, and Open (src) is the altered image obtained after the opening operation.

Extracting contour features
To obtain the contour information of the defective features of CV joints, this study used the find contour function in the Emgu CV image library to extract contour features from the binary image.
Definition of defect parameters
To determine whether the contour obtained through the find contour function was a defect feature, this study used three parameters to determine whether the contour was a defect feature. In Figure 3, the vertical purple rectangle is the bounding box and the tilted green rectangle is the smallest bounding box of the envelope contour feature.
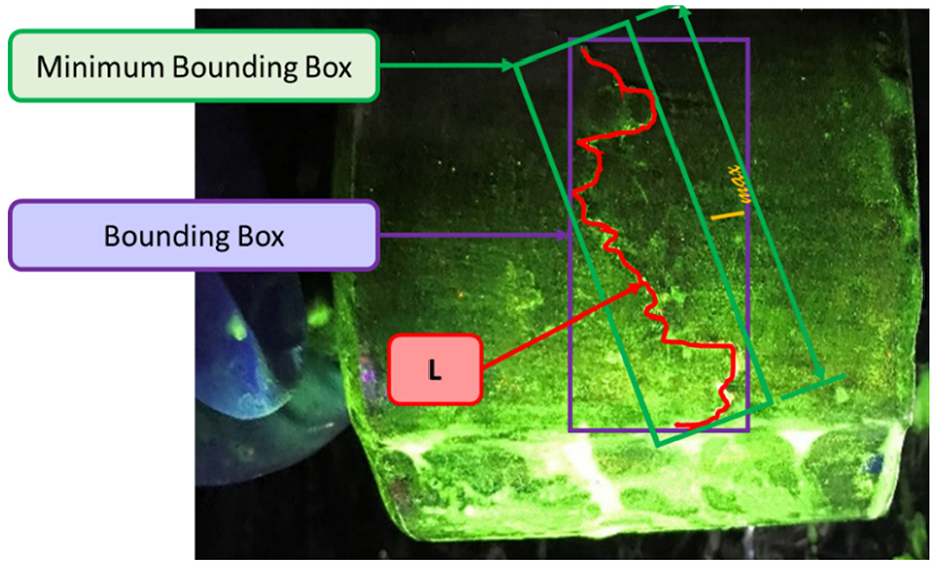
Schematic of the bounding box and minimum bounding box.
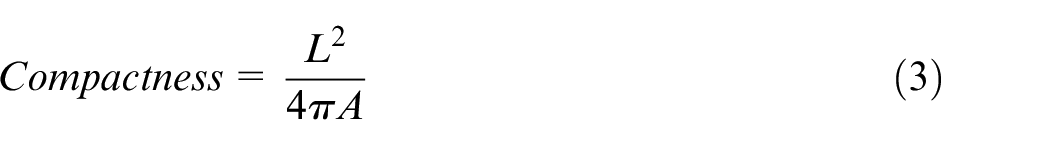
Compactness
Compactness is defined as the similarity of a feature to a circle. The expression for compactness is presented in equation (3), where L is the contour perimeter and A is the contour area. The closer the compactness value is to 1, the closer the feature is to a circle. However, geometric features of defects are irregular and slender. The main purpose of the compactness threshold value is to satisfy the basic requirements of defects when the compactness of the found contour is greater than the set threshold.
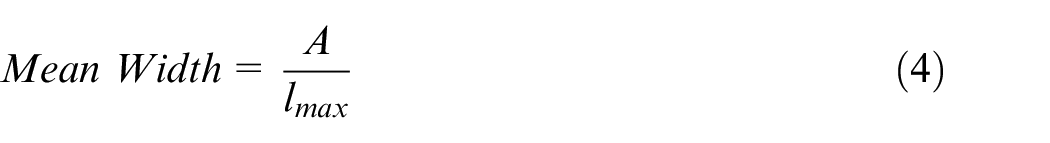
Mean width
The mean width is the ratio of the contour area to the length of the longest side of the minimum bounding box. The expression for the mean width is presented in equation (4), where lmax is the length of the longest side of the minimum bounding box. The smaller the mean width, the more likely is the feature to be a crack.
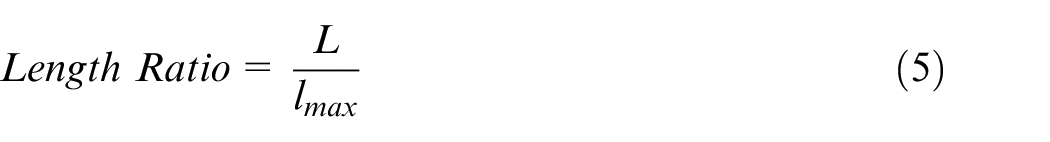
Length ratio
The length ratio is the ratio of the contour perimeter to the length of the longest side length of the minimum bounding box. The relevant expression is presented in equation (5). If the length ratio is equal to 1, the characteristic shape may be a straight line, and the characteristic shape is a curve if the length ratio is greater than 1.
Optimal light source conditions
In this study, the optimal light source conditions were as follows. Ultraviolet light was used on both sides. This light had an incidence angle of 120° and a level-2 intensity. Moreover, a filter was used for the ultraviolet light source. 15
Neural network
The neural network toolbox in MATLAB software was used for training the neural network. The mean square error (MSE) and regression value (R) were mainly used for evaluating the performance of the training results. The MSE is expressed as the error between the predicted value and the output value. This value should be as small as possible. The R value represents the correlation between the input value and the output value. When R is 1, the input and output values are highly dependent. When R is 0, no dependency exists.
Results and discussion
Analysis of the image of defective features
In this study, 47 defective features and 166 non-defective features were extracted from 25 original images. Subsequently, the geometric features of the contours were extracted. The X-Y scatter plots of the feature contour area to the compactness, mean width, and length ratio are displayed in Figures 4–6, respectively.
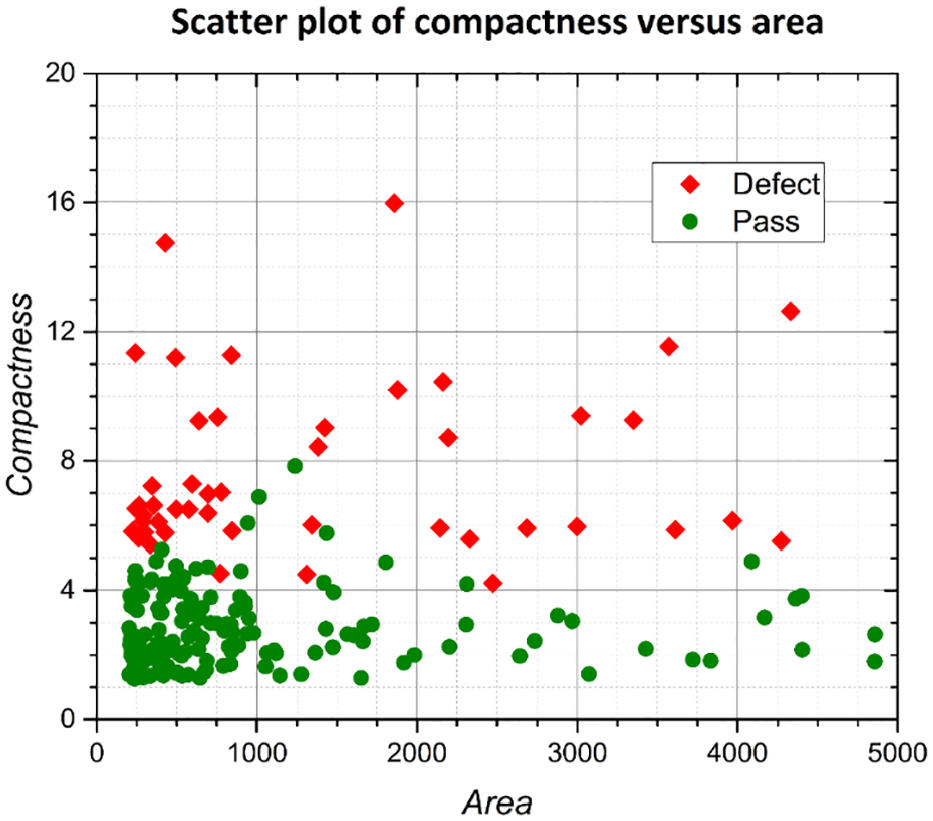
Scatter plot of the compactness versus area.
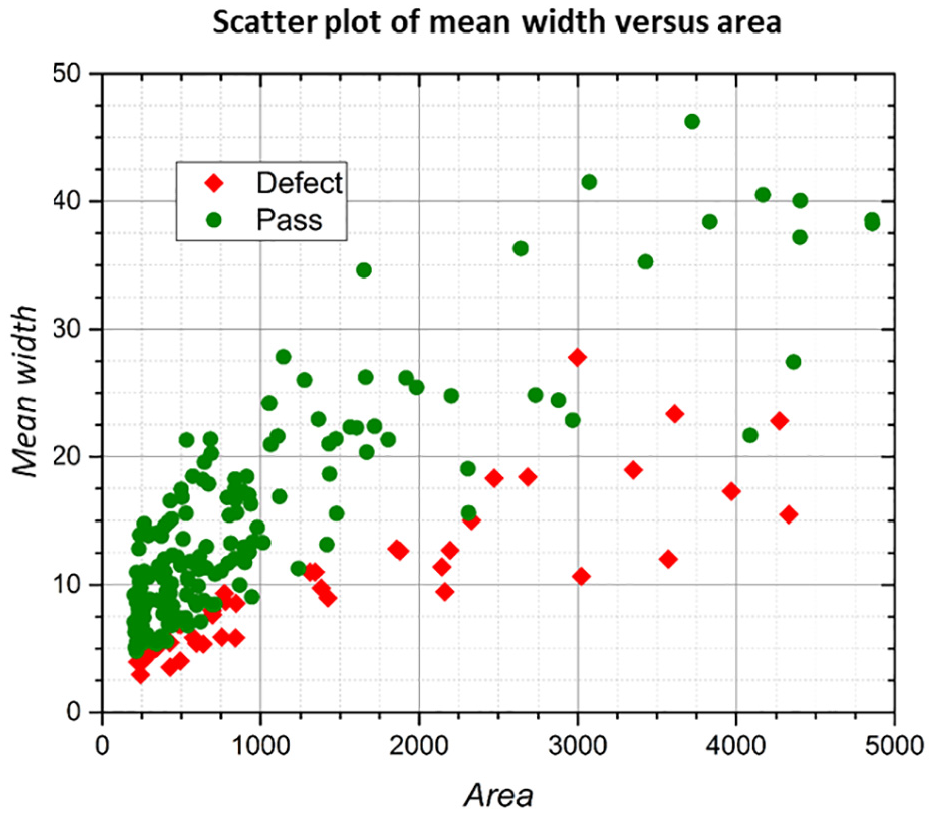
Scatter plot of the mean width versus area.
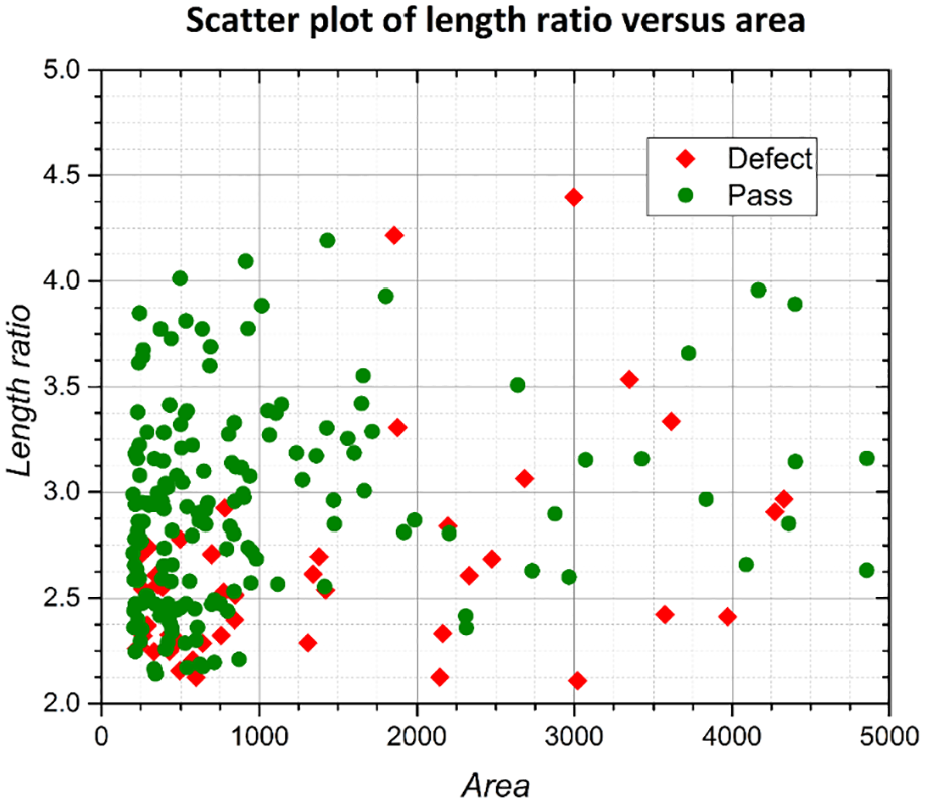
Scatter plot of the length ratio versus area.
As displayed in Figure 4, defective and non-defective features can be clearly distinguished when the compactness is between four and five. However, in Figures 5 and 6, defects and non-defects cannot be distinguished using a threshold value. Therefore, experiments were conducted to investigate whether a neural network can classify defects in a nonlinear manner.
Training results of the neural network
In this study, neural network training was performed on three types of input parameters, namely Type A (area and mean width), Type B (area and length ratio), and Type C (area and compactness) parameters, to determine the feature parameters that can effectively identify defective and non-defective features. A total of 213 pieces of data were collected in this study. The data were categorized into a training set, validation set, and testing set, which accounted for 70%, 15%, and 15% of the data, respectively.
A 2-3-1 backpropagation neural network architecture was used. In this architecture, the input layer contains two neurons, one is the area and the other is the mean width or the length ratio or compactness. The number of hidden layers is 1, and this layer has three neurons. The output layer comprises one neuron, and the output is 1 (defective) or 0 (non-defective).
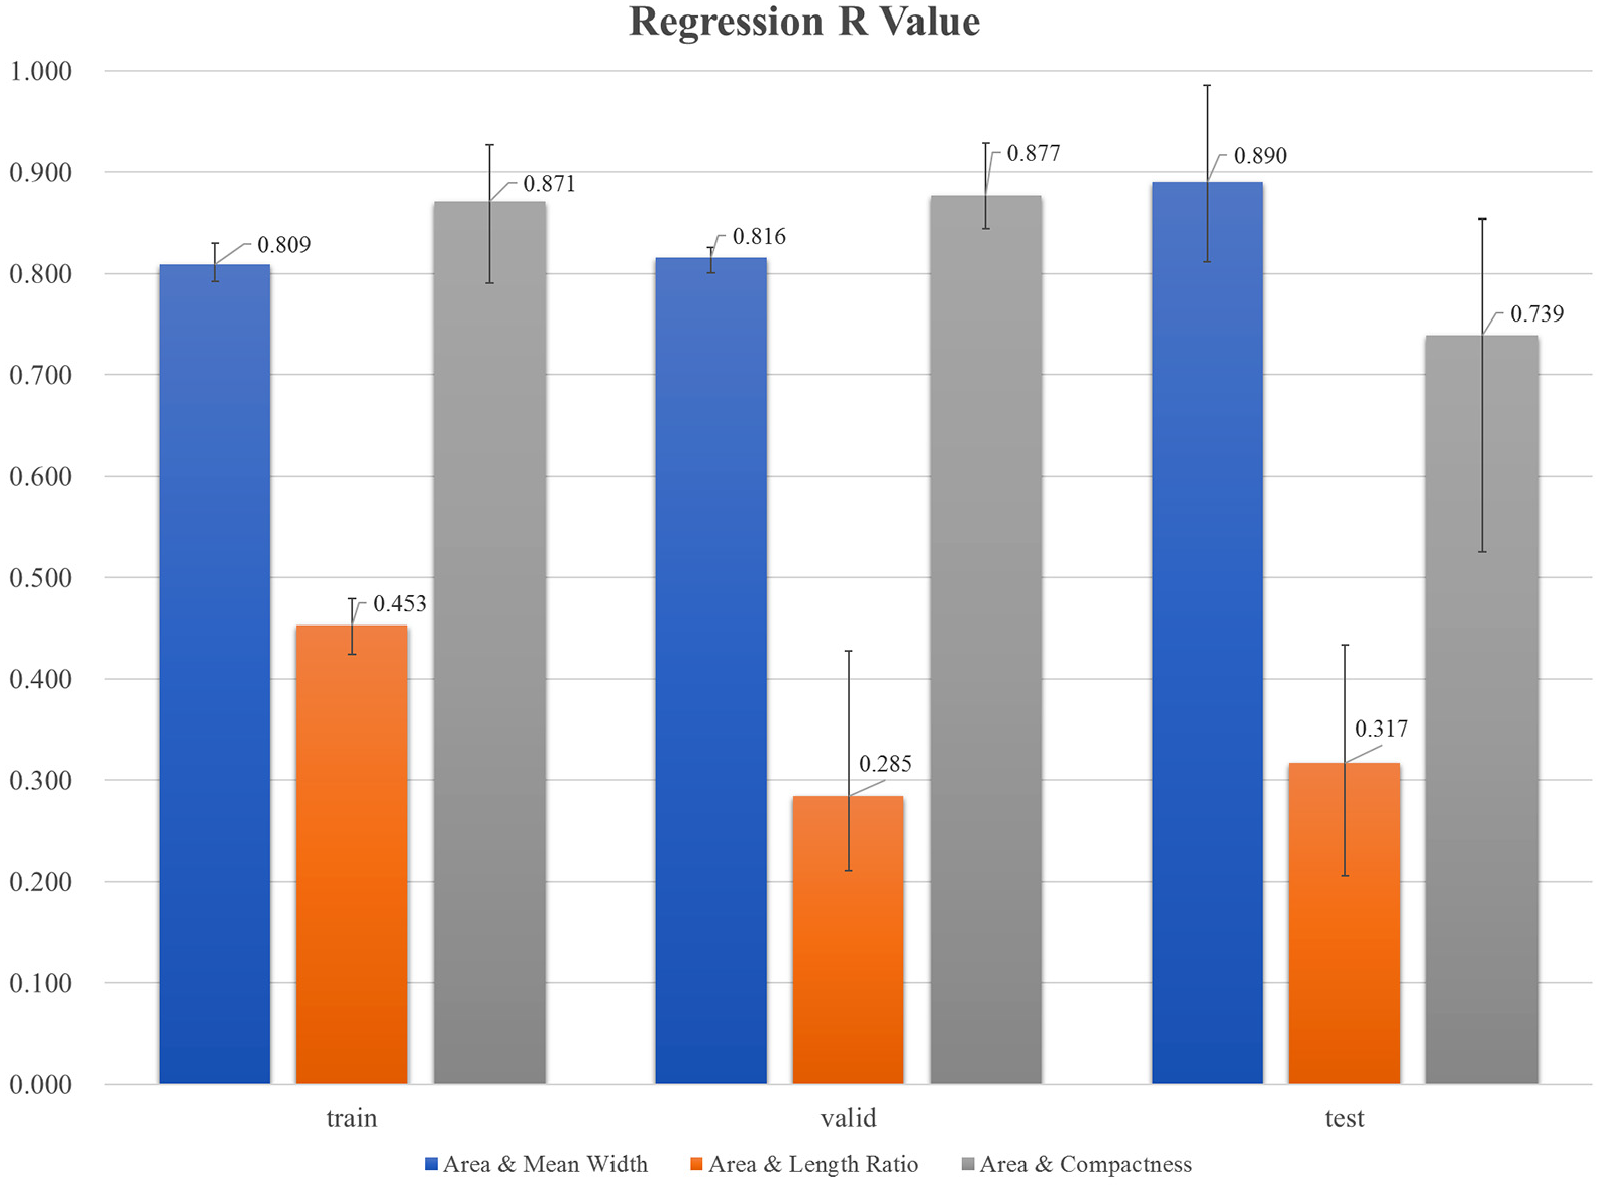
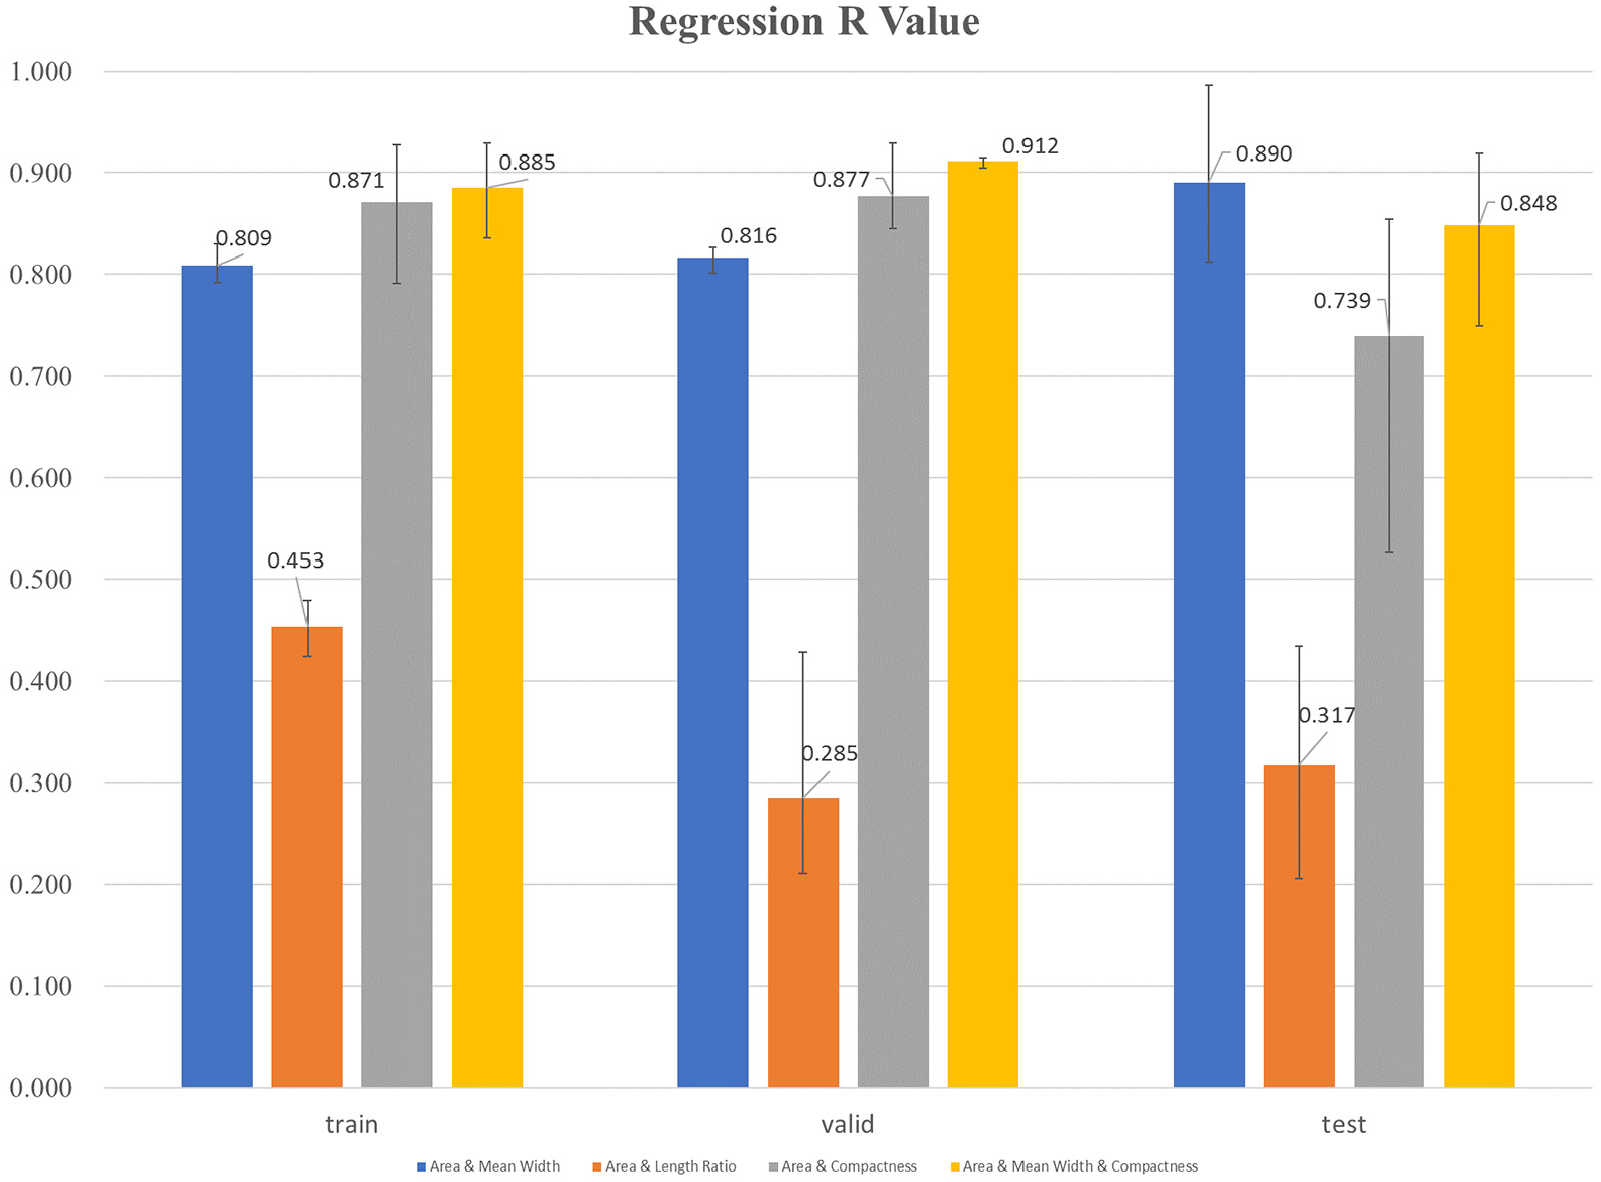
Three types of parameters were used as the input for the neural network, and the neural network was trained thrice for each parameter type. The termination criteria for each training session are presented in Table 1. The distribution and deviation of the R value are presented in Figure 7 and Table 2, respectively. The R values of the Type A, Type B, and Type C parameters in the validation set were 0.801–0.826, 0.211–0.428, and 0.845–0.929, respectively. The total deviation of the R values of the Type A, Type B, and Type C parameters in the verification set was 0.025, 0.217, and 0.084, respectively.
Training termination criteria for the neural networks.
Histogram of R values for the three types of input parameters.
Total deviation of R values for the three types of input parameters.
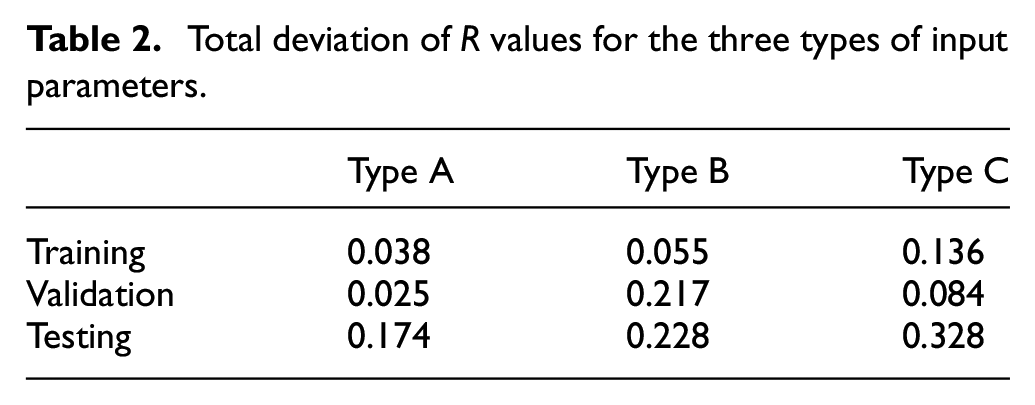
As presented in Table 1, when the input parameters were the Type A and Type C parameters, the R value was greater than 0.8. However, the R value for the Type B parameters was less than 0.5. The total deviation of the R values for the Type A and Type C parameters were less than 0.1, whereas that for the Type B parameters was greater than 0.2. Thus, when the Type A and Type C input parameters were used, a high resolution was obtained for defect identification; however, when the Type B input parameters were used, a low resolution was obtained for defect identification.
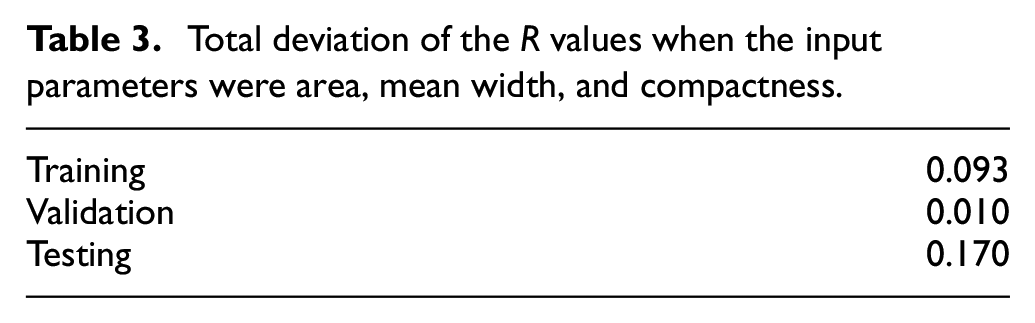
Because the Type A and Type C input parameters exhibited a high resolution for the identification of defects, these parameters (i.e. area, mean width, and compactness) were imported into the neural network for training, and the number of hidden layer neurons was changed to 4. The results obtained after three training sessions are presented in Figure 8 and Table 3. The R value of the validation set was between 0.905 and 0.915, and the total deviation of the R value of the validation set was 0.01.
Histogram of R values for the four types of input.
Total deviation of the R values when the input parameters were area, mean width, and compactness.
Conclusions
In this study, a set of automated optical inspection systems was developed for detecting defects in the CV joints of automobiles. A backpropagation neural network was used to confirm the ability of each parameter to identify the characteristics of defects. The conclusions of this study are as follows:
Defective and non-defective features could be easily distinguished when the compactness was between four and five.
When the input parameters were the Type A, Type B, and Type C parameters, the R value in the validation set was 0.801–0.826, 0.211–0.428, and 0.845–0.929, respectively.
The total deviation of the R values for the Type A, Type B, and Type C parameters in the validation set was 0.025, 0.217, and 0.084, respectively.
When the input parameters were the Type A (area and mean width) and Type C (area and compactness) parameters, the neural network could effectively identify defective features.
When the input parameters were the Type B parameters, the neural network exhibited a low ability to distinguish defective features.
When area, mean width, and compactness were used as the input of the neural network, the R value of the validation set of the network model was between 0.905 and 0.915 and the total deviation of the R values of the validation set was 0.01.
Footnotes
Declaration of conflicting interests
The author(s) declared no potential conflicts of interest with respect to the research, authorship, and/or publication of this article.
Funding
The author(s) disclosed receipt of the following financial support for the research, authorship, and/or publication of this article: The author thanks the Ministry of Science and Technology, Taiwan, for providing partial financial support to this study under grant no. MOST 107-2622-8-110-005- SB2.