
Abstract
Underwater robotics and imaging have emerged as an attractive field due to complications for human divers in a deepwater environment. Inspection of various installations in an underwater environment is carried out by underwater vehicles. The equipment that is used at present requires high computational cost and dedicated only to single task. This results in an expensive hardware and application-oriented technology, hence restricting the versatility of the underwater vehicle. This article proposes a visual feedback–based heading control and tracking method for the autonomous underwater vehicle to provide a versatile solution. The proposed method is used for subsea pipeline corrosion inspection subjected to hydrodynamic disturbances. There are two parts of this study: the first part includes the heading control of the underwater vehicle using visual feedback to follow the pipeline, whereas the second part involves underwater image enhancement and dehazing using wavelet-based fusion for corrosion estimation. The visual feedback and corrosion estimation rely on the same image data during the inspection of the pipeline, hence, reducing the complexity of the overall algorithm. The performance of the proposed method is evaluated on image dataset acquired in an underwater environment where the camera is mounted on the underwater vehicle.
Introduction
Demands for subsea inspection are increasing with a growth in a number of activities in deep ocean. Giant structures are being deployed to explore the underwater world for natural resources, transportation, and surveillance. 1 These structures need constant monitoring and inspection for early detection of defects before any catastrophic failure. Conventional methods for inspection with human divers have health and safety issues. Also, it is difficult to inspect and monitor the underwater installations by human divers at 24 hours a day and 7 days a week with the same precision. Moreover, the constant monitoring and inspection by human divers in deepwater are unviable due to the complex nature of the environment.
The autonomous underwater vehicle (AUV) is an attractive choice to perform the inspection job in place of a human diver in the inhospitable underwater environment. At present, various expensive instruments are used to perform underwater inspection tasks. 2 These instruments include sonars, magnetometers, and videos cameras. 3 –5 Although these devices are helpful in turbid water, however, sonars and magnetometers are limited in their applications. For instance, processing the acoustic data acquired by sonars is computationally intensive. 6 While magnetometers can only enable the AUV to locate the pipelines that are made of ferrous or magnetic materials. 6 In particular, the presence of hydrodynamic disturbance makes it difficult for the AUV to keep track of the pipeline. An intuitive approach is to utilize vision-based solution. Hence, utilization of video cameras with image processing capabilities can provide an adaptive solution for underwater inspection.
Moreover, the AUV together with control and imaging functionality can improve the risks related to underwater inspection tasks and provide a durable and inexpensive solution. 7 The imaging device (i.e. mounted inside the AUV) can also be used as a feedback component as in the studies by Ali and colleagues 8 –11 to control the orientation and functionality of the AUV during the underwater inspection. Thus, the visual feedback controlling technique in AUV could improve the functionality and reliability of the inspection process. Also, this approach is beneficial for constant monitoring and inspection since the approach is easily implementable and computationally efficient and requires a low implementation and maintenance cost compared to other existing methods.
At present, AUVs that are utilized for deepwater pipelines inspection are equipped with real-time data processing capabilities that can be programmed according to the desired task. Often, the feedback controllers are used to control the AUVs under different hydrodynamic disturbances. 12,13 These disturbances make it difficult to control the AUVs to the desired path. The current waves (i.e. a large movement of water in one direction) are the example of the hydrodynamic disturbances (see Figure 1). These hydrodynamic disturbances are a challenge for underwater robotic activities such as inspection and monitoring. In particular, the disturbance can derail the AUV, and this may result in loss of AUV in the ocean. In order to tackle these disturbances, different feedback controllers are used. However, they require sophisticated positioning devices adding the overall cost of the operation.

Water current waves (hydrodynamic disturbances). 10
The vision-based solution to control AUV for the task of corrosion estimation would be challenging. The vision-based solution would ideally require stable illuminance intensity to provide a reliable solution. At underwater, light is mainly attenuated by the effect of absorption and scattering. Turbidity is a nature of fluid which exhibits cloudiness or haziness by a large number of microscopic particles that are not visible to the naked eye. Light in turbid water is attenuated mainly by these microscopic particles which cause the absorption and scattering effects. Absorption attenuates the light, whereas scattering simply changes the direction of light. As the turbidity increases, the amount of light in underwater would reduce. This scenario directly challenges the feasibility of a vision-based solution.
Therefore, it is important to develop a vision-based solution incorporating an approach to overcome the hazy effect of turbid water. The main contribution lies in developing a reliable image processing technique to extract features for visual feedback and corrosion estimation in turbid water. This article will discuss a proposed method for visual feedback–based heading control of AUV for corrosion inspection of underwater pipelines. The proposed methodology will be discussed under two segments: (1) feature extraction for visual feedback–based heading control and (2) underwater image analysis for corrosion estimation on the surface of the pipelines. The remaining of the article will be discussed as follows: The second section describes the visual feedback–based controlling of AUV and pipeline corrosion inspection; the third section discusses the experiment setup; the fourth section contains results and discussion; and the final section concludes on the findings and significance of our proposed method.
Proposed visual feedback–based pipeline corrosion inspection
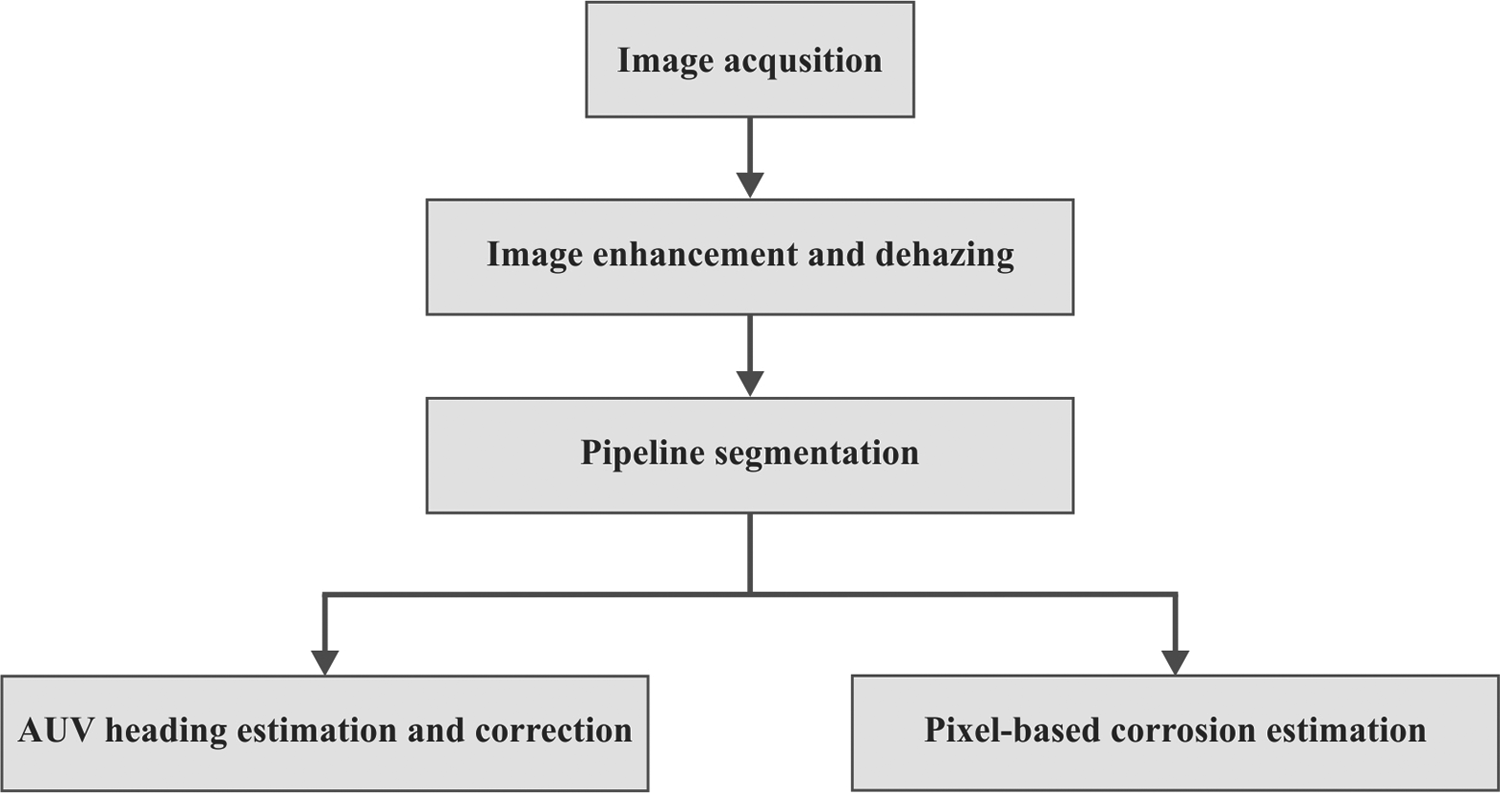
The following sections explain the proposed visual feedback–based method to control AUV for underwater pipeline inspection and corrosion estimation. The complete flow of the proposed method is given in Figure 2. Firstly, the acquired image data is processed in order to dehaze and enhance the image quality. Secondly, the region of interest (ROI i.e. pipeline) in the image is segmented. Finally, both AUV heading correction and corrosion estimation operations are performed simultaneously by further processing the ROI to estimate the direction of AUV using pipeline geometric properties in the image and corrosion detection.
The proposed visual feedback approach for AUV heading control during pipeline corrosion inspection. AUV: autonomous underwater vehicle.
Image enhancement, dehazing, and entropy-based segmentation of pipeline
Image enhancement and dehazing are required to perform image analysis during visual feedback–based heading control for corrosion inspection, and it is necessary to remove noise or any component that could attenuate the information present in the data. As discussed, the underwater images are hazy in nature and are poor in lighting contrast. This reduces the reliability of the information that is retrieved from the data. Therefore, it is important to improve the quality of the images. Hence, we perform image enhancement operation to nullify the hazy effect. The image enhancement operation consists of color and contrast improvement. Following the image enhancement, we undertake fusion process in order to obtain a dehazed image from color and contrast-enhanced images. We also extract the ROI (i.e. pipeline) using entropy-based segmentation for corrosion estimation.
The proposed method for image enhancement and dehazing is shown in Figure 3. Initially, the original image (i.e. hazy image) is processed by an enhancement operation on the image contrast and color profiles. Then, the enhanced versions are further processed by performing the wavelet-based decomposition, fusion, and inverse composition in order to transform the enhanced image of the hazy image into a dehazed image.

Image enhancement, wavelet-based fusion for dehazing and image segmentation for corrosion inspection.
Image enhancement
In image enhancement operation, the hazy image is replicated into two versions for color and contrast improvement using gamma correction method 14 in red, green and blue (RGB) color space as given in equation (1). For color enhancement, the gamma correction is applied in RGB color space with a linear operation so that 1% of data between low and high intensities of the hazy image are saturated. To enhance all three color channels, the operation is performed for each of the spectrums individually. In contrast adjustment, the gamma correction is applied to the hazy image by specifying the contrast limits for all three color channels. The lower and higher contrast limits are defined as 0.1 and 0.8, respectively. By applying gamma correction (with γ = 2), the new intensities are mapped by clipping the intensities below the lower limit (0.1) and above the higher limit (0.8).

where Iin is the input intensity of one-pixel location in the input image, Iout is the transformed pixel intensity and Iin and Iout are in a range of 0 to 1. The γ is a constant and its value varies depending on the application. For instance, γ > 1 makes the image darker and γ < 1 makes the regions brighter.
Wavelet-based image fusion for dehazing
The wavelet-based fusion algorithm consists of a sequence of low-pass and high-pass filter banks. These filter banks are used to separate the detail and approximation coefficients to make the image fusing process convenient. 15
In Figure 4, one-level, 2-dimensional decomposition of the input image into its detail and approximation coefficients is described. Each input image is filtered and down-sampled by a factor of 2. The factor of 2 in the algorithm is used to divide the information contained by the input signal into two equal parts at each step of filtering so that the information can be analyzed deeply. In this scope of the study, we are using two levels of decomposition but in Figure 4, only one-level decomposition is shown. There are two steps in level one, the first step is achieved by applying the low-pass and high-pass filters with down sampling on the rows of the input image x (r, c). This generates horizontal approximations and horizontal details, respectively. In the next step, the columns in the horizontal coefficients are filtered and down-sampled into four subimages 16 : approximate (LL), vertical detail (LH), horizontal detail (HL), and the diagonal detail (HH) as shown in Figure 4. At the second level of decomposition, the decomposed LL image of the first level becomes the input image and the process is repeated in order to scale down coefficients as explained in Figure 4.

One-level-2-D wavelet-based image decomposition. 15
Each input image is decomposed into its wavelet coefficients using the procedure as described above. In our case, both enhanced images, the color enhancement and the contrast adjusted versions of the input image, are decomposed into their wavelet coefficients. Then both decompositions are fused by using maximum values of the coefficients as shown in Figure 5. 17 After combining coefficients of both enhanced images into fused coefficients, the inverse composition is applied to get the synthesized image. For the inverse composition, the reverse process is carried out with the help of up-samples and filter banks in order to get a synthesized or dehazed image X (R, C) (see Figure 6).

Fusion of one-level decomposed wavelet coefficients. 17

One-level-2-D wavelet-based image inverse composition. 15
Since we are dealing with discrete datasets in digital image processing, each input image is decomposed into its coefficients and inversely composed into a synthesized image using discrete wavelet transform and inverse discrete wavelet transform, respectively. In Figure 7, a complete picture of two-level discrete wavelet–based decomposition, fusion, and inverse composition of enhanced images is shown.

Two-level-2-D decomposition, a fusion of coefficients and inverse composition. 17
Entropy-based segmentation of pipeline
After image enhancement and dehazing operations, the pipeline is extracted by segmentation operation as a ROI. The segmentation is required in order to extract the ROI from the other regions of the image. In order to segment the pipeline, the texture properties of the ROI are extracted. Therefore, the entropy H(p) (i.e. a statistical quantity of randomness) is used to predict the texture at each pixel of an input image as given by equation (2)

where p(x) is the distribution of intensity in different color components of the image and logarithm is taken on base 2. In a color image, different texture has different distribution of color intensity. Using this technique, the entropy value of each 9-by-9 neighborhood around the corresponding pixel in the image is calculated. Then the entropy values of all pixels are rescaled into grayscale image. From texture information of the rescaled image, a binary mask is generated to segment the ROI (see Figure 8). A projection estimated from binary mask is applied to refine its edges. Finally, this binary mask is used to segment the pipeline in the RGB image.

Entropy-based segmentation of a ROI for corrosion estimation. (a) The original image of the pipeline. (b) Texture-based rescaled gray image. (c) Binary mask generated by using rescaled image. (d) Required ROI after masking. ROI: region of interest.
Visual feedback–based heading control
The main focus of our proposed feedback approach is to control the heading angle or yaw direction of the AUV. Here we assume that the pipeline is in the vicinity of the AUV and a nominal hydrodynamic disturbance is present (see Figure 9). The block diagram provides an overview of the control strategy of the AUV for controlling the heading direction. The feedback using the visual feature as shown in visual feedback block will be our proposed enhancement to the existing framework to improve the heading direction of the AUV.

A visual feedback–based heading control system for AUV. AUV: autonomous underwater vehicle.
The advantage lies in the fact that image processing is already a part of corrosion inspection, which can be utilized in visual feedback–based control of heading direction/angle. The angle of the pipeline in the image gives a reference to the orientation of the vehicle with respect to the pipeline. Therefore, the desired heading direction/angle of the AUV can be estimated by inspecting the images (see Figure 10). The red arrows illustrate the false orientation of the AUV compared to the desired heading angle and the green arrow illustrates the heading angle of the AUV that is oriented correctly. For our convenience, we consider the correctly oriented angle of AUV (i.e. green arrow) as 0° reference point.
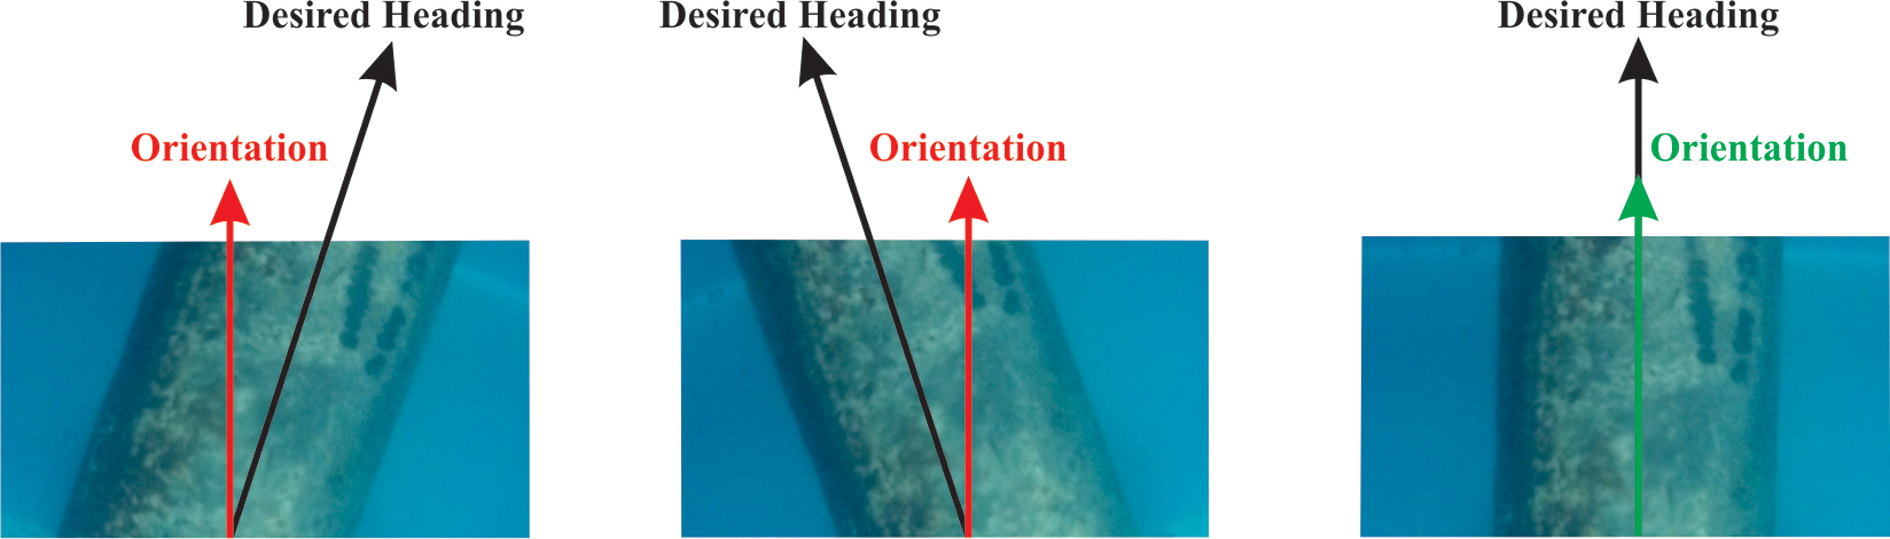
The images of different scenarios of desired heading and orientation of AUV. AUV: autonomous underwater vehicle.
The acquired images are processed in order to determine the angle of the AUV with respect to the pipeline. Then the angle of the yaw direction is adjusted by comparing it with the computed correction angle. Finally, the deflection commands are generated to direct AUV accordingly. The vision-based system comprises of series of image processing operations such as pipeline segmentation and AUV orientation estimation based on the geometry of the pipeline in the image. In order to segment the pipeline, the Canny edge detector 18 is used to get the edges of the pipeline (see Figure 11(b)). Finally, the boundary of the pipeline is extracted using the pixel connectivity and boundary properties of the structure.

Pipeline segmentation for correction angle calculation. (a) Desired heading and orientation of AUV. (b) Canny edge detector output. (c) Pipeline edges with removed unwanted pixel. AUV: autonomous underwater vehicle.
AUV orientation estimation based on pipeline geometry
The AUV orientation is estimated by detecting the geometric properties of pipeline in the image. As mentioned earlier, the AUV heading direction can be estimated from the image by comparing the orientation of the AUV to the orientation of the pipeline in the image. Therefore, adjusting the orientation of the pipeline in the image would result in extracting features to correct the orientation of the AUV. By other words, the yaw angle of the AUV can be adjusted by correcting the angle of the pipeline. Hence, we use the trigonometric properties of the triangle to estimate the heading angle that is used to correct the orientation of the pipeline.
For this purpose, we used four specific pixel locations. The pixel locations are localized to the two vertical edges (i.e. P1 (xi, yi), P2 (xj, yj)) of the pipeline (see Figure 12) and the corresponding pixel location of the adjacent axis of the image/frame (i.e. P3 (1, yi), P4 (1, yj)). The horizontal Euclidean distance between each pair of pixel location is calculated (see equations (3) and (4)). The pixel locations of P3 and P4 are shifted to points
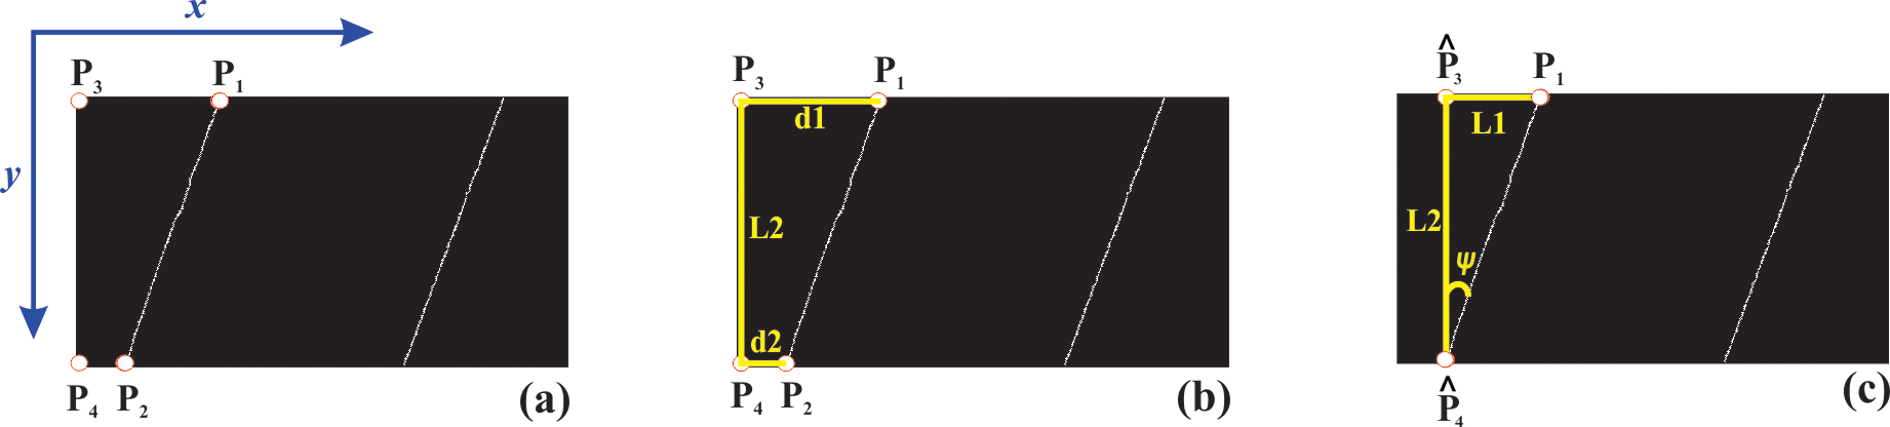
The geometry of pipeline for correction angle calculation. (a) Selected four-pixel points for correction angle calculation. (b) Labeled distances between each pair of points. (c) Shifted pixel points with a perfect triangle.

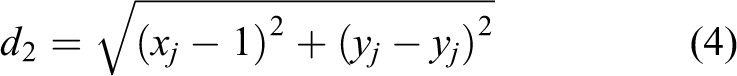
where d is the distance measurement which is calculated by extracting the shortest distance to the points P3 (xi,yi) and P4 (xj,yj). The shortest distances are extracted (see equation 5) by a comparison function (i.e. minimum of d1 and d2). The fundamental idea of this operation is to triangulate the four points as P3 shifts to


where


Finally, we apply the horizontal and vertical distance measure of the triangular points to calculate Ψ angle (see equation (10)). This angle is used as a feature to make the correction to the yaw direction of the AUV. The complete process for correcting yaw direction of AUV is described by the flowchart in Figure 13.

A visual feedback–based approach to correct yaw direction of AUV. AUV: autonomous underwater vehicle.
Pixel-based corrosion estimation
Once dehaze and segmentation operations on the image are completed, the corrosion is estimated in parallel to the AUV yaw direction correction process. The corrosion is estimated on the binary image of the dehazed image. In this regard, we classify the binary pixels in terms of detected corrosion pixel and background pixel. The detected corrosion pixel is classified as the white pixel (i.e. ‘1’) and the background pixel is classified as the black pixel (i.e. ‘0’) (see Figure 14). To make the corrosion estimation process precise, the ROI is defined by segmenting the pipe from other objects in the image. The binary conversion of the color image is carried out by converting the RGB image to grayscale and thresholding the pixels using Otsu thresholding method. 19 The corrosion is estimated in terms of the percentage of the detected corrosion pixel and background pixels of the ROI (i.e. the segmented pipe).

The binary version of ROI with corrosive and noncorrosive pixels. ROI: region of interest.
Experiment setup
The experiment setup for our proposed methodology is carried out under three sections: experimentation for image enhancement and dehazing, AUV orientation estimation, and corrosion estimation. To conduct the experimentation, we performed data collection using Novatek SJ5000 sports action (14MP) camera by SJCAM in a lab environment. In order to validate the proposed method for AUV orientation estimation, we collected data from HydroView MAX, a remotely operated underwater vehicle (ROV), in the Offshore Engineering Laboratory (OEL), available at Universiti Teknologi PETRONAS. The OEL consists of a wave tank facility (HR Wallingford) as shown in Figure 15(a). The wave tank has a volume of 300 m3 and facilitates with multielement wavemaker for 3-D basins. The wavemaker has the capability to generate the water waves of different required amplitudes. In order to measure several parameters during experiments under hydrodynamic disturbances, the tank is also equipped with useful instruments such as vectrino velocimeters, wave gauges, pressure transducers, submersible load cells, accelerometers, and inclinometers.

Calibration and testing of ROV in a real environment. (a) Offshore laboratory with wave tank facility. (b) Real environment experiment setup. (c) ROV during experiment. (d) ROV with defined three axes (roll, pitch, and yaw). ROV: remotely operated underwater vehicle.
Underwater scenario (including turbidity) has been reproduced in a controlled environment as shown in Figure 15(b) and (c). The ROV is equipped with orientation, depth, and temperature sensors that enable the controlling and feedback process. The ROV can sense orientation in all three axes (i.e. roll, pitch, and yaw) as defined in Figure 15(d). A high-quality HD (720p) camera with autofocus is mounted in front of the ROV for live video recording and image acquisition. The ROV can perform up to 45 m of depth in water and comes with a tethering cable of 23 m with the extension of 38 m.
For operations in a dark environment, an light-emitting diode (LED) light with controlled intensity is also installed. The ROV has Superscalar ARM Cortex-A8 Processor at 1 GHz (Cortex C64X + DSP Core), 512 MB DDR RAM, and embedded Linux. In order to communicate with external devices, a topside box with wireless local area network (LAN) (802.11 standards) is supplied. The topside box is connected to an external computer (Core i7 with 2.2 GHz processor and 8 GB RAM) through wireless LAN for image acquisition. Finally, the validation was performed to measure the reliability of our proposed methodology. Validation was carried out individually for each functionality (i.e. image enhancement and dehazing, AUV orientation correction, and corrosion estimation) of our proposed method.
The image enhancement and dehazing were carried out using the proposed wavelet method and corresponding images of the hazy image, color corrected image, contrast adjusted image, and dehazed image are shown in Figure 16. The validation for the AUV orientation correction was carried out by verifying with respect to the corrected yaw direction. The validation of the corrosion estimation was performed in terms of a comparison to the ground truth, hazy, and dehazed images.

Image quality comparison: (a) hazy image, (b) color corrected image, (c) contrast-enhanced image, and (d) dehazed image.
Results and discussion
This section discussed the performance of the proposed visual feedback–based controlling method and image analysis for corrosion estimation. For visual feedback–based control system, it is important to know the direction of the pipeline in the image data. So, in order to control the yaw direction of the AUV, the angle of the pipeline in the image is calculated. This corresponds to the correction made to the orientation of the AUV. Therefore, the degree of the extracted angle is qualitatively verified to the desired yaw direction. The calculated pixel points and length of sides are listed in Table 1. The yaw correction angle Ψ is used to correct the orientation of the AUV from 0° reference point. The positive and negative angles show the desired moves from a 0° reference in clockwise and counterclockwise directions, respectively.
Calculated angles of the pipeline based on its geometric properties in the images captured by the underwater camera.

Similarly, the images captured using ROV in offshore facility are processed to validate the proposed methodology. The calculated angles of the pipeline are given in Table 2. The calculated angles of the pipeline (i.e. orientation of AUV) are communicated to the controller of AUV to achieve the desired orientation along the pipeline. In Figure 17(a), the pipeline at different angles in the images depict the orientation of the AUV without feedback, while the expected orientation with proposed visual feedback control is shown in Figure 17(b).

(a) AUV orientation without feedback. (b) Expected orientation with proposed visual feedback control. AUV: autonomous underwater vehicle.
Calculated angles of the pipeline based on its geometric properties in the images captured by ROV.

ROV: remotely operated underwater vehicle.
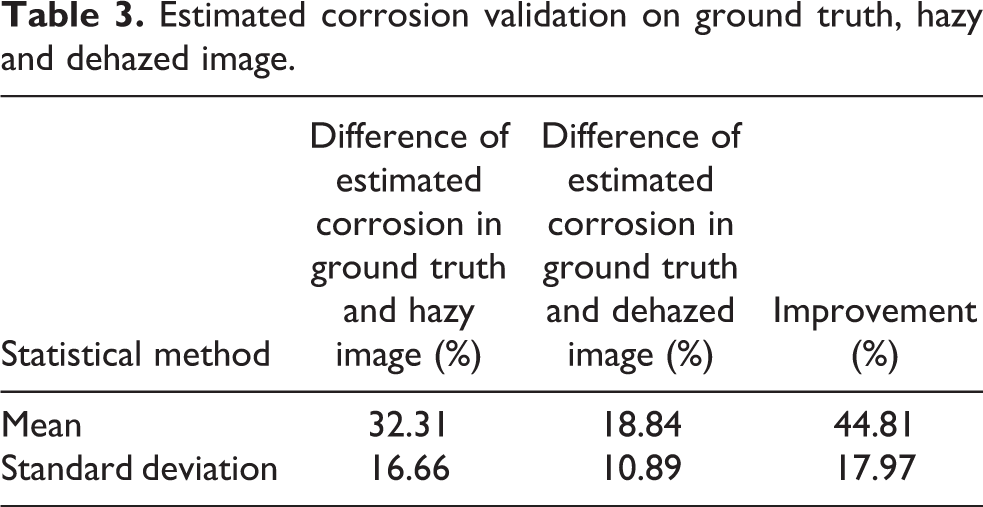
The 60 different images of the corroded pipeline with different levels of affectedness were selected from the dataset to estimate the corrosion. The corrosion estimation was performed on the ground truth, hazy image, and dehazed image, and the results were compared to each other. The results were calculated as a function of the difference between the percentage of the corrosion estimation of ground truth and hazy image, and ground truth and dehazed image. The validation was done in terms of the mean of the percentage and the standard deviation (see Table 3). The validation shows that the proposed method was able to estimate corrosion much efficiently by adopting the image enhancement and dehazing operation. The proposed method reported a low error rate in the corrosion estimation with respect to the ground truth and also exhibited an improvement of the estimation reliability by 44.81% with a Standard deviation of 17.97%.
Estimated corrosion validation on ground truth, hazy and dehazed image.
Conclusion
This article presented a solution for heading control of AUV for pipeline inspection. The study proposed a visual feedback–based autonomous model for heading control and an underwater pipeline corrosion detection model for pipeline inspection. The proposed solution consisted of an image enhancement and dehazing process which minimize the effect of haziness. The proposed method was tested on image dataset, acquired from a high-resolution underwater camera and the built-in camera of ROV, with corroded pipes in a controlled environment. The extracted results were compared to the ground truth. The validation was performed individually for each section such as image enhancement and dehazing, AUV orientation estimation, and corrosion estimation. The results show that our proposed method was able to provide a simplistic and cost-efficient solution to solve the issue caused by the hazy effect. Furthermore, our proposed method provided a reliable solution for corrosion inspection. This study is being done on our self-collected dataset. Therefore, future work would intend to validate and enhance the methodology to adapt to different lighting conditions and hydrodynamic disturbances.
Footnotes
Acknowledgements
The authors would like to acknowledge the support and facilities provided by Universiti Teknologi PETRONAS for this research and special thanks to Mohamed Abul Hassan Ameen and Atif Anwer.
Declaration of conflicting interests
The author(s) declared no potential conflicts of interest with respect to the research, authorship, and/or publication of this article.
Funding
The author(s) disclosed receipt of the following financial support for the research, authorship, and/or publication of this article: The authors received financial support from the Ministry of Education Malaysia under Fundamental Research Grant Scheme (FRGS/1/2014/TK03/UTP/ 02/9) and Yayasan Universiti Teknologi PETRONAS for this research and publication of this article.