
Abstract
To enhance virtual reality (VR) generated by tactile displays, we have focused on a novel tactile illusion, called the Velvet Hand Illusion (VHI). In VHI, moving two parallel wires back and forth between the two hands leads humans to perceive a velvet-like surface between their hands. In earlier studies, we revealed that the intensity of VHI could be controlled by a ratio (r/D), where r and D are the wire stroke and wire distance, respectively. According to these findings, we investigate in this study whether a common tactile display is able to produce VHI, and whether the ratio can also control VHI intensity. We prepare a dot-matrix display as a tactile display in which moving one line of the display’s pins is considered as a wire pattern. We investigate the VHI intensity with regard to changing the stroke r and the line distance D using paired comparison. Experimental results show that the VHI intensity is increased or decreased by changing r and D. We conclude that VHI can be created by the tactile display, and the intensity of VHI is controlled by changing the ratio of r/D.
Introduction
Virtual reality (VR) using haptic devices has great potential for use in many fields, such as medicine. 1 –3 The most currently available haptic devices have been developed to generate the macro-geometry properties of an object, such as shape, size, and surface unevenness. Haptic devices such as PHANTOM 4 and the Delta haptic device 5 are designed as a desktop manipulator to generate contact force-moment caused by contact between virtual objects and a probe in cyberspace.
On the other hand, haptic devices using micro actuator arrays have been developed to generate surface pressure distribution caused by virtual contact. We sometimes call these tactile displays. The actuator array is composed of miniaturized piezoelectric actuators or shape memory alloy actuators. Since displacement generated by piezoelectric actuators is very small, vibro-stimulation inducing large sensation of FA II is used to achieve a 5 × 10 array with 2-mm pitch. 6,7 In our laboratory, we are also using a piezoelectric actuator array 8 to achieve an 8 × 8 array with 1-mm pitch. 9
However, it is still difficult for the current haptic devices to produce a sensation of texture because of the imperfection of tactile displays. Since tactile receptors are distributed throughout the skin with ultra-high density and sense different stimuli such as pressure, slippage, humidity, and temperature, the ideal stimulator has yet to be developed. In particular, production of highly distributed actuator arrays is still one of the challenging issues in actuator engineering. Although our tactile display 9 seems to have enough actuator density because of 1-mm pitch, the display area is a very small (7 × 7 mm2), which causes irritation to operators.
We proposed a tactile illusion 10 –13 as an alternative approach to facilitating this ability with advanced haptic devices. We have focused on the mechanism of the velvet hand illusion (VHI) as a type of tactile illusion that produces the virtual feeling of a smooth and soft texture. 13 In VHI, moving two parallel wires back and forth between the hands allows humans to perceive a velvet-like surface between their hands (Figure 1). Earlier psychophysical studies revealed several effective physical constraints on the intensity of VHI. Initially, our study showed that the intensity of VHI depended significantly on the distance between the two wires, 14 so that neither too-large nor too-small wire distance decreased the VHI intensity. Further studies revealed that there was a straightforward relationship between the VHI intensity and the area of skin that was stimulated by the wires (wire stroke). 15,16 The results showed that, when the wire stroke (r) and wire distance (D) were almost identical (r/D ≈ 1), optimum VHI intensity was sensed.

VHI setup. VHI: velvet hand illusion.
Although these previous investigations focused on the variable intensity of VHI based on the previous setup (two wires), it has never been examined whether a typical haptic device, such as a tactile display, can produce VHI. If a haptic device could produce VHI, it would be a great improvement in that a tactile display could produce not only geometric properties but also material properties such as smoothness.
In this study, we investigated whether the tactile display produces VHI or not. First, we produced a tactile mouse for the palm, which is equipped with a commercial tactile display. Since the density of the actuator array is not sufficient to present tactile sensation on the fingertips and VHI is not strongly caused on fingertips, tactile sensation is presented for the palm in this tactile display. Next, we employed magnitude estimation to evaluate the quality and intensity of the VHI generated on the tactile display by comparing two VHI setups and adopting a real velvet sheet as the reference sensation. Subsequently, we performed a series of paired comparison psychophysical experiments to determine whether the VHI strength generated by our tactile display could be controlled or not.
Designing tactile display for this study
Development of tactile mouse
Since we adopted a dot-matrix-type tactile display 9 as our typical tactile display, a refreshable Braille-dot cell (SC10, KGS 8 ) was combined with an optical mouse to produce the tactile mouse shown in Figure 2. The Braille-dot cell was equipped with 12 × 32 = 384 stimulus pins. Each stimulus pin protrudes with around a 1-mm stroke when 200 V is applied to a bimorph piezoelectric ceramic actuator, which pushes up the bottom of the pin. The cell can generate 2384 patterns on its display pad. Since the spacing between two pins is 2.4 mm, placing a line on the tip of the finger is not sufficient to produce VHI because the smallest size of a mechanoreceptor’s receptive fields was measured at around 2 mm in the fingertips. 23 Therefore, we examined VHI in the palm, in which the receptive field size is around 13 mm.

Tactile mouse designed for this study.
Figure 3 shows the schematic block diagram of this tactile mouse, which is very simple. The system is composed of a computer, a digital input output (DIO) board installed in the computer, and the tactile mouse. If the tactile patterns are produced in the computer based on interference calculation between a virtual object and a virtual cursor, on–off data of the stimulus pins are sent to a shift register installed in the controller of the tactile display via serial lines. When all data for one frame are sent, the tactile pattern appears after one strobe signal. The tactile pattern is latched until accepting the next strobe signal. Since the cursor position is sent via USB, the displayed tactile pattern is changed according to the relationship between the cursor and the virtual object.

Schematic block diagram of tactile mouse for palm.
Pilot experiment on tactile mouse
To ensure that our tactile mouse is capable of presenting tactile patterns, we performed a series of pilot experiments, in which subjects judge edge inclination, which is the basic capability to generate patterns. Two-line presentation, which will be described in the next section, is considered as a simple pattern.
In the pilot experiment, the difference between passive and active touch was examined. In passive touch, subjects kept their right hands motionless on the tactile display (Figure 4), then the virtual edges were moved front to back under their hand. In active touch, the subjects moved their hand over the tactile display. Figure 5 shows how we conducted the experiment for passive and active touch.
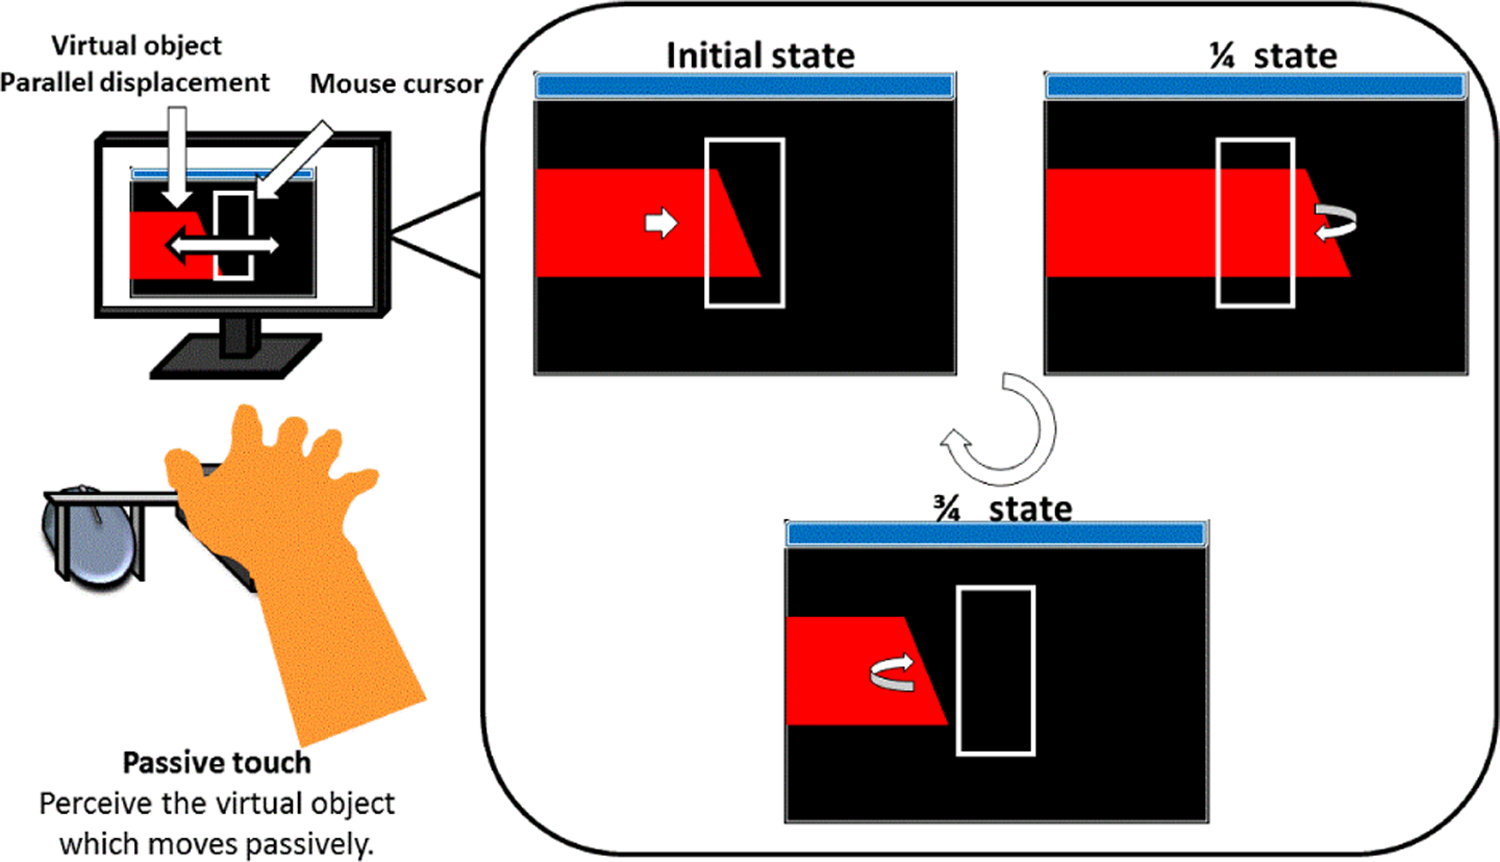
Virtual edge presentation in passive touch of pilot experiment.

Relationship between passive and active touch.
In this pilot experiment, the subjects were instructed to judge the difference in inclination of the edge; we examined variation in the difference threshold obtained from the psychophysical constant stimuli method. The difference threshold means precision of the subjects’ judgment: the smaller the value is, the more precisely the subject can notice the difference of stimuli. In this test, we adopted a constant stimulus (i.e. standard stimulus) and several other stimuli (i.e. comparison stimuli). In one trial, the subjects compared the standard stimulus with one of the comparison stimuli. The subjects judged which stimulus was larger when the standard and comparison stimuli were presented randomly. The experimental condition is summarized in Table 1.
Experimental condition for pilot experiment.

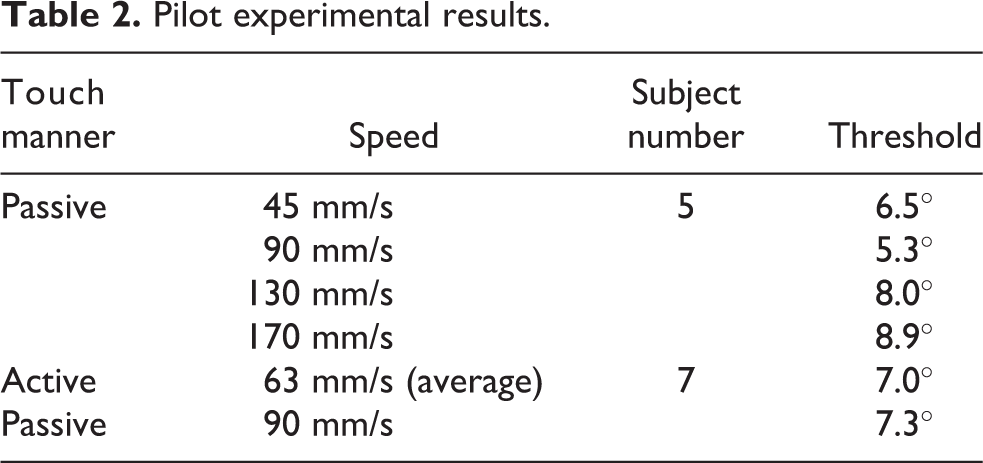
The experimental result indicated that thresholds of passive and active touch are not different (Table 2). This means that edge inclination recognition is processed beyond the motor cortex. Since the threshold of around 7° is almost the same as the threshold of around 6° obtained from the fingertip 17 using real edges, this tactile display has enough capability for edge presentation. Furthermore, when the edge moving speed is 90 mm/s, the smallest threshold is obtained. Therefore, we decided on 90 mm/s for two-line presentation.
Pilot experimental results.
Two-line presentation for VHI
In VHI, first of all a person holds the two wires with their hands pressed together (Figure 1). Then, keeping their hands loosely pressed together so that the majority of their hands’ surfaces remain in contact, the two wires move with no trouble between their hands. Therefore, we conclude that the compressive force and wire-moving sensations are two indispensable conditions for perceiving VHI. Hence, it is important that the tactile mouse also provides these conditions to the hand. In the tactile mouse, when a person places his/her palm on the display of the tactile mouse and the two line patterns are moved, the person experiences VHI because the weight of the hands produces compressive force while the two lines are simultaneously moving, as shown in Figure 6.

Wire movement stimulation using tactile mouse (for experiments I and II).
Psychophysical experiment
Subjects
Ten Japanese males in their twenties participated in the psychophysical experiment of the present study. All subjects were paid for their participation. The subjects reported normal tactile sensitivity, and none reported any neurological disorders. All testing was approved by the Ethics Committee of Nagoya University. All the subjects were naive to VHI.
Stimuli
To compare the intensity of VHI in the initial setups and then the tactile display, we prepared three acrylic frames and one tactile display. One frame consisted of two vertical wires (Figure 7(a)), and the distance between the wires was set based on previous psychophysical findings. 16 More specifically, the study indicated that the intensity of VHI was determined by two parameters: the wire stroke (r) and wire distance (D). In addition, the study showed that the intensity of VHI maxed out when r and D were identical (r/D ≅ 1). In accordance with these findings, we adopted r and D of wires at identical values of 35 mm to create a strong VHI in the hands. The second frame consisted of a grid of wires (Figure 7(b)) in the form of polygons. The third frame consisted of a real velvet sheet as an experimental control condition that we called reference sensation in this study (Figure 7(c)). For all three frames, two polyester films were placed horizontally at a distance of 35 mm on both sides of the frames in order to have the same area of stimulation on the hand skin. The tactile mouse explained in the section “Two-line presentation for VHI” was taken into account as a tactile display that was able to produce VHI in the hand (Figure 7(d)).

Stimuli for psychophysical experiments.
Moreover, previous findings 15,16 showed that intensity of VHI was more controllable when the wires were moved between the hands (passive touch) instead of people moving their hands by themselves (active touch). To create a passive touch for the frames, a motorized x-table (VEXTA, Oriental Motor Co., Ltd, Torrance, California, USA) was employed to make back-and-forth movement (i.e. reciprocating movement). Since we obtained an effective speed for VHI intensity, a constant average speed of 100 mm/s for all conditions was used. This speed was kept constant by the motorized x-table on the frames. For the tactile mouse display, the speed of moving two wire-like pins (i.e. line pattern form) was also matched at almost the same speed (90 mm/s), which was calculated from the pilot experiment (see section “Pilot experiment on tactile mouse”).
Experiment I using magnitude estimation method
A convenient and easy method (i.e. magnitude estimation method 18 ) was applied to this experiment with the purpose of investigating whether the tactile mouse is capable of providing VHI or not. To conduct the experiment, the subjects were seated on chairs with their elbows on a table. For the stimuli including frames (Figure 7(a) to (c)), the subjects were instructed to keep their hands on the two sides of the frame with their hands apart. After receiving an auditory cue, the subjects brought their hands together. In order for the wires or the real velvet to only stimulate the palm, the place to put the hands on the polyester film was specified by drawing a black line (not shown in Figure 7), and the subjects brought their hands together to fit the contour of the line. Another auditory cue notified the subjects that the stimulation was finished, and they let their hands come apart. In the case of the tactile display (Figure 7(d)), the subjects kept the right hand over the tactile display, and, after receiving the auditory cue, they put the right hand on the tactile surface such that the pins of the display only stimulated the palm of their hand. When the stimulation of the hand was finished, the subjects lifted their right hand from the display.
In this experiment, every single run consisted of four trials in which stimuli were presented only once (Figure 8). Every trial consisted of a stimulation period of 7 s and a rest period of 5 s (7 s (stimulation period) + 5 s (rest period) = 12 s). Therefore, the total duration of the single run was 48 s (4 stimuli × 12 s). For every run, the subjects were instructed that the magnitude of the first stimulus was considered as the reference (the numerical value is assumed as 1). The magnitudes of the other three subsequent stimuli were compared to this reference. The subject was allowed to assess any numerical value larger, smaller, or equal to the reference. For example, a value larger than 1 would mean that the subject felt more smoothness or softness on his hand than the reference. In total, we designed 24 runs in a randomized order. Each subject had to respond to 96 stimuli (4 × 3 × 2 × 1 (trials) × 4 (stimuli per run) = 96 stimuli).

Task schedule for single trial in experiment I.
Experiments II and III using paired comparison method
Two more psychophysical experiments were conducted with the purpose of investigating “whether the intensity of VHI in a tactile display can be controlled by the ratio r/D, where r and D are wire stroke and wire distance, respectively, or not.” These experiments conducted after the results of experiment I indicated that our tactile mouse display enables production of VHI (see sections “Result of experiment I” and “Discussion of experiment I”). To examine this, we employed Thurstone’s paired comparison method, 19,20 which is a more robust method for evaluating details of human sensation than the magnitude estimation method. In this method, all possible pairs of a series of specific stimuli were presented to the subjects. For each pair, the subjects chose the stimulus that caused the stronger sense. In our experiments, the subjects were instructed to choose the stimulus causing stronger VHI on their hand.
For experiment II, we prepared five different intensities of VHI by setting different distances between the two lines (D = 9.6, 14.4, 19.2, 24, and 28.8 mm). When the two lines moved toward the end of the display, their direction of movement was changed after one of the lines arrived at the end of the display. Therefore, a reciprocating movement was made by two lines. The stroke of the lines matched the distance between two lines. The speed of moving lines was set at 90 mm/s for all Ds.
All possible pairs of different intensities are shown in the form of a league table (Table 3). In this table, for example, Pair #1 means that the first 9.6-mm stimulus is presented and then the second 14.4-mm stimulus is presented. Then, subjects judged and reported which of these stimuli produced stronger VHI. Every pair was repeated three times in the form of three individual sets. Therefore, every subject reported 60 pairs in total (3 repetitions × 20 pairs = 60). The order of presenting the pairs was designed based on a randomized process. For the first pair of every set, the subjects put their right hand on the tactile display after receiving an auditory cue (similar to experiment I) and kept their hand immobile (Figure 9). The first stimulus of the pair started stimulating the subject’s hand for a duration of 7 s (i.e. stimulation period). After the stimulation period was complete, the subjects kept their hand on the display although there was no stimulation. After 5 s, the second stimulus began. When that was completed, the subjects were instructed to quickly report which stimulus caused stronger VHI. One set was completed when all 20 pairs were presented one time. Then the subjects took a break for 5 min. From this experiment, we were able to obtain the line distance condition that generated the strongest VHI.
League table for paired comparison of experiment II.


Task schedule for single trial in experiments II and III.
In the second experiment (experiment III), we repeated experiment II while substituting different line strokes (r = 9.6, 19.2, 28.8, 43.2, and 55.2 mm) as the experimental stimuli (Table 4). To produce the strokes, the direction of the line movement was changed when one of the lines reached the desired distance, which was matched based on the stimuli (Figure 10). The distance between two lines was adopted for all stimuli at D = 19.2 mm.
League table for paired comparison of experiment III.


Wire movement stimulation using tactile mouse for experiment III.
Experimental results and discussion
Result of experiment I
The subjects’ responses were collected and statistically analyzed using SPSS version 16.0. A one-way analysis of variance was conducted to compare the strength of VHI for the mean of all the conditions. The result indicated that there was a significant effect of different VHI conditions on the strength of VHI, F(3, 36) = 7.349, p = 0.0006. Post hoc comparisons using the Bonferroni test indicated that the mean for the wire grid condition (0.51 ± 0.33, mean ± SEM) was significantly different from other conditions (real velvet 1 ± 0, two wires 0.99 ± 0.32, and the tactile display 0.88 ± 0.24), whereas the mean of the real velvet, two wires, and tactile display were not significantly different (Figure 11). The statistical results also indicate that the intensity of VHI that is sensed in the grid-wire condition is fainter than the reference sensation (i.e. real velvet), whereas the VHI for the two wires and the tactile display induced a similar sensation to the reference sensation. More specifically, the VHI in the two-wire condition was highly close to the reference sensation.
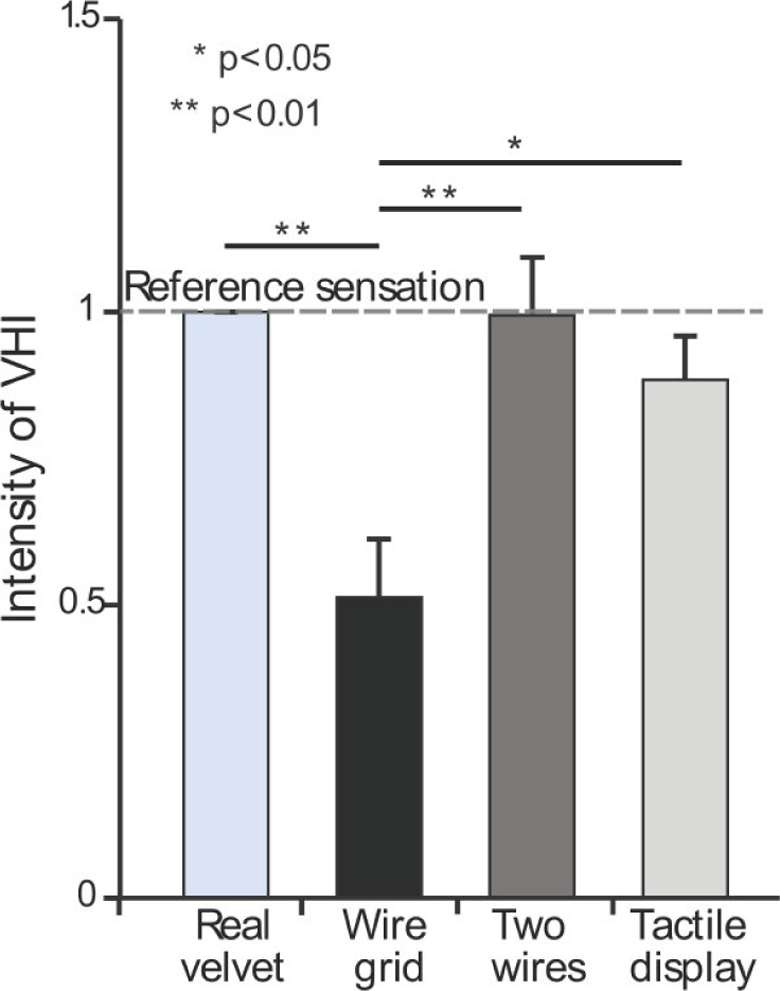
Average magnitudes of VHI intensity in experiment I; error bar shows standard error. VHI: velvet hand illusion.
Discussion of experiment I
Our present study sought to examine the intensity of the virtual smoothness that was produced by different VHI setups. We found that the subjects sensed a stronger virtual smooth texture between two wires than a grid of wires. In addition, this sensation was significantly similar to actually touching a real smooth texture, such as velvet. Therefore, this study provides further evidence that VHI is able to induce a real smooth sensation in human hands and facilitate recreating a smooth sensation in a virtual environment.
These results also support the psychophysiological model, which we proposed in our previous study. 15,16 The model introduced the spatial-temporal component of VHI based on contributing two types of mechanoreceptors in the hand. There are four types of mechanoreceptor afferent units of human skin: two types of slow adaptations (SAI and SAII) and two types of fast ones (FA I and FA II). 21 Slowly adapting type I mechanoreceptors (Merkel-SA I afferents) respond to stationary stimuli to the skin, whereas slowly adapting type II mechanoreceptors (Ruffini-SA II afferents) are two to four times more sensitive to skin stretching. 22 FAI and FAII mechanoreceptors (Meissner-FA I and Pacinian-FA II afferents) are sensitive to various ranges of frequency of vibration. The frequency between 5 Hz and 50 Hz is detected by FA I, whereas frequencies over 100 Hz activate FA II. In VHI, SA I were activated by the existing pressure between the hands (spatial component), whereas FA I mechanoreceptors were activated by moving the wires between the hands at a frequency of approximately 50 Hz (temporal component). According to this, we can conclude that VHI would be sensed in the hand if SA I and FA II mechanoreceptor units are simultaneously activated by moving a wire-like setup (e.g. line of pins on the tactile mouse) on the surface of hand while the hand is touching a surface.
The statistical results (Figure 11) illustrated that there is not a significant difference between the mean of VHI in the tactile display and the two wires; however, some subjects felt stronger VHI in the two wires than the tactile display (we do not show results here). This difference between the intensity of VHI in the tactile display and two-wire conditions occurs because the wires are solid materials that move on the palm surface, thus stimulating all existing mechanoreceptive units on the skin in this area. In addition, although the tactile display can activate all existing mechanoreceptors in the same area of stimulation, there is a distance between the stimulus pins (2.4 mm). Since the somatotype of the mechanoreceptors in the human hand shows a large density of SA I and FA I, 23 the distance becomes large enough for these mechanoreceptors. The number of excited mechanoreceptors plays a critical role in the increase and decrease in VHI intensity. Furthermore, human subjects touch the plastic plate of the tactile display using only one hand, while in the other cases they touch both of their hands together. Therefore, the tactile display generates a weaker virtual smooth texture on the hand.
Although the VHI generated by the tactile display is weaker than that generated by the two wires, the tactile display is able to generate VHI as shown in this magnitude estimation. In the following sections, we will treat the tactile display as equipment generating VHI.
Discussion of experiments II and III
Since the former experiment indicated that the tactile mouse could generate VHI in the hand, we were interested to examine controllability of VHI in the tactile mouse. This would seem essential because a tactile display would be required to produce a variety of illusory smooth surfaces in VR. To examine the controllability of the VHI generated by the tactile mouse, we investigate the VHI intensity with regard to the range of strokes r and line distances D.
In experiment II, we examined a range of line distances from 9.6 mm to 28.8 mm (Table 3). Figure 11 shows the relationship between choice probabilities and line distance D. The choice probability is the probability that a subject will choose the line distance that induces a stronger VHI. From Figure 12, it is interpreted that there is a straightforward relationship between the choice probability and D, so that by increasing the distance between the two lines, the strength of VHI also increased. In addition, it shows that the strength of VHI is almost saturated at D = 28.8 mm.
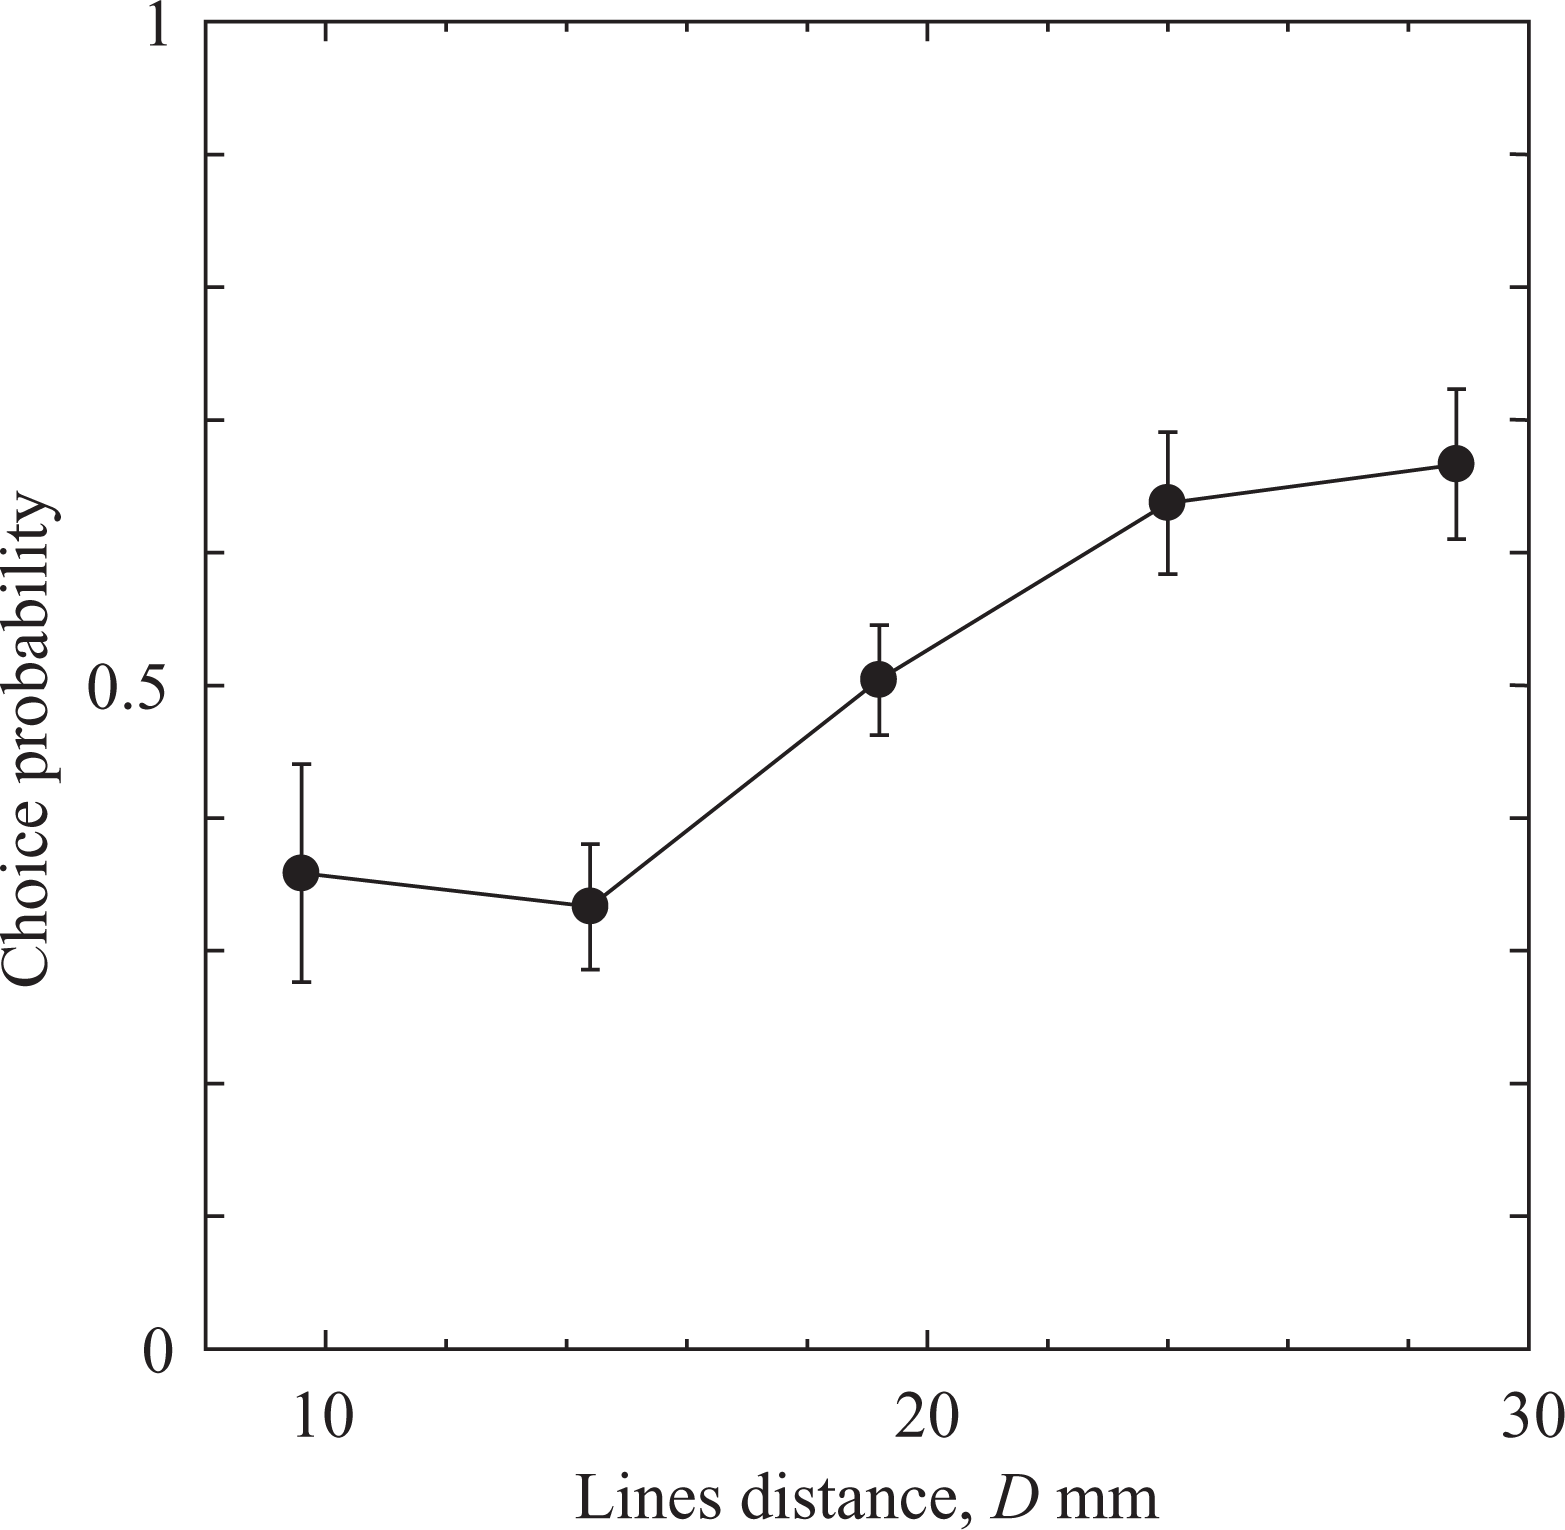
D condition induced strongest VHI in experiment II; error bar shows standard error. VHI: velvet hand illusion.
As described in the section “Experiments II and III using paired comparison method,” since in experiment II stroke depends on line distance, influence of stroke changes was included in the result. We replot this graph using non-dimensional parameter r/D, which was effective for estimating VHI strength in previous studies. 15,16
Figure 13 shows the relationship between choice probability and r/D. The choice probability decreases with increase of r/D; it shows the maximum value at r/D = 1. This result is similar to the preceding experiments, 15 which showed that the maximum VHI occurred at r/D = 1.2. However, this experiment does not provide VHI intensity variation from r/D = 0 to 1.
r/D condition induced strongest VHI in experiment II; error bar shows standard error. VHI: velvet hand illusion.
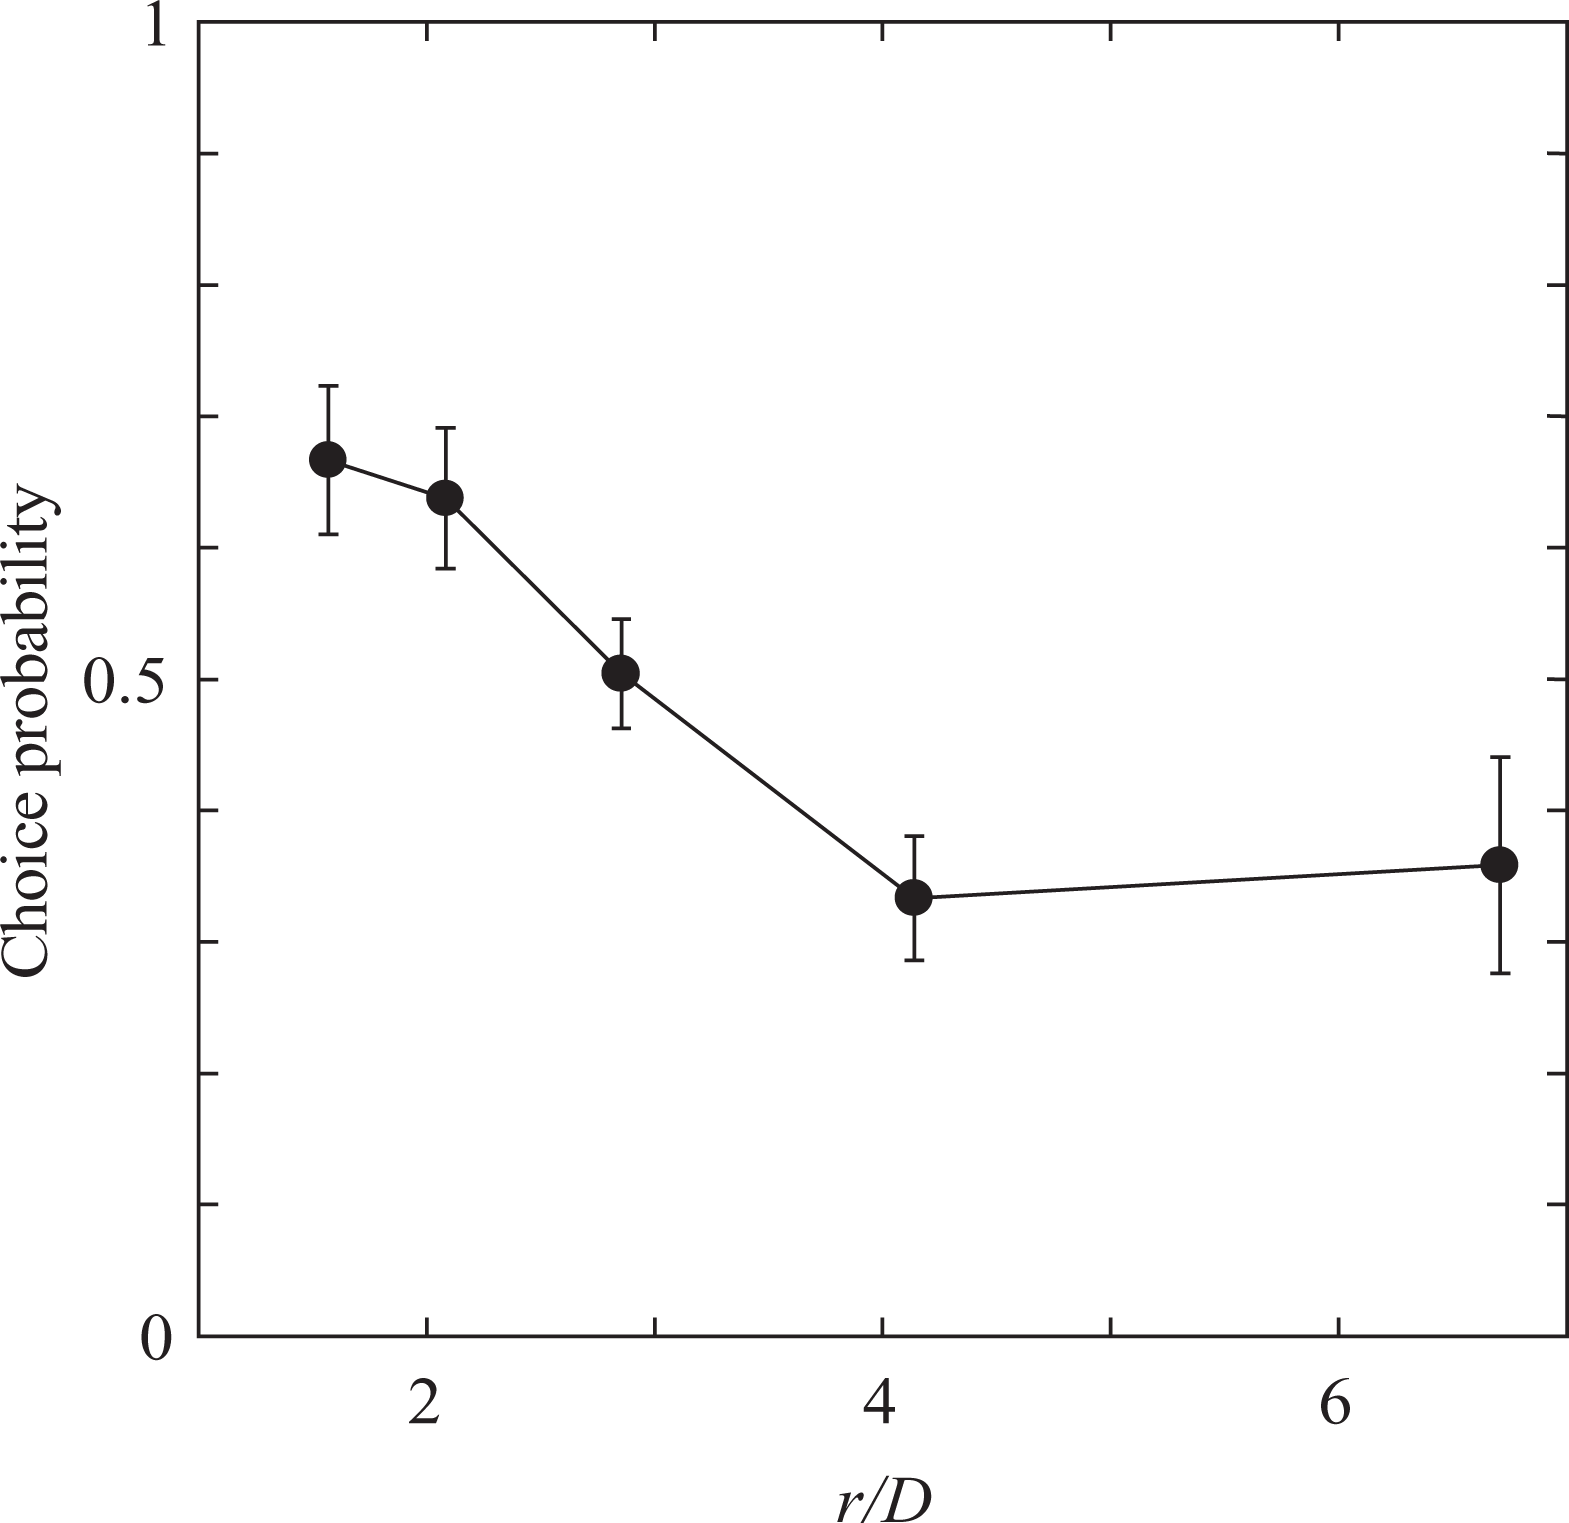
In experiment III, we performed a paired comparison series of stimuli by varying stroke r while line distance was kept at a constant distance of 19.2 mm. In this experiment, the range of r/D was set to make the center range 1.5, and in the preceding experiment, the maximum VHI occurred at r/D = 1.2, 15 which is slightly larger than 1.
Figure 14 shows the experimental results when the subjects experienced changes in r. Since there is no single peak, but there is both a local maximum and minimum, we cannot identify the condition that induced the maximum VHI. However, VHI strength seems to be almost saturated at r/D ≅ 1.5. As a result, VHI intensity reached its maximum at the ratio of stroke to line distance r/D ≅ 1.5. Furthermore, since the r/D is proportional to the VHI strength, it is possible to control the VHI strength in the range of r/D = 0–1.5 by changing r/D.

r/D condition induced strongest VHI when variation in stroke was demonstrated in experiment II; error bar shows standard error. VHI: velvet hand illusion.
Conclusion
In this study, we attempted to achieve the virtual feeling of a textile material such as velvet. For this purpose, we developed a new tactile mouse equipped with a tactile display to stimulate the human palm. Since the tactile illusion VHI generates perception of a smooth and soft surface that does not actually exist, we used VHI to generate the virtual smooth surface feeling.
First, we investigated the intensity and similarity of the virtual smooth texture produced by different VHI arrangements using the reference sensation of touching real velvet. In addition, we investigated whether or not this tactile display is able to produce VHI. In the first experiment, the two-wire setup produced the strongest VHI when the wires were moved between the hands. The sensation was significantly decreased for the wire-grid setup. The VHI sensation produced with the tactile display was somewhat weak compared to the VHI based on the two wires. This indicates that our tactile display is capable of producing the required spatial-temporal component for VHI.
Next, in order to ensure VHI controllability of our tactile display, VHI generation is examined through paired comparison. Consequently, we discovered that, in the range of r/D = 0–1.5, it is possible to control the VHI strength by varying r/D using the tactile mouse and paired comparison method because r = 0 never generates VHI. Therefore, our tactile display can generate VHI and control it in this specific range.
In this article, our tactile mouse has the function of a pointing device, but we did not use this function. We only checked VHI presentation ability of the tactile display. In the future, we will use it for feeling a virtual object surface in cyberspace through moving it while keeping the hand on it. For example, we will further apply our tactile mouse to feeling various virtual objects including textiles such as leather, fur, cotton, and wool.
Footnotes
Declaration of conflicting interests
The author(s) declared no potential conflicts of interest with respect to the research, authorship, and/or publication of this article.
Funding
The author(s) disclosed receipt of the following financial support for the research, authorship, and/or publication of this article: This work was supported by JSPS KAKENHI grant number 15K13855.