
Abstract
A personal care robotic system has been developed that can provide feeding assistance to those suffering from upper limb impairment. The system introduces a novel approach for feeding that prioritizes two ideas: generalized functionality to encompass multiple feeding tasks and seamless user interaction. Additionally, the system leveraged novel computer vision ideas to incorporate functionality that was not reported in the literature. For the functional prototype, the system was comprised of an off-the-shelf six degrees of freedom robotic manipulator, two depth cameras, and an electric gripper. Furthermore, various tools used during the operation were designed and constructed using a 3D printer. The system’s software has three main operation phases: food identification, acquisition, and delivery. One of the novel features of this system is that instead of attempting to identify the food, the robot identifies the method required for acquiring the food. During testing and validation, it was found that the system had minimal identification errors, high success rates for acquisition and delivery, and a fast safety response time.
Keywords
Introduction
Upper limb impairment is a prominent issue that often prevents individuals from completing activities of daily living (ADL). This term is used to describe the fundamental daily activities that individuals can perform without assistance. 1 Feeding is one of these activities. Individuals suffering from this type of impairment often look to personal support workers (PSWs) for feeding assistance. However, there is currently a shortage of PSWs, and they cannot keep up with the demands for service. 2,3 This is particularly a problem for individuals who require assistive feeding. Since PSWs have a heavy workload, they are forced to prioritize efficiency over the needs of the patients. 3 The Ministry of Long-term Care in Canada conducted a survey in 2019. It found that some long-term care institutions surveyed in Ontario did not have adequate levels of staffing on the floor during mealtimes. 4 These problems have led to patients developing unhealthy eating habits, which could eventually result in malnutrition. A viable solution that addresses this issue includes the use of assistive robots. This type of technology could help patients achieve a higher standard of living and provide long-term economic benefits for all parties involved.
Multiple assistive feeding robots already exist within the literature. Some are commercialized devices, and others are still under development in labs. Currently, several commercial robotic products are available that assist in the feeding task, including Bestic, 5 Meal Buddy, 6 Mealtime Partner, 7 My Spoon, 8 and Obi. 9 Other robotic devices are in the research and development stage. These include the iCraft, 10 EEG-Controlled Meal Assistance Robot, 11 Vision Augmented Robotic Feeding, 12 General Purpose Mobile Manipulator, 13 KNRC, 14 and Assistive Dexterous Arm. 15 A detailed survey of the current robot-assisted feeding systems was presented by Park et al. 13
Upon inspection of the literature, it was realized that the high cost associated with assistive feeding robots is the primary factor that has prevented their commercial success. 13,16 However, another reason was that these solutions only attempted to perform a subset of feeding. Most assistive feeding robots scoop the food up with a spoon to feed the user; consequently, they are limited to a certain subset of food types they can manipulate. Some of these devices lack reliable safety capabilities to ensure the user’s safety during food delivery. Some of these robots are not automated and require a PSW to set the device up in a particular position with an appropriate trajectory and feeding location. Additionally, the task paths of these robots must be manually or automatically taught to achieve the feeding operation as they lack a self-learning system. These factors limit the current devices that are available to meet the needs of users and reinforce the dependence of users on caregivers, thereby increasing the costs and complexity of care.
A great deal of inspiration was derived from the novel ideas presented within the literature. The current research investigates a new approach to an assistive feeding robotic system. The system reported in this article was researched and developed to resolve some of the challenges currently facing the development of robot-assisted feeding technology to make it more accessible. Consequently, it prioritizes two new concepts to address some of these gaps and challenges. These concepts are a high level of generalization for the food types it can detect and serve while providing a seamless user experience. Therefore, the developed system will automatically identify the food type and the method required for acquiring the food without any external assistance from a PSW.
The article outlines this novel assistive feeding robot’s design, testing, and validation. It also discusses the experimental results as well as an analysis of the tests used to recognize different food objects and deliver them to the mouth of the user. The experimental methodology involves the use of three distinct modes of food acquisition, including stabbing via a fork, scooping via a spoon, and grabbing via a gripper. Each of these methods is detailed in the article.
System design
Physical setup
The physical setup of the system, outlined in Figure 1, was comprised of a Thermo Scientific F5 six degrees of freedom robotic manipulator, Intel RealSense RGB-D cameras, a Robotiq electrical gripper, and various 3D printed tools. Two RealSense cameras were used. One was mounted on the robot, providing a direct line of sight on the food. A second camera was mounted on a stand affixed to the table, providing a clear and unobstructed view of the user. As for the 3D printed tools, these included a fork and spoon holder, cutlery stands, and a custom-made gripper. The cutlery holders were designed to optimize the motion of their respective modes of acquisition and tool orientation. The stand kept the cutlery holders in a vertical position to maximize the ease of access for the robot when acquiring the tools. The design of the gripper provided a unified solution that enabled grasping both the cutlery holders and their respective food items. Figure 1 shows the coordinate frame for the robot.

Physical setup from the point of view of the user.
System overview
Figure 2 displays a flow diagram that details the software framework for the system. It operates in three phases: identification, acquisition, and delivery of food items. The identification phase used an object detection algorithm to locate the food items and determine if any items had been added or taken away. A clickable graphical user interface (GUI) was provided for system interaction. When the user selects a food item via the GUI, the system scans through its inventory to determine what item was chosen and where it is located. During acquisition, the system determines what tool it needs to acquire the requested food item successfully. The tools that were used included a fork, a spoon, and a gripper. During the delivery phase, the food is brought into proximity with the mouth of the user rather than directly inside. This was done for safety reasons to minimize any risk of the robot making physical contact with the user. The user would need to move their head slightly forward to eat. The robot would not continue any further operations until the user notified the system that this feeding instance was complete. A concurrent background process runs continuously during all phases to ensure user safety. It achieves this by implementing a two-layered algorithm that combines facial recognition and object tracking, which provides the real-time 3D position of the user. The robot will cease moving if the user is not in a safe position relative to the workspace.
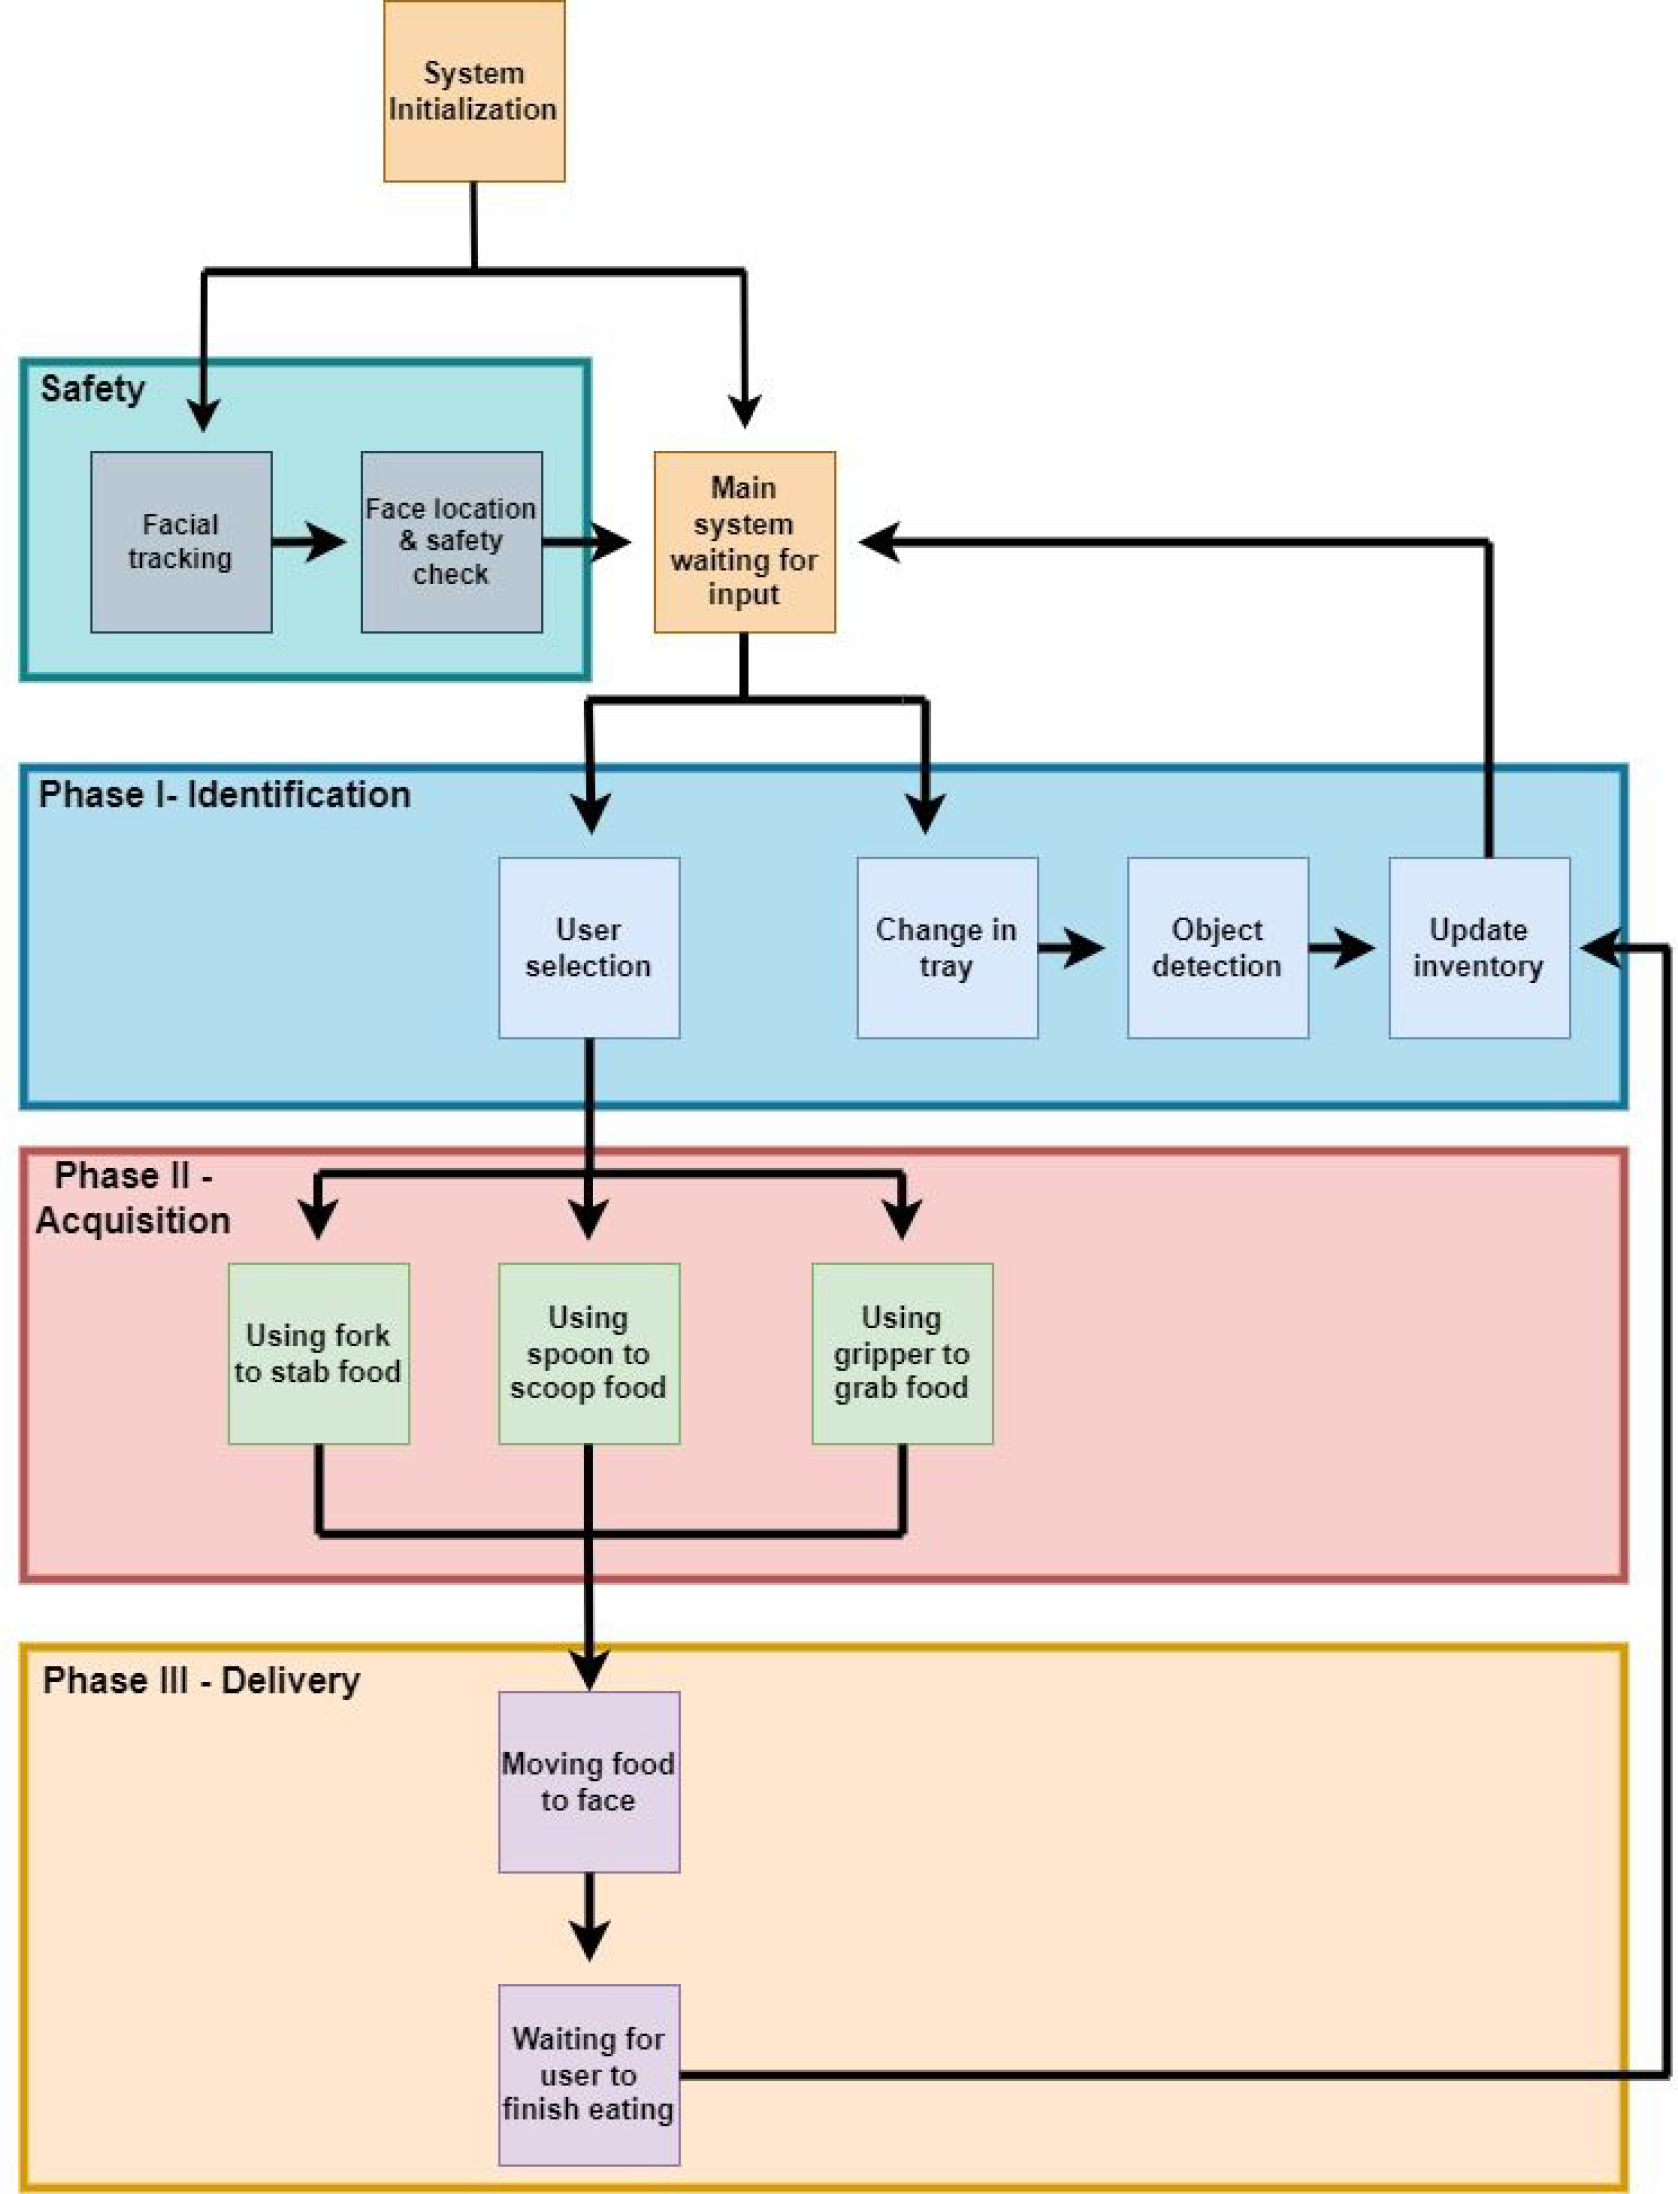
Software framework flow diagram.
Major functionality
This section provides details regarding the major functionality of the system, including facial recognition, object detection, smart inventory, and the modes of acquisition.
Facial recognition
Facial recognition is used to determine the position of the mouth of the user. An open-source algorithm pertaining to the histogram of oriented gradients with a linear support vector machine was used from the DLib library. This model can outline the coordinates for 68 key points on the face of the user. 17 Figure 3 illustrates these key points. The food was always brought to the center of the mouth, at a point which was 1 cm away from the mouth. This was determined by taking the linear intersection between four points: 49, 52, 55, and 58. This provided a simple and robust solution that can accurately detect the center regardless of whether the mouth is open or not. The facial recognition module algorithm processes and identifies the feeding location for different users using the linear intersection between the locations of points 49, 52, 55, and 58 on their faces (Figure 3). The PSWs who assist with feeding recommended the 1 cm distance for the purpose of safety. Users can then move their heads forward and safely pick up the food item from the robot by mouth.

Key points in the facial landmark detection model. 17
Object detection
Object detection models are a subset of deep learning algorithms that can identify and locate objects in an image. 18 These models draw a bounding box around the detected objects and display their labels and confidence score. By convention, these models are trained to identify the name of a given object. This was the approach that was initially taken during this project. However, it was then realized that it was not important for the system to know the name of the food; it only needed to know how to acquire it. Therefore, it was decided that the model would instead identify the method of acquisition for each food item based on its type and nature. This identification and learning phase was achieved by comparing the captured food image with the database of the system. This database includes images of types of food taken under various lighting conditions and at different orientations. For the prototype, three modes were chosen which included stabbing via a fork, scooping via a spoon, and grabbing via a gripper. This novel approach allowed the system to greatly expand on the range of food items it could interact with by adding new items to its database. The open-source object detection model that was used is known as the Faster Region-based Convolutional Neural Network (RCNN) implemented from TensorFlow. The practice known as transfer learning was used, which involves taking a prebuilt model and training it with a custom dataset. 19 The dataset that was used was manually created and labeled by the research team members, as the required data were neither readily available nor abundant. An example of the output of an object detection model is shown in Figure 4, where a bounding box is displayed around each object with its class label and prediction confidence.

Bounding box output from the object detection model.
Smart inventory
An image similarity function was implemented, allowing for the automatic detection of a food item being added or removed from the feeding area. This was achieved by sampling images of the feeding area in real time and comparing each new image to the previous image to check for the similarity of the items. If the similarity has passed a certain threshold, it implies that a certain change has occurred. After recognizing this, the system runs the object detection model to identify and locate the new items to be added to the inventory. The system confirms the existing inventory before adding new items to ensure there are no duplicates. If one of the tray contents is removed, the system adjusts the inventory accordingly. The incorporation of a smart inventory system minimizes the external human involvement required during the operation of the assistive feeding robot. Figure 5 provides a visualization of the change in detection function on the food serving tray.

Visual representation of the image similarity algorithm.
Modes of acquisition
As mentioned earlier, the feeding robot has three modes of acquisition: stabbing via a fork, scooping via a spoon, and grabbing via a gripper. Stabbing via a fork mainly deals with food items that are solid, rectangular, and cut into bite-size pieces. A wide assortment of foods can be altered to take this form, which greatly expands on the number of items that the system can interact with using this mode. Some examples of supported food include fruits, omelettes, cheese, and steak. The second mode of acquisition is scooping via spoon. This mode was designed to interact with food items that come in the form of fluids. Some examples include soup, yogurt, and pudding. Performing scooping is a very difficult task for the robot manipulator due to its original nonlinear nature. For the prototype, the robot only performed an approximation of this motion. It achieved this by simultaneously performing small incremental movements in the X, Z, and pitch directions. During the final mode of acquisition, grabbing via a gripper, the size of the object was first determined, and the gripper was then opened accordingly. The gripper would then descend to the center of the height of the object for grasping. This mode of acquisition is ideal for liquids that are containerized and consumed by drinking. Some examples include a coffee cup, a glass of water, a milk carton, and a juice box. For the prototype, these liquids would require a straw. Figure 6 provides a visualization of these three different modes of acquisition: fork, spoon, and gripper.

Showcasing the three modes of acquisition: fork, spoon, and gripper (left to right).
Experimental methodologies
This section provides a functional analysis to validate the main operations of the system. These operations include identification, acquisition, delivery, and safety.
Identification
Mean average precision (mAP) is a standard metric for the assessment of an object detection model. 20 Within the literature, this is often calculated at three different intersection over union (IoU) thresholds. This includes 50%, 75%, and 50%–95% where the mAP is calculated at 5% intervals and then averaged. This experiment involved training three popular object detection models on the developed dataset for which the mAP was calculated at the different IoU thresholds. The chosen models included Faster RCNN, single shot MultiBox detector (SSD), 21 and you only look once (YOLO). 22 This provided an insight into what model worked best for this application.
Acquisition
The fundamental objective of the acquisition tests was to observe whether the system could successfully acquire the given food item. A single trial was classified as “successful” if an item was acquired and brought to the pre-feeding position without dropping it. For failed trials, manual measurements were taken to document the error offsets. For stabbing via fork, the items that were used included pineapple, egg, banana, cheese, apple, Timbit, bread, and chicken nugget. These items had physical characteristics that varied significantly, which demonstrated how the system was able to perform with a wide assortment of food items. Ten trials were conducted for each item, totaling to 80 trials for this mode of acquisition. For grabbing via a gripper, the items included a coffee cup, drinking glass, milk carton, metallic water bottle, and plastic bottle. These items were selected due to their height and width variances. Analyzing the acquisition of these objects demonstrated how effective the system is at dynamically determining how wide the gripper must be opened. Ten trials were performed for each item for a total of 60 trials. For scooping via a spoon, the items used include soup, pudding, and peanut butter. The yield that is generated per scoop is the most critical aspect of the scooping process. This greatly depends on the viscosity of the fluid; hence, fluids of varying viscosities were selected. Fifteen trials were performed for each item for a total of 45 trials.
Delivery
For the successful acquisition trials, the system performed delivery, which involved bringing the food to the center of the mouth. As mentioned before, a linear intersection between points 49, 52, 55, and 58 in Figure 3 yields this area. The system first moved the food to the predicted mouth position and then manually adjusted it to the actual feeding position, as seen in Figure 7. The feeding location is about 1 cm away from the mouth of the user, with this position being located by the linear intersection of the four points. The Euclidean distance between the predicted and the actual positions was denoted as the delivery error. For these trials, the head of a mannequin was used as it has prominent facial features that are easily detected by facial recognition. For each trial, the X and Z coordinates of the location of the mannequin with respect to the robot were varied. Varying the Z coordinates simulated the condition of users of different heights. In comparison, by varying the X coordinates, the condition of the user sitting at different positions during feeding time was simulated. The Y coordinates could not be properly varied due to the physical setup of the robotic manipulator, as seen in Figure 1. A study by Cazzola et al. 23 reported that the average human neck can be extended forward up to 117 mm. This distance served as a threshold to determine if a delivery trial was successful. Additionally, the effects of varying the X and Z coordinates were analyzed.

Showcasing where the robot initially brought the food (left) and where the position was adjusted to after (right).
Safety
To test the safety system, the average safety response time was tested in three distinct system states: idle, in-motion, and during object detection. The idle state is the default position, the in-motion state is when the robot is potentially the most dangerous as it is moving, and the object detection state governs the largest computational load. For each state, 10 trials were performed, for a total of 30 trials. The response time was calculated by intentionally placing the mannequin within the workspace and starting a timer. The timer was stopped as soon as the system detected the mannequin inside the workspace.
Results
Object detection model comparison
Table 1 shows the results of the comparison between the object detection models. All models had a favorable score at the (IoU) threshold of 50%, which is the standard IoU boundary, but Faster RCNN outperformed its counterparts. This is due to the internal architecture of the model. Faster RCNN first samples the regions of interest (ROIs) from the input image and passes that on to the rest of the model, while SSD and YOLOv4 take in the whole image as input. 24 This causes a foreground and background imbalance while training. Since the Faster RCNN finds the ROIs, this model can easily filter out the background and focus on the foreground, where the objects lie. However, this makes Faster RCNN slower than the SSD and YOLOv4 models in terms of prediction speed. For the purpose of this project, accuracy was more important than prediction speed as the object detection model was not used in real time. With stricter IoU bounding boxes the Faster RCNN had a much lower drop-off for the mAP score. This is because the model is better suited for detecting smaller items. 25,26
mAP values for the different object detection models that were compared.

mAP: mean average precision; IoU: intersection over union; RCNN: region-based convolutional neural network; SSD: single shot MultiBox detector; YOLOv4: you only look once.
Acquisition success rate—Fork
Figure 8 shows the results of the fork acquisition trials. Out of the 80 trials, the robot was successful 67 times, yielding a success rate of 83%. For some items, such as cheese, pineapple, chicken nugget, successful acquisition occurred in nearly all of the trials. This was because of the way these foods were cut up, which enabled for a better alignment of the actual midpoint of the object with the bounding box midpoint as that is where the fork is brought. The same cannot be said for the egg, the banana, and the Timbit, which all had non-rectangular shapes with a curved surface. Since the object detection model only uses rectangular bounding boxes, it is unable to encapsulate the actual shape of the food. This disrupts the midpoint alignment. For the missed trials, the average error in the X and Y directions is 31% and 22% of the average “Fork” item bounding box dimensions. An empirical adjustment to the fork offset values might reduce the error even further. In all the trials, the robot never missed in the Z direction as the midpoint misalignment issues only affect the robot in the X and Y directions.

The success rate of the acquisition trials with the fork.
Acquisition success rate—Gripper
Figure 9 shows the results of the gripper trials. Out of the 60 trials, the robot was successful 45 times. This yielded a success rate of 75%. It was observed that nearly all the misses occurred with the taller objects. This can be attributed to the fact that the object localization process occurs from the default position of the robot, as this maximizes accuracy. In some of the trials, these taller objects were likely placed in a position from where the food camera could not have a complete line of sight on the object. This prevented the system from performing a complete localization, which caused the miss. The cup and milk carton were unaffected by this as they are short enough that wherever they were placed, the food camera always had a complete line of sight. This issue could be mitigated by adjusting the position of the robot during the localization process based on the position of the actual object. For the missed trials, the average error in the X and Y directions was 22% and 21% of the average “Grab” item bounding box dimensions. The error was slightly less than that of the fork acquisition trials.
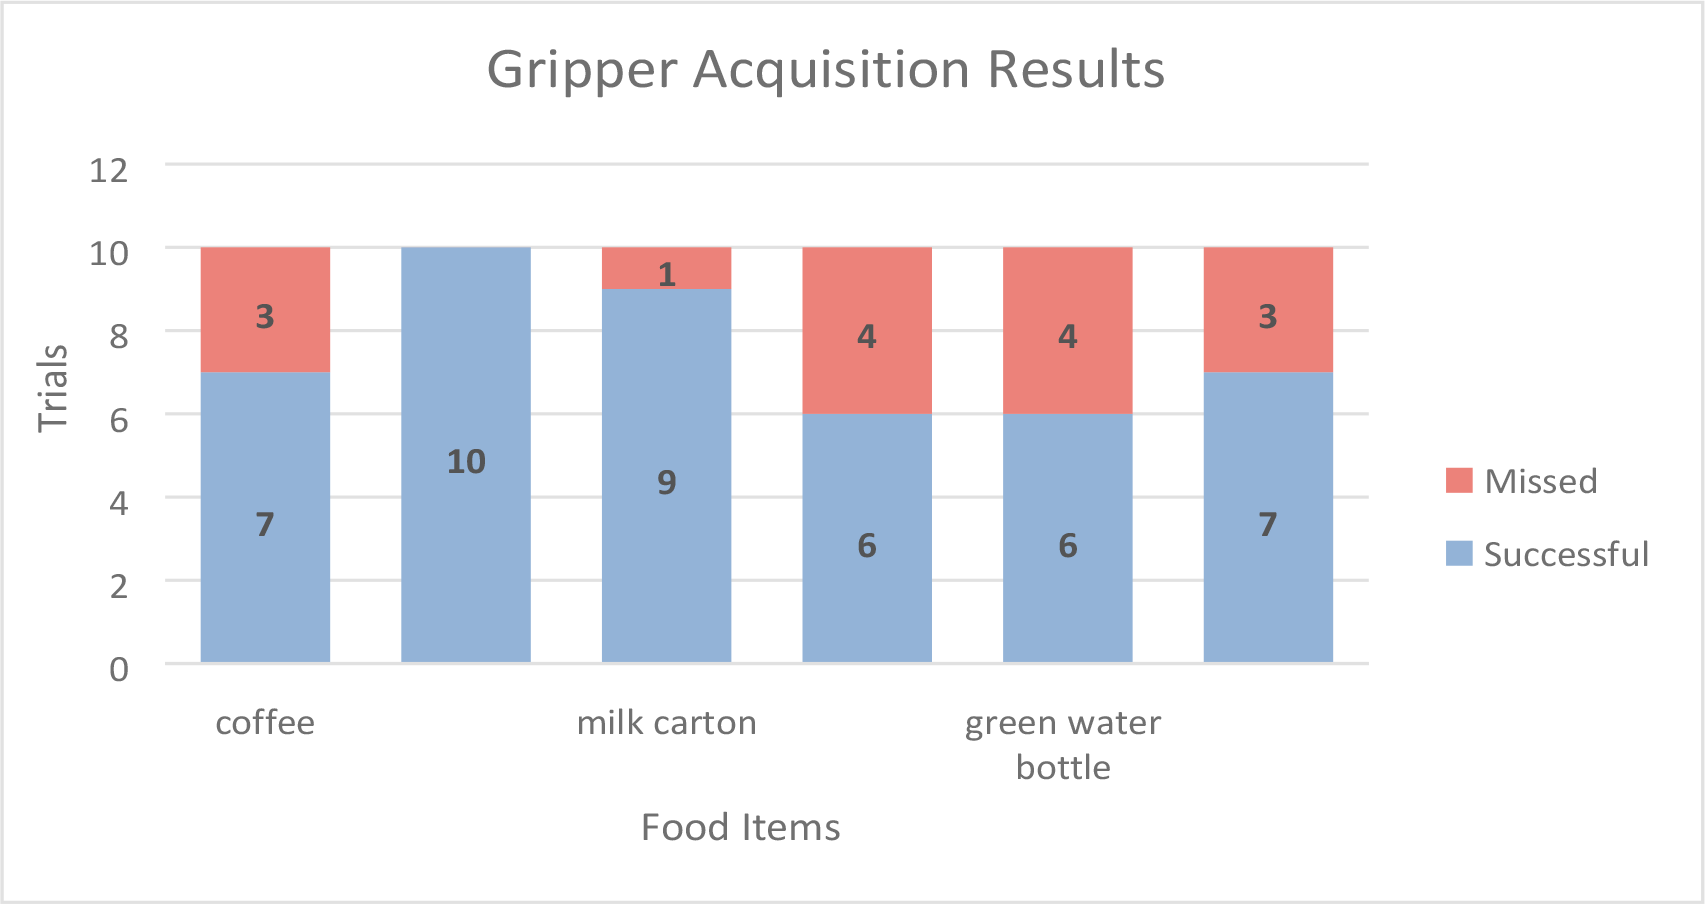
The success rate of the acquisition trials with the gripper.
Acquisition success rate—Spoon
Figure 10 shows the results of the trials conducted using the spoon. The system was successful in each of the 45 trials. This was because the surface area of the acquisition was significantly greater for this mode, making it an easier feat. Nonetheless, these results were still significant because they demonstrated that the system could successfully determine where to bring the spoon.

The success rate of the acquisition trials with the spoon.
Performing analysis on the yield of each scoop provided a better insight into the effectiveness of the scooping process. Table 2 shows the impact that viscosity had on the yield. It was observed that the robot struggled with low viscosity items due to the inherent nature of the scooping motion. It is very difficult for this specific robotic manipulator to perform such an organic motion with the current physical setup. Thus, the algorithm created for this mode of acquisition could only approximate the motion, which resulted in a partial scoop.
The summary of yield per scoop was affected by the viscosity of the food.

The scooping process worked better with higher viscosity food but resulted in poor retention values with low viscosity items. The general trend should have been that with a higher viscosity, a higher yield would be achieved. However, it was noted that this did not hold true for the peanut butter. This was likely due to the fact that a plastic spoon was used for the testing procedure. Unlike a human, the robot cannot actuate the force it applies onto the food when dealing with high viscosity foods. Thus, the constant force that was applied with the plastic spoon was insufficient for an ideal scoop. With the use of a metallic spoon, the yield for peanut butter would have been significantly higher.
Discussion
The functional analysis of the results collected during the testing of the assistive feeding robot using the three modes of food acquisition: stabbing, scooping, and grabbing was conducted by calculating the resultant error and rate of success for each mode.
Comparing the resultant delivery error with the maximum neck displacement
Figure 11 plots the resultant error for each delivery trial and compares it with the maximum head movement threshold, which was stated to be 117 mm. 23 Table 3 shows that the system was able to achieve a success rate of 82.8% for the delivery trials. This means that for five out of six trials, the system could bring the food to a distance where the user only needs to extend their neck forward to be able to eat. Additionally, in all of the trials, the system never overshot the delivery position; all the errors existed in the form of undershooting. This is beneficial as there was no risk of the system colliding with the face of the user, thus assuring their safety.

Delivery error for all of the trials compared to the maximum neck displacement.
The success rate that the system achieved for the delivery trials.

Comparing the error associated with seating positions of different heights
Table 4 shows the mean average Cartesian and resultant error for each acquisition mode across all five height positions, while Table 5 shows the respective standard deviation. In the X and Y directions, the deviation in the average error is relatively low compared to the Z direction. This was likely based on the physical setup of the face camera, where varying the X or Y positions of the user still allowed for the camera to have a relatively direct line of sight. However, varying the Z position was equivalent to adjusting the height of the user. This gradually resulted in the camera having an angled line of sight leading to a less accurate localization.
Average Cartesian and resultant error across all five height positions.

Average Cartesian and resultant error standard deviation across all five height positions.

From this, it can be concluded that adjusting the height of the user has a significantly greater impact on the localization capabilities of the system in the Z direction than it does on the X or Y directions. Table 5 provides further evidence for this as it can be seen that the standard deviation in the Z direction is significantly higher than in the other directions.
Delivery error across various sitting positions
Figure 12 showcases how the resultant error of the delivery trials changed as the X position of the mannequin was varied. It was noted that along the X-axis between the range of 230 mm and 410 mm, the average error between the four positions was relatively close to each other as there was a standard deviation of 8.9 mm. This means that the resultant error was not significantly affected by where the user chose to sit within this range. The different levels of error seen within this range can be attributed to variations during the trials regarding the Z positions and the height of the user. Past an X position of 230 mm, the resultant error started to become significantly more sporadic to a point at which no significant correlations were found. From this, it can be concluded that the ideal sitting position for feeding is within an X position of 230–410 mm from the robot. This area is marked in Figure 13.

Comparing the resultant error with the variations in the X position.

Marking the ideal range for where the user should sit.
Safety response time
Table 6 shows the average response time and the standard deviation for the safety system to activate once a user enters the workspace of the robot. The average response time for the three system states did not vary significantly. Thus, the safety system was not affected by the operation of the primary system. Additionally, the standard deviation was relatively low, which means that the safety functions have a consistent performance. Overall, the response time was fast, which will ultimately help ensure the safety of the user. The response time was calculated by intentionally placing the mannequin within the workspace of the robot and starting a timer. The timer was then stopped as soon as the robotic system detected the mannequin inside the workspace. This time was recorded as the safety response time. This procedure was done for the three states of the system: idle, in-motion, and during the object detection process.
Safety response time across different states of operation.

Limitations and future research
The current research addressed some challenges facing assistive robotic feeding devices. However, it has several limitations that can be addressed in future research to further enhance the assistive robotic feeding technology. These limitations include a lack of different feeding and acquisition tools, such as chopsticks and knives, which would add additional capabilities to deal with more types of foods. The current system and others reported in the literature are each designed to work with a specific type of robot. Therefore, it may be beneficial if a system is developed that can be adapted to any commercially available robotic manipulator to convert it into an assistive feeding robot. More research should be conducted focusing on the current communication process between the assistive feeding robot and the user, such as the use of a joystick and a graphics push button. The robotic feeding system should provide an alternative method of communication, including voice controls and text-to-speech. This would increase accessibility to and accommodate a range of users with upper limb impairments.
Conclusion
This article outlined a novel approach for developing and validating an assistive feeding robot. The primary motivation behind this project was to design a device that could aid those who are suffering from an upper limb impairment and cannot adequately feed themselves. Upon studying the literature, a gap was discovered within the available solutions. This project therefore strived to fill some of the challenges facing the development of assistive feeding robotic devices. The proposed system was comprised of off-the-shelf components and leveraged novel computer vision ideas. The software framework was designed and operated in three phases: the identification, acquisition, and delivery of food items. As well, there was a concurrent safety system running in the background. A simplistic GUI was provided to the user for seamless interaction with the system.
In terms of validation, comprehensive tests were conducted to assess the system’s primary functionality. For identification, the chosen object detection model had an mAP of 93%. For the modes of acquisition, which included a fork, spoon, and gripper, success rates of 83%, 100%, and 75% were achieved, respectively. In terms of delivery, the system had an overall success rate of 82.8%. Lastly, the system had a consistent safety response time of approximately 1s. Overall, the results are favorable as the primary functionality showcased a high degree of performance.
Footnotes
Declaration of conflicting interests
The author(s) declared no potential conflicts of interest with respect to the research, authorship, and/or publication of this article.
Funding
The author(s) disclosed receipt of the following financial support for the research, authorship, and/or publication of this article: The work was financially supported by the Natural Sciences and Engineering Research Council of Canada (NSERC) Discovery Grant.