
Abstract
As the main supporting component of the truss robot, the thermal deformation of the beam often has a great influence on the overall thermal error of the truss robot due to its large span. In order to improve the thermal error prediction accuracy of long-span truss robot, a thermal error prediction method based on multiple linear regression and long short-term memory network is proposed based on mechanism and data drive. Firstly, the multiple linear regression model is used to predict the thermal error, and the prediction error data processing. Secondly, the long short-term memory network is established. In order to improve the performance of the long short-term memory network more effectively, an improved particle swarm optimization algorithm is proposed to optimize the hyper-parameters of the long short-term memory network. Finally, the improved particle swarm optimization–long short-term memory network is used to correct the prediction error of the multiple linear regression model. The experimental results show that the combined thermal error prediction model based on multiple linear regression and improved particle swarm optimization–long short-term memory algorithm has higher prediction accuracy than multiple linear regression model and long short-term memory network. The method has stable prediction accuracy and can provide a basis for thermal error compensation.
Introduction
With the development of robot industry, the accuracy of robots has gradually become a research hotspot of various robots. 1 –3 Thermal error accounts for about 40–70% of total error in high-speed precision machining. 4,5 As the main supporting and connecting parts of the truss robot, the thermal error of the beam directly affects the machining accuracy of the truss robot. Therefore, it is very important to explore the method to reduce the thermal error of the beam for the improvement of the machining accuracy of the truss robot.
Liang et al. 6 proposed the method of using resin concrete instead of traditional cast iron as the machine tool bed, and through the finite element analysis of the two materials bed, it was proved that the resin-mixed territorial material can effectively reduce the thermal deformation. Sun et al. 7 optimized the structure of the machine tool and changed the heat transfer distribution by setting gaps in the contact area of two adjacent parts, so as to reduce the thermal displacement of the spindle center of the machine tool. Grama et al. 8 improved the cooling method of the main shaft, and adopted the model-based control strategy on the traditional pool recycling cooling device, which significantly improved the cooling efficiency and reduced the thermal error. The above thermal error control method reduces the thermal error to a certain extent, but such optimization of machine tool structure or cooling method thermal error control method is easy to lead to economic cost intensive in the actual processing process.
Thermal error compensation uses the temperature field and the corresponding thermal error data to construct the thermal error prediction model, so as to realize the thermal error compensation of the mechanism. This method can effectively improve the production accuracy, improve product performance and competitiveness. Lu et al. 9 and Yang and Fan 10 established a mathematical model between thermal deformation and temperature rise by the method of multiple linear regression, and predicted the thermal error. However, the thermal error model established by multiple linear regression method cannot meet the demand of real-time online compensation either in terms of prediction accuracy or robustness. Hu et al. 11 established the thermal error model of articulated coordinate measuring machine using back propagation (BP) neural network. However, since BP neural network is easy to fall into local optimum, the thermal error prediction model established by BP neural network has poor prediction accuracy and robustness. Tan et al. 12,13 established a thermal error prediction model using least squares support vector machine (LSSVM), which improved the prediction accuracy to some extent compared with traditional methods such as BP neural network. But this method is difficult to deal with strong nonlinear thermal error data.
Thermal error data are a dynamic time series, 14 the thermal error changes with the historical temperature value and other factors. The thermal error at each moment is closely related to the thermal error at the current moment and the historical thermal error. Long short-term memory (LSTM) neural network has strong learning ability, while the memory of historical information is also strong. Therefore, its powerful time series prediction ability has been widely used in various fields. Kumar et al. 15 used bee colony algorithm (ABC) to optimize LSTM neural network to establish a stock prediction model, and the performance analysis verified that it had higher prediction accuracy than the traditional similar models. Tian et al. 16 proposed an error-LSTM based on LSTM neural network that can adjust the accuracy and efficiency of the model according to the prediction error, and its accuracy and efficiency are excellent in the prediction of compressor vibration signal. Xie et al. 17 used LSTM neural network to predict water levels in the Yangtze River. Mou and Yu 18 established a CNN-LSTM model with LSTM using convolutional neural network (CNN), which realized the convenient monitoring of blood pressure in daily life. LSTM neural network has shown its excellent prediction effect in various fields, but the research on thermal error modeling using LSTM neural network is still rare.
Based on mechanism and data-driven, this article proposes a joint thermal error prediction model based on multiple linear regression and improved PSO-LSTM algorithm, which has better and more stable prediction accuracy than traditional models, and provides a basis for subsequent thermal error compensation. In addition, the contribution of this article is to verify the instability of the prediction accuracy of the most widely used multiple linear regression model in thermal error modeling and to propose an improved PSO algorithm with better search performance based on traditional PSO. The multiple linear regression model cannot process the thermal error data with strong nonlinearity, and the accuracy of the thermal error prediction model established by it is often unsatisfactory. Therefore, this article uses the improved PSO-LSTM to correct its error. The experimental results show that the prediction performance of the joint model is better than the traditional similar models.
The rest of this article is organized as follows. In the second section, the instability of the prediction accuracy of the thermal error prediction model established by multiple linear regression is verified by establishing a theoretical model and using the finite element method. The third section introduces the related theories and modeling methods of the joint model proposed in this article and establishes a joint thermal error prediction model based on multiple linear regression and improved PSO-LSTM algorithm. In the fourth section, experiments are carried out to verify the performance of the improved PSO algorithm and the joint thermal error prediction model proposed in this article. In the fifth section, the conclusion is summarized.
Heat transfer analysis of truss robot beam structure
Calculation of beam convection coefficient
The truss robot is mainly composed of column, X beam, Y beam, and manipulator. The X beam is connected to the column, and the main structure is shown in Figure 1. The manipulator can slide in X-direction and Y-direction through the sliding rail of each beam. At the same time, there is a movable Y-direction beam, which can slide along the X-direction track through the drive device composed of the motor, reducer, and rack. This section intends to use the multiple linear regression method to calculate the overall thermal deformation elongation of the beam, so it is necessary to calculate the thermal deformation elongation of each component of the beam, and the beam structure is shown in Figure 2. Thermal convection caused by ambient temperature is the main factor affecting the thermal deformation error of truss robot, 19 and it is also the most convenient temperature for detection. In order to facilitate the analysis, it is assumed that only the influence of environmental temperature change is considered, and the natural convection with air is assumed to exist in the working environment of the truss robot. Therefore, the convective heat transfer coefficient between the beam structure and the air is required.

Main structure of truss robot. (1) Columns; (2) X-direction beam; (3) mechanical arm, and (4) Y-direction beam.

Crossbeam structure diagram. (1) Channel steel; (2) rail bed; (3) rail optical axis.
The Grashof number is20:
After obtaining the Grashof number of each component of the beam, the Nusselt number can be calculated according to the formula20:
Values of constants c and n.

According to the Nusselt criterion
20
:
Establishment of beam simulation model
The thermal error of the beam was analyzed by numerical analysis software. The ambient temperature was selected as the only heat source, and the initial ambient temperature was set to be 16°C. The heat transfer between the components is through contact without considering the heat diffusion. Considering only the natural convection with air, the convective heat transfer coefficients of groove steel, track base, and track optical axis are 5.83 W/m·°C, 3.95 W/m·°C, and 3.67 W/m·°C, respectively.
In the analysis process, the thermal deformation of the beam in all directions during the ambient temperature rising from 16°C to 36°C is simulated. Under the influence of gravity, temperature, coupling, and other factors, the thermal deformation of the beam is the largest when the ambient temperature reaches 36°C, as shown in Figure 3. According to the numerical simulation software, the maximum thermal deformation of the beam in all directions is calculated in the process of increasing the ambient temperature from 16°C to 36°C, as shown in Figure 4.
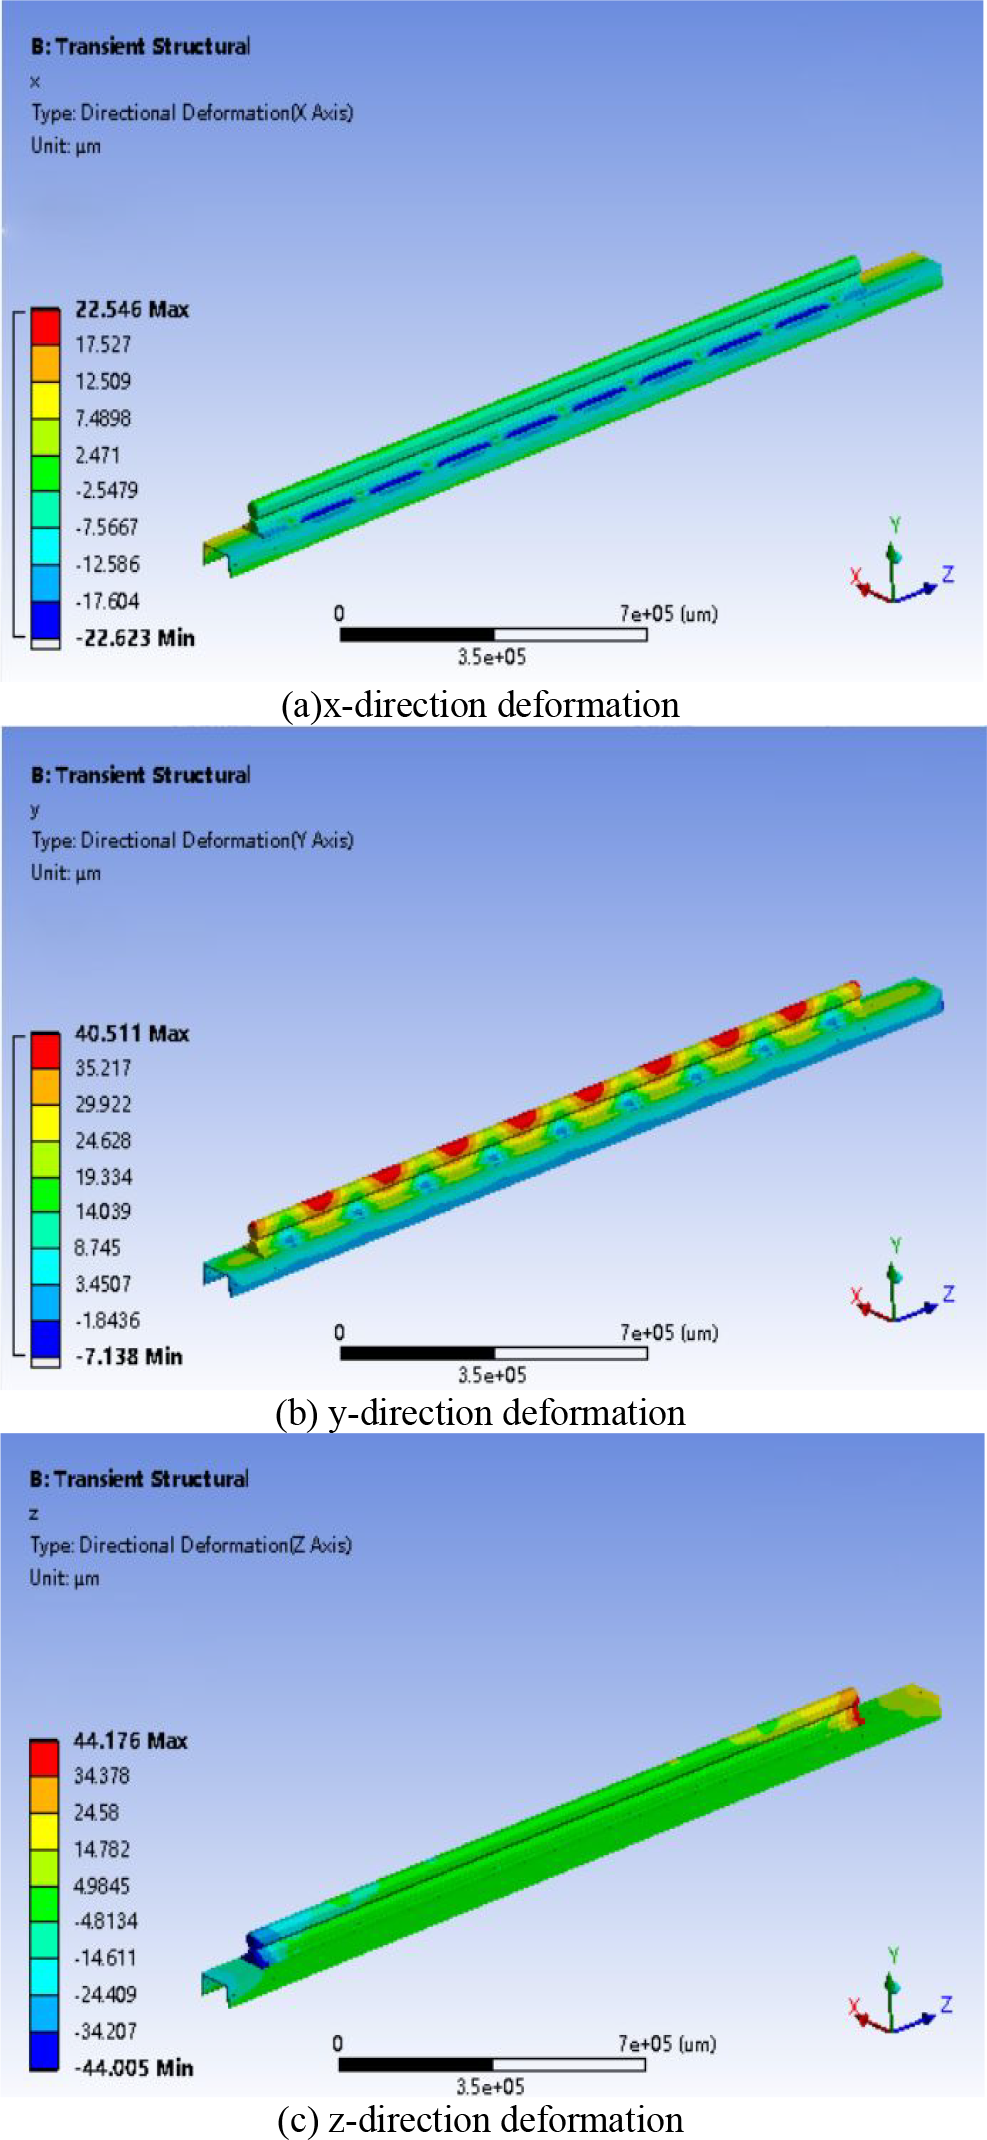
Thermal deformation of beams in all directions. (a) x-direction deformation, (b) y-direction deformation, (c) z-direction deformation.
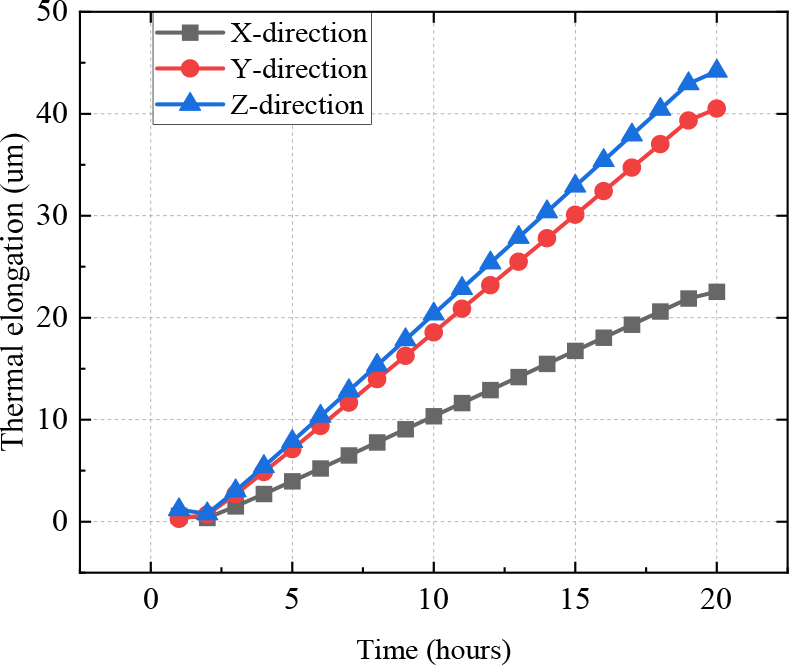
Calculation of thermal elongation in different directions by numerical analysis software.
Calculation of thermal elongation of beams
Taking the z-direction of channel steel in the beam structure as an example, the heat conduction differential equation of the beam is 20

In formula (1): k is thermal conductivity; ρ is density; c is specific heat capacity.
The initial condition is

The boundary conditions are


In formulas (2) to (4),
The temperature field variation formula can be obtained by analytical method

In formula (5): bn and λn are undetermined coefficients determined by initial and boundary conditions.
The thermoelastic elongation at each moment of each component of the beam can be calculated according to the transformation of temperature field

In formula (6): α is the thermal expansion coefficient of the beam material.
Similarly, the thermal elongation in each direction of each component of the beam can be obtained.
The mathematical model between each component of the beam and the whole beam is established by multiple linear regression

In formula (7): a 0, a 1, a 2, a 3 are constants; e 1, e 2, e 3 are the thermal elongation of groove steel, track base, and track optical axis, respectively.
Taking the total error of truss robot beam structure calculated by numerical analysis software as the objective function, and using the least square estimation method, the thermal elongation ex in the x-direction of the beam can be obtained.

Similarly, the thermal elongation ey and ez in the y-direction and z-direction of the beam can be obtained


In summary, the variation curve of thermal elongation within 20 h is shown in Figure 5.

Calculation of thermal elongation of beams by linear regression.
By observing Figures 4 and 5, it can be seen that there is a significant deviation between the predicted thermal elongation in each direction of the beam by multiple linear regression and the calculated thermal elongation in each direction by simulation. Figure 6 is the residual variation curve of beam thermal elongation using multiple linear regression and simulation calculation. It can be seen from Figures 6 and 3 that the maximum error generated in the x-direction alone can reach 17.73% of the thermal elongation using the thermal error prediction model established by multiple linear regression. This is because traditional models such as multiple linear regression models are difficult to deal with thermal error data with strong nonlinearity. Thermal error has nonlinear long-term memory behavior for historical data, 21 while traditional models such as multivariate linear regression model cannot self-learn and update thermal error data with time series characteristics. 22 Therefore, the thermal error prediction model established by simple multivariate linear regression will produce a large number of errors in the prediction process.

Residual error of thermal elongation in all directions of beam.
In order to reduce the error generated in the prediction process of multiple linear regression model, this article proposes a joint model of multiple linear regression and improved PSO-LSTM. The improved PSO-LSTM algorithm is used to predict the deviation degree of the error generated by the multiple linear regression model, so as to improve the prediction accuracy of the multiple linear regression model.
Thermal error joint prediction model based on multiple linear regression and improved PSO-LSTM algorithm
The powerful prediction ability of LSTM network can predict the degree of error offset in the prediction process of multiple linear regression model, which can greatly improve the prediction accuracy of multiple linear regression model. However, when predicting the error value of the multivariate linear regression model, it is found that the error generated by the prediction thermal error of the multivariate linear regression model has positive and negative directions, while the error value of the multivariate linear regression model predicted by the LSTM network will have some positive and negative biased “abnormal values,” which will increase to a certain extent after adding to the prediction thermal error of the multivariate linear regression model. Therefore, only LSTM network is used to predict the “deviation degree” generated in the thermal error process by multiple linear regression model, and then the error direction is determined. The basic process is

In formula (11), predL is the thermal error prediction value of the multiple linear regression model; predE is the prediction value of the error deviation degree of the multiple linear regression model using LSTM network; predA is the overall prediction value of the model. The addition or subtraction is determined by the error direction.
LSTM neural network
As a variant of RNN, LSTM solves the problems of gradient disappearance and gradient explosion of traditional RNN. 23 At the same time, its unique memory unit can also deal with the thermal error data well which has a strong memory behavior for historical data. Each LSTM memory unit is similar to a cell, and the most important in LSTM memory unit is the cell state. The core of LSTM network is horizontal through the cell “conveyor belt” and three gated units, all information flow through the “conveyor belt” in each unit, and the gated unit is used to protect and control the cell state. The basic structure of LSTM network is shown in Figure 7.

LSTM neural network structure. LSTM: long short-term memory.
The first gate control unit of LSTM network is the forgetting gate, which is used to control the current unit memory or forgetting historical information. It can be expressed as

In formula (12), ft denotes the forgetting gate; Wf is the weight of the forgetting gate; σ is the Sigmoid activation function; ht-1 is the output of the previous moment t-1, Xt is the input of the current moment; bf is the bias.
The second gated unit is the input gate, which determines which current input information can be saved to the cell state. This process can be expressed as


where it
represents the input gate;
With the forgetting gate filtering information and cell state updating completed, the next step is to update the cell state, which can be expressed as

In formula (15), Ct
represents the cell state at the current moment, and
The last gate control unit is the output gate, whose function is symmetrical to the input gate, which determines what information to output. The process can be expressed as


In formulas (16) to (17), ot denotes the output gate; Wo and bo are the weight and offset of the output gate; ht is the output information for the current time.
Super-parameter search based on improved particle swarm optimization algorithm
There are many hyper-parameters involved in the LSTM network, such as learning rate, batch size, number of units, and so on. These parameters directly control the topology of the network model, and the performance of the model trained by different hyper-parameter combinations varies greatly. At present, the selection of hyper-parameters mostly depends on the experimenter’s repeated experiments, which is time-consuming and laborious. The idea of particle swarm optimization is derived from the foraging behavior of birds. In the particle swarm optimization algorithm, each of the optimization problems may be regarded as a particle, which seeks the global optimal particle by continuously tracking the positions of the individual optimal particle and the group optimal particle. Particle swarm optimization algorithm has the advantages of simple operation, insensitive to initial setting value, less parameters, and fast convergence. In this article, the particle swarm optimization algorithm is improved as the hyper-parameter optimization algorithm of LSTM network to optimize the hyper-parameters in LSTM network.
In the traditional particle swarm optimization algorithm, the updating process of individual optimal solution and group optimal solution in the kth iteration is


In the formula,
The particle velocity updating process is


where c 1 and c 2 are learning factors; rand () is a normal distribution function between [0, 1 ]; w is an inertia factor, usually between 0 and 1, the larger the value, the stronger the global search ability, and vice versa, the stronger the local search ability.
When the particle swarm algorithm initializes the population, the fitness of the particles is different. In the process of finding the optimal hyper-parameters, the smaller the fitness function (MAPE) value is, the closer the particle is to the optimal solution. In order to accelerate the convergence rate of particles and avoid local optimization, an improved multi-population particle swarm optimization algorithm is proposed in this article, which uses different speed updating methods for particles of different populations. After the initialization of the population is completed, all particles are sorted according to the value of fitness. Half of the small fitness value is divided into excellent populations, and others are divided into ordinary populations. The smaller the particle fitness value is, the closer the particle is to the optimal solution position, and vice versa. Therefore, the search accuracy of particles for excellent populations should be improved to avoid local optimum, and the speed update process is

For the particles of ordinary population, the search speed should be increased to accelerate the approach to the optimal solution. The speed update process is as follows

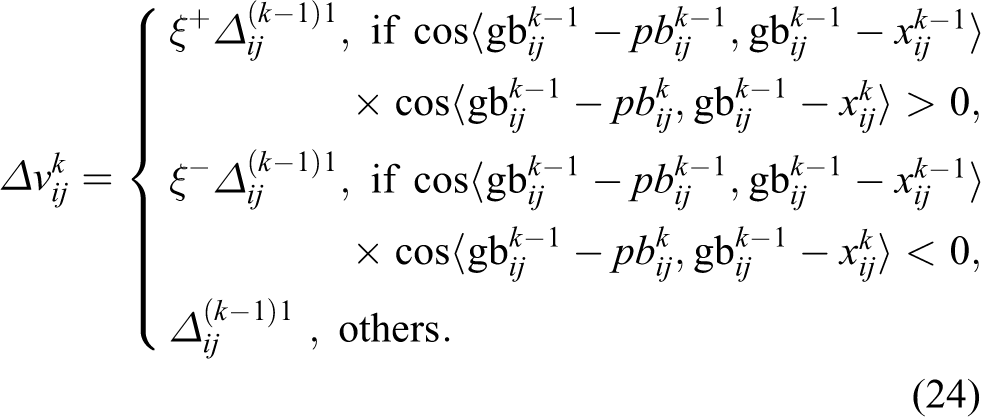
Cos represents the cosine of direction vector, and the direction vector is from the current position of the particle to the position vector of the global optimal value. In equation (23), when the product of two strings is greater than zero, it means that the particle is moving to the optimal solution position. At this point can increase
Thermal error prediction model based on multiple linear regression and improved PSO-LSTM
In the LSTM network, the learning rate has the greatest impact on the network performance. Therefore, this article uses the improved particle swarm optimization algorithm as the hyper-parameter optimization algorithm to search the optimal value of the learning rate, batch _ size and the number of neural network units of the LSTM network, and uses the ADAM optimizer to update the weights and biases of the network. Flow chart of multivariate linear regression and improved PSO-LSTM joint model is shown in Figure 8.

Improved PSO-LSTM flowchart. PSO-LSTM: particle swarm optimization–long short-term memory.
Model performance verification
Experiment setting
In this article, the Z-direction thermal elongation of each component of the truss robot beam structure and the ambient temperature are used as the input of multiple linear regression and improved PSO-LSTM algorithm model to predict the overall thermal elongation of the truss robot beam structure only under the influence of ambient temperature.
As shown in Figure 9, the experimental instrument is a dial indicator (accuracy ± 0.2 μm) and a thermometer (accuracy ± 0.1°C). In order to improve the test accuracy and reduce the interference of thermal variation characteristics of the experimental platform, nylon material with low coefficient of thermal expansion is selected as fixture for micrometer. The ambient temperature is used as the only heat source in the experiment. Because it is difficult to measure the groove steel and the column fixed, only the ambient temperature and the thermal elongation of the track optical axis and the freely arranged base are measured. Due to the existence of isotropic, the thermal elongation of the slider structure directly contacted with the truss robot beam structure is taken as the overall thermal elongation of the beam structure.
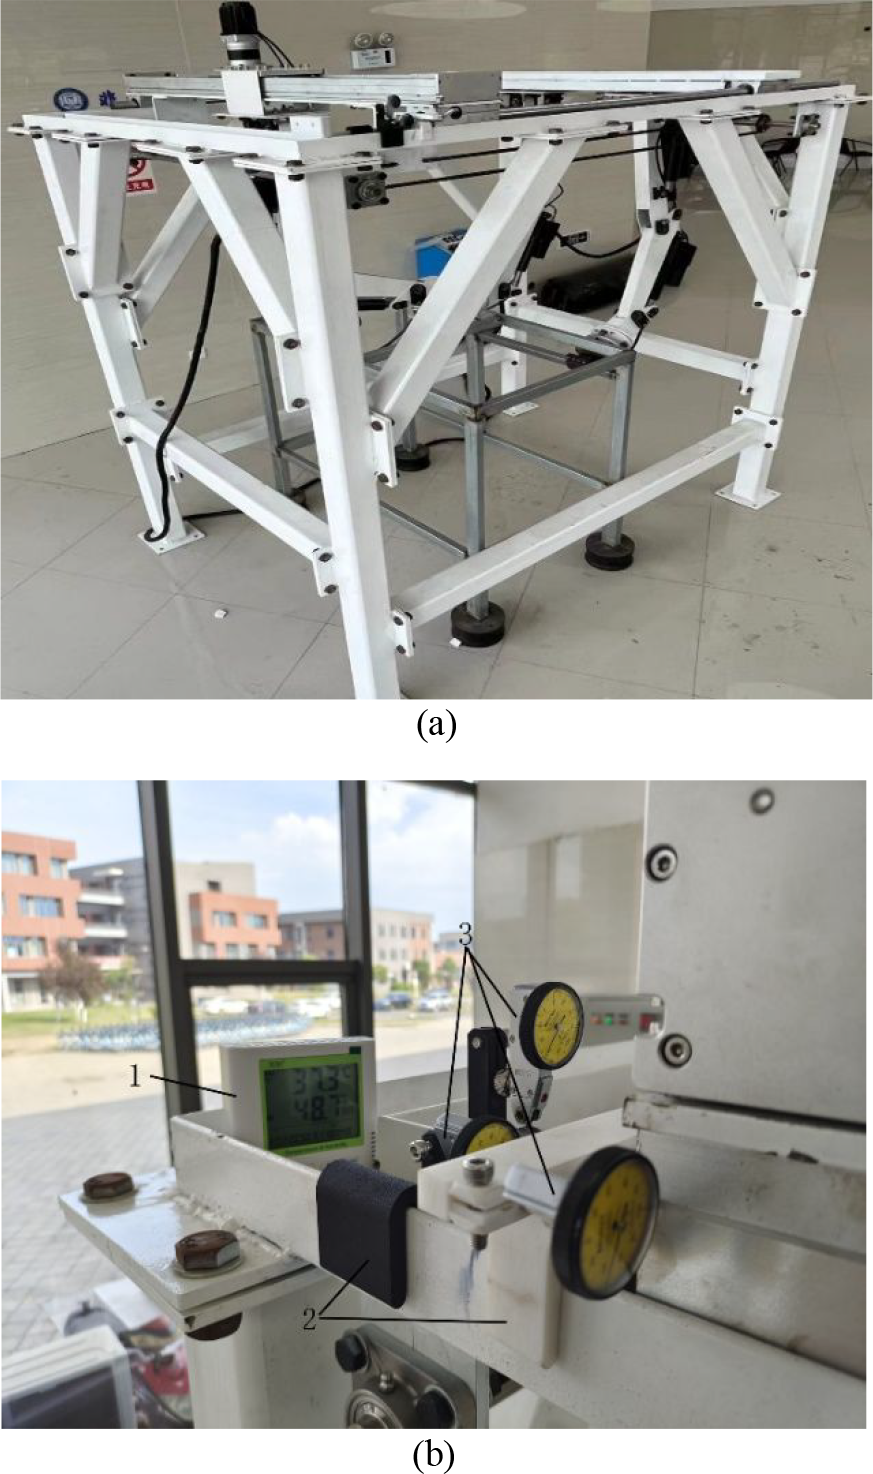
Experiment setting. (1) Thermometer; (2) fixture; (3) micrometer.
During the experiment, in order to observe the change of the readings of the dial gauge conveniently, the experiment process is summarized as the initial readings of the measuring micrometer of each component. Only under the influence of ambient temperature, the thermal deformation of the truss robot beam structure is slow. Therefore, the dial gauge readings are observed every hour and recorded every day for 12–13 h.
The accumulated error of truss robot beam structure within 26 days was observed, and 309 sets of data were measured. The variation curve is shown in Figure 10. The component 1 error represents the measurement error of track base, the component 2 error represents the measurement error of track optical axis, and the entirely error represents the measurement error of slider. Take 80% of them as the training set and the rest as the validation set.

Temperature and thermal elongation of components of truss robot beam structure in 26 days.
Performance analysis of improved PSO-LSTM
Firstly, the performance of the improved PSO algorithm is verified. The number of particles in the selected initial population is 20, the number of iterations is 100, and the average absolute error is used as the fitness function to search the optimal value of the learning rate, batch size and the number of neural network units of the LSTM network. The lower the fitness value, the better the performance. The search range of learning rate is 0.001–0.1; batch size search range is 50–150; the search range of the number of neural network units is 150–250.
The iterative process of PSO algorithm before and after improvement is shown in Figure 11.

Iterative process of particle swarm optimization.
The search results of traditional PSO algorithm show that the learning rate is 0.037. The batch size was 70, and the number of neural network units was 223. The search results of the improved PSO algorithm show that the learning rate is 0.013, the batch size is 82, and the number of neural network units is 184. It can be seen from Figure 11 that the fitness value of the traditional PSO algorithm reaches the minimum value of 3.72 when the number of iterations is about 60 times. The improved PSO algorithm reaches a minimum of 3.60 when the number of iterations reaches about 80 times, indicating that the improved particle swarm optimization algorithm solves the problem that the traditional particle swarm optimization algorithm is easy to fall into local optimum to a certain extent, and the hyper-parameter search performance is better than the traditional particle swarm optimization algorithm.
Next, the performance of the improved PSO-LSTM model is verified. Mean absolute error (MAE), root mean square error (RMSE) and mean square error (MSE) are used as the performance evaluation indexes of the model. The smaller the value, the better the performance of the model. The definitions are as follows:


In the formula, n is the number of samples;
In order to verify the effectiveness of the improved PSO-LSTM model proposed in this article, this section compares the improved PSO-LSTM model, PSO-LSTM model, LSTM model with artificial parameter adjustment and the prediction performance, and predicts the degree of deviation of the multiple linear regression model. The results are shown in Figure 12(a) to (c). It can be seen from the figure that the fitting performance of the LSTM model established with the hyper-parameters searched by the algorithm is significantly better than that of the LSTM model with manual adjustment. Therefore, in Figure 12(d), only the improved PSO-LSTM and PSO-LSTM offset degree prediction residuals with better prediction results are compared. It can be seen from the diagram that the residual error of the improved PSO-LSTM model is significantly lower than that of the PSO-LSTM model.

Performance verification of improved PSO algorithm. (a) LSTM offset prediction; (b) PSO-LSTM offset prediction; (c) improved PSO-LSTM offset prediction; and (d) residual comparison. PSO-LSTM: particle swarm optimization–long short-term memory.
Table 2 lists four evaluation criteria of the prediction ability of the three models for the measured thermal error: mean absolute error (MAE), root mean square error (RMSE), and mean square error (MSE). The three evaluation index data of the best performance model have been thickened in the table. The results show that the prediction error of the improved PSO-LSTM model is less than that of other models under the three evaluation criteria, indicating that the prediction performance of the improved PSO-LSTM network is better than that of the traditional model and the LSTM model of manual parameter adjustment.
Comparison of prediction performance for offset degree of each model.

MAE: mean absolute error; RMSE: root mean square error; MSE: mean square error; PSO-LSTM: particle swarm optimization–long short-term memory.
Performance verification of thermal error model
MAE, RMSE, and MSE are also used as the performance evaluation indexes of the thermal error prediction model. The improved PSO-LSTM is used to predict and correct the deviation degree of the multiple linear regression model. Figure 13(a) to (c) shows the variation curve of the predicted thermal error of each model. It can be seen from the figure that no matter what kind of LSTM model, its fitting performance with the measured value is better than that of the traditional multiple linear regression model. In terms of the fitting performance with the measured values, the improved PSO-LSTM modified multiple linear regression model has little advantage over the LSTM model. However, it can be seen from the residual curve of Figure 13(d) that the prediction accuracy of the improved PSO-LSTM modified multiple linear regression model is obviously more stable than that of the LSTM network, and the prediction error is basically within 1.5 μm, which is far better than the LSTM network.

Comparison of thermal error prediction performance of each model. (a) Multiple linear regression prediction results; (b) LSTM prediction results; (c) joint model prediction results; (d) comparison of LSTM and joint model residuals. LSTM: long short-term memory.
Table 3 lists four evaluation criteria for the prediction ability of the three models to the measured thermal error. The three evaluation index data of the best performance model have been thickened in the table. The results show that the improved PSO-LSTM modified multiple linear regression model corrects the average absolute error of 82.9%, the root mean square error of 58.6% and the mean square error of 62.8% of the multiple linear regression model. And the prediction error is less than the traditional multiple linear regression model and the LSTM model of manual parameter adjustment under three evaluation criteria. It is proved that the prediction performance of the improved PSO-LSTM modified multiple linear regression model is better than the traditional multiple linear regression model and the LSTM model of manual parameter adjustment.
Comparison of thermal error prediction performance of each model.

MAE: mean absolute error; RMSE: root mean square error; MSE: mean square error; PSO-LSTM: particle swarm optimization–long short-term memory.
Conclusion
In this article, a thermal error prediction method based on multiple linear regression and LSTM network is proposed. This method can accurately predict the thermal error of large-span truss robots and provide a basis for subsequent thermal error compensation. In addition, this article also proposes an improved PSO algorithm, which has better search performance than the traditional PSO algorithm. Based on the current work, we draw the following conclusions: This article proposes an improved PSO algorithm. It divides the population according to the fitness value of the initialized particle, and uses different speed update methods for different populations to perform hyper-parameter search, which can avoid premature convergence caused by local optimum. The experimental results show that the performance of LSTM network established by hyper-parameters of improved PSO search is better than that of PSO-LSTM network and LSTM network. This article proposes a thermal error prediction method based on multiple linear regression and LSTM network. In the thermal error prediction of truss robot beam structure in this article, the thermal error prediction model based on this method has higher prediction accuracy than LSTM network and multiple linear regression model. The prediction error is basically within 1.5 μm, which provides a basis for subsequent thermal error compensation work. The multiple linear regression and improved PSO-LSTM joint model proposed in this article based on mechanism and data-driven is superior to the traditional similar model in prediction accuracy, but the thermal error compensation effect has not been verified. The thermal error compensation experiment will be carried out based on the model, and the compensation effect will be verified in the next stage of research work.
Footnotes
Declaration of conflicting interests
The author(s) declared no potential conflicts of interest with respect to the research, authorship, and/or publication of this article.
Funding
The author(s) disclosed receipt of the following financial support for the research, authorship, and/or publication of this article: This work was supported by the Anhui University of Science and Technology Research Start-up Fund for High-level Talents Introduction (13200391) and the Key Project of Natural Science Research Project of Anhui Universities (grant no. KJ2020A0288&KJ2021A0418).