
Abstract
Autonomous vehicles have a fundamental part to play in future transportation. In order to work, such vehicles need a way of determining their exact location. To date, two techniques have proved applicable: geolocation using GPS and 3D mapping. In the latter case, the creation of the 3D map is an essential step in preparing the software. This manuscript presents a novel method for creating a high-definition 3D map using a Velodyne sensor. The primary objective is to achieve deeper understanding of the map creation algorithm and to lay the groundwork for future autonomous vehicle architecture. In this manuscript, two high-definition mapping algorithms are applied: the graph simultaneous localization and mapping algorithm and the normal distributions transform algorithm. The results of both displayed different strengths and weaknesses upon creating a high-definition 3D map, which may help other researchers to select the best algorithm in future.
Introduction
In recent years, the autonomous vehicle (AV) industry has advanced by leaps and bounds. The Society of Automotive Engineers 1 classifies AVs into six levels: from 0 (which means no automation) up to 5 (which means full automation and driverless operation). Most AVs on the global market today are level 2 or level 3, or semi-autonomous. Some could be as high as level 4, but these are only for R&D purposes, 2 –6 rather than for commercial or consumer use. Increasingly, the AV is becoming a focus for leading companies and researchers, and a comprehensive and interdisciplinary research effort. 6,7 According to Peng et al., 8 commercial automated cars should be available on the market within the next few years, as AV technology matures – for example, technology designed for perception, localization and mapping, trajectory planning, decision-making, and drive-by-wire. Therefore, a data map for navigation purposes needs to be ready for the market soon. 9
There are two main techniques for AV navigation: simultaneous localization and mapping (SLAM) and high-definition (HD) mapping. 10 With SLAM, perception and localization are conducted in real time, requiring powerful algorithms for a reliable result. Moreover, its performance depends heavily on sensor performance, which could impact the AV’s object detection. Therefore, SLAM-based techniques are more suitable for AV applications that involve navigating in an unknown environment. 11 By contrast, HD mapping methods provide a detailed map of the surrounding environment to assist the AV in its perception. With this approach, it is much simpler to identify objects, since their information is already available in the database. Therefore, less high-end sensors could be used for navigation purposes. 12 This method is suitable for applications in which the working environment of the AV does not frequently change (e.g. in inner-city areas or expressways). However, if there is any significant change in the surrounding environments, some unexpected issues could arise in the navigation performance. Currently, the main drawbacks of the approach are the availability of a map database, the large amount of memory required to store the map, the system’s computational load requirement, and latency in transmitting data for processing. 13
In the existing body of literature, there are two main methods for point-cloud matching during scanning to create 3D maps. The first is the iterative closest point (ICP) method. 14 This is an algorithm employed to reconstruct 3D surfaces from multiple scans, to localize the AV and achieve optimal trajectory planning by minimizing the difference between two point clouds and matching them as closely as possible. This is a well-known, robust, reliable, and simple method but requires a great deal of computational power and a significant run time in real-time applications. It is also rather sensitive to rotational movement during the data collection process. 7,15
The second approach, normal distributions transform (NDT), 16 transforms a reference point cloud into fixed 2D cells and converts them to a set of Gaussian probability distributions, before matching the scan data to the set of normal distributions. NDT makes matches faster than does ICP, since it does not require point-to-point registration. This algorithm is particularly suitable for trajectory planning or change and loop detection. However, it is sensitive to the accuracy of the initial estimate and uncertainty caused by moving objects. 9,17
HD mapping for AVs is not a new technology in the world, but in Vietnam, no HD map database or HD mapping companies yet exist. The application of 3D light detection and ranging (LIDAR) to construct point clouds is limited. There are only a handful of companies and groups that use photogrammetry to capture 3D point clouds, mainly for the purposes of geology and architecture conservation. In order to make AVs a reality in Vietnam in the near future, it is necessary to develop both an HD map database and tools to create HD maps. Therefore, in this manuscript, we apply two algorithms using scan matching to create HD 3D maps to see how they perform in Vietnam. This may offer other researchers a deeper understanding of the robustness of each algorithm and simplify the choice of algorithm for creating HD 3D maps in future.
Mathematical algorithms
NDT algorithm
Biber 16 introduced the NDT scan matching method, by using a point cloud and a uniform grid. In such a method, the initial large point cloud is divided into voxels (volume elements—cells). Each voxel stores points based on the mean and covariance (a Gaussian distribution type). That way, the discrete point clouds are transformed into successive continuous functions instead of analyzing large point clouds directly. The equations governing the NDT are shown below 16,18


where

The pose translational and rotational parameters to estimate are


where E(X, t) represents matched or well aligned voxels.
The literature offers various examples of successful applications of NDT. Stoyanov et al. 19 evaluated three commonly used variations of NDT in relation to their accuracy in representing a sampled semi-structured environment. Choe et al. 20 classified urban structure based on NDT grids for practical robots. However, the standard NDT algorithm exhibits a number of drawbacks, including poor convergence. To improve upon it, Takeuchi et al. 9 added dual resolutions to NDT to enhance the scan matching. Later, Das et al. 21 enhanced the convergence of NDT by implementing a segmented greedy cluster to generate Gaussian clusters for the algorithm. Finally, Hong and Lee 22 proposed a probabilistic-based NDT variation by employing the probabilities of point samples to represent the environment, where the point cloud is divided into high-resolution cells, which helps reduce pose estimation errors.
High-definition LIDAR algorithm
Koide et al. 23 developed high-definition LIDAR (HDL) graph SLAM with NDT scan matching-based odometry estimation and loop detection. It is worth noting that graph SLAM is one of the most widely implemented approaches to deal with SLAM problems. This technique constructs and optimizes a graph in which grid points exhibit landmark positions and sensor poses. Additionally, the edges of the grid represent relative poses between sensor poses and landmarks, which are commonly called constraints. By such a construction, the graph SLAM is optimized by minimizing the errors between the grid points and the constraints mentioned above. With the Velodyne point clouds, using filter and scan matching with floor detection, the HDL graph SLAM can create the map point. The main steps of the technique are described below (see also Figure 1):
–
–
–
–
–

HDL algorithm proposed by Koide et al.23
Data acquisition system and test area
Data acquisition system
For data logging, a low-cost system with only one 16-channel LIDAR sensor was used to collect point-cloud data. The LIDAR sensor has a measurement range up to 100 m with range accuracy of ±3 cm and a vertical field of view from +15° to −15°. The rotation rate can be adjusted from 5 to 20 Hz. ROS-based software was installed on a Nvidia TX2 embedded computer to collect the point-cloud data from the sensor to a ROSbag file. Both the sensor and computer were integrated into a portable backpack system (see Figure 2), which has its own battery and can run as a stand-alone logging system for up to 4 h. The LIDAR sensor was put on a monopod which can be held vertically by hand or mounted on the backpack top, while the embedded computer and battery were installed inside the backpack, which was referred to as the “3D scanning backpack.” The system can be remotely controlled by a tablet to start and stop the logging process. An engineer can carry out the logging by holding the sensor pod vertically and carrying the backpack while walking by himself or sitting on a running motorbike. Afterward, the data were processed by a high-performance desktop computer to recreate a 3D point-cloud map of the test area.

Diagram and photo of the 3D mapping backpack.
Test area and strategy
In this study, the test area was a triangular area measuring 0.01 km 2 , on the main campus of Phenikaa University, Vietnam. The 2D map of the campus is shown in Figure 3 including three points: A, B, and C. The test area includes a mixture of asphalt road with sidewalks, office buildings, and plants, which perfectly replicates a universal transportation infrastructure (see also Figure 4).
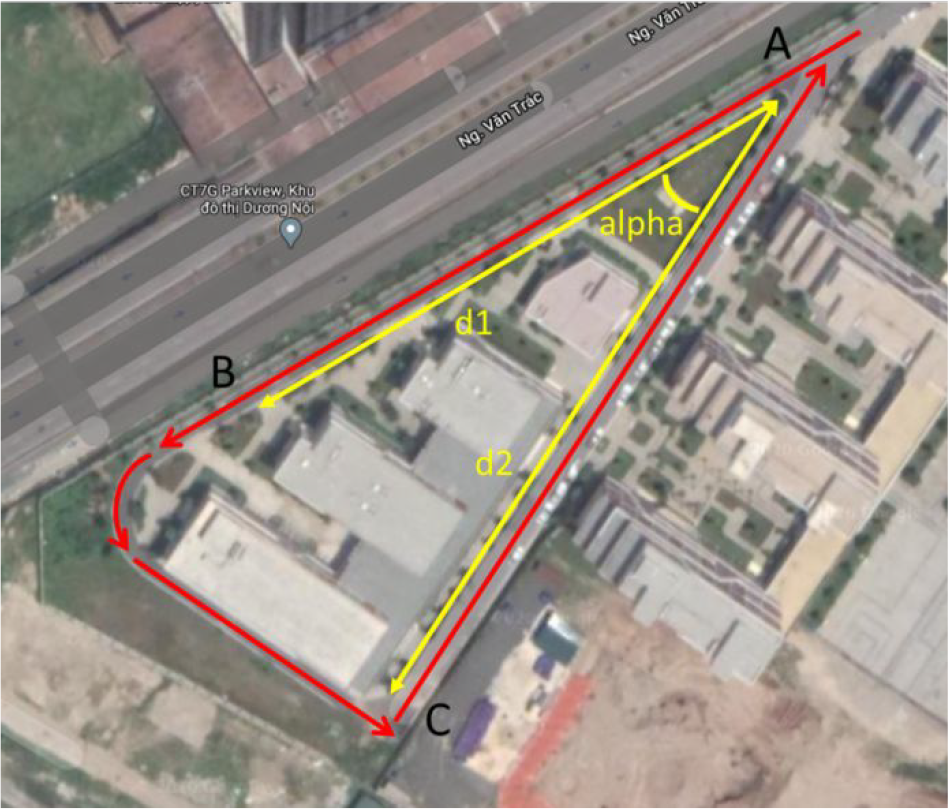
2D map of test area.

Landscape view of test area.
Three different testing strategies were planned to assess the two algorithms’ performance, as shown in Table 1. In the first strategy, a straight road from point A to B was scanned by the backpack from one side to the other, to test the generation of an open-loop 3D map by each method. In the second strategy, a closed-loop street in a counterclockwise direction of the campus from point A to B to C was completely scanned to test the ability of point-cloud loop-closing using only the LIDAR sensor data. In the third strategy, the closed loop was sampled in a clockwise direction for comparison purpose. The difference between the two closed-loop cases is how the first turn is made during the sampling period, which can be used to confirm the performance of two approaches without using inertial measurement units (IMUs). In strategy 2, a long straight road is sampled before making the first turn. However, in strategy 3, a turn is made much earlier, at the beginning of the test. In both cases, the ROSbag data of each test was processed by each method to create the 3D point cloud before comparison.
Testing strategies.

In this study, two distances on the street (d 1 and d 2) and one street corner (α) are considered, evaluating the performance of each 3D map generation method, as shown in Figure 3. The comparison was drawn between 2D maps generated by aerial imaging (5 cm/pixel resolution) and 3D maps made by HDL and NDT. The distance from the aerial image was measured by 2D map .tif file, while the distance in point-cloud files was determined by using Cloud Compare open-source software. α angles in both cases were measured by 2D images imported into ImageJ software.
Results
Open-loop result
The results for the first testing strategy are shown in Table 2. Using the same ROSbag, NDT was able to produce a cloud of 559,131 points, while HDL delivered a point cloud of 3,528,906 points (almost 6.3 times larger). Since there was no high-accuracy measurement of geographic coordination, there is only a comparison of relative distance between the aerial 2D photogrammetry data and the two point clouds. As shown in Table 2, the difference between a reference length measured from two point clouds and the 2D image is less than 2.14%, which equates to about 0.28 m in the case of NDT.
Result comparison in open loop test.

HDL: high-definition LIDAR; NDT: normal distributions transform.Closed-loop result
In the test of the second strategy on the counterclockwise course, both HDL and NDT showed good performance in 3D point-cloud generation. Comparing with aerial photogrammetry image of the area as shown in Table 3, both methods exhibit good accuracy, since the differences are less than 5% in both cases. The point-cloud density in the case of HDL is also higher than that of NDT—the total number of points in the case of HDL is about 4,909,133, as compared to 1,150,355 points in NDT.
Accuracy of 3D maps in closed-loop 1 test.

HDL: high-definition LIDAR; NDT: normal distributions transform.
In the third strategy test, when the first turn is made early on, the NDT approach shows its superior ability in point-cloud loop-closing without using IMU assistance (see Table 4). In contrast, HDL failed to close the loop and there were error points at the loop joint, making the point cloud unusable. NDT showed the same performance as with the earlier counterclockwise route. Therefore, the total number of points in this case was 19,710,844, which is considerably higher than the 10,676,991 points captured by HDL. Since HDL could not close the loop to make a correct point cloud, only the point cloud generated by NDT was considered to check the accuracy. In fact, NDT also displayed good accuracy, as the difference with the aerial data is less than 4%.
3D point clouds generated by the two methods.

HDL: high-definition LIDAR; NDT: normal distributions transform.
Accuracy of 3D maps in the closed-loop test.
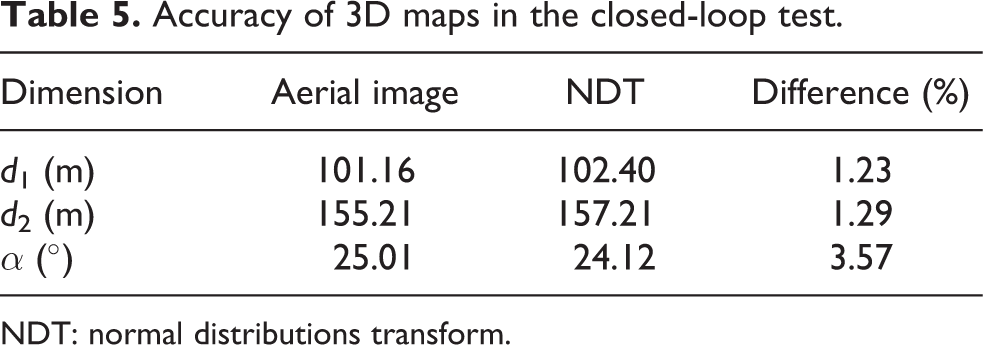
NDT: normal distributions transform.
Discussion
A complete HD map database is a crucial ingredient if AVs are to become a reality in Vietnam. Therefore, the first step in realizing this ambition is to develop a low-cost 3D mapping device. Firstly, the real-time decision-making capability of an AV, when driving and navigating, is increasingly dependent on the quality of the HD maps, in the nonstandard traffic infrastructure of Vietnam. For example, any driving scenarios such as stopping at the appropriate location, locating a traffic signal at the crossroads, or avoiding pedestrians who are not using a proper crosswalk, become very difficult for the AV to run without a proper HD map. Thus, as part of the decision-making process, mapping becomes a key factor in helping the AV make the correct decisions at the right time. Secondly, the portable personal mapping devices are especially suitable for Vietnamese traffic conditions, where most traffic is made up by motorbikes. An engineer wearing a mobile mapping backpack on a motorbike can reach many difficult locations in Vietnam.
The results of this study were compared to other works in the literature, as indicated in Table 6. Various test areas from different countries have been investigated, such as in Hong Kong, Taiwan, USA, and Vietnam. Wen et al. 24 tested sparse, suburban, and dense urban areas using an NDT-based graph SLAM technique. They found the mean lateral error to be 0.91 m, the mean longitudinal error 0.54 m, and the mean altitude error 0.15 m. However, it is worth noting that in that study, the accuracy of NDT-based graph SLAM depended heavily on the moving objects in the traffic such as double-decker buses, cars, and trucks. In a similar study in an urban environment, Chiang et al. 25 developed INS/GNSS/refreshed-SLAM for an urban area of Tainan city, Taiwan. The proposed method exhibited a performance including 0.137 m for the mean error in the northward direction and –0.794 m for the mean error in the eastward direction. In another work, Li et al. 26 combined NDT and graph SLAM to create an HD 3D map in underground coal mines. The relative errors for several measuring distances found by Li et al. 26 are –4.7% for 118 m, –24% for 200 m, and –29% for 70 m, respectively. In the present study, the relative errors for several measuring distances are 1.23% for 101.16 m and 1.29% for 155.21 m, respectively.
Comparison between different works for creating HD 3D maps.

SLAM: simultaneous localization and mapping; HDL: high-definition LIDAR; NDT: normal distributions transform.
The results in this study showed that by using only a low-cost personal mapping device with basic components, a functional data map could be generated with relative accuracy lower than 4% (Table 5) when compared with corresponding aerial data. The environment in the point cloud captured by the device is detailed enough to build up additional layers in the HD maps, such as a semantic map layer or geometric map layer. Based on these results, future studies will focus on an advanced portable mapping device for precise HD mapping with the support of ground control points measured by RTK GNSS and IMU sensors.
Conclusion and prospects
Two point-cloud map making approaches were tested in this study. Both methods only use LIDAR sensor data to generate the point cloud, without assistance from other sensors like IMU or GNSS. The result confirms that a small-scale HD point-cloud map can be produced by a low-cost mobile mapping system using only a LIDAR sensor. Combined with large-scale aerial point-cloud mapping data, a complete database of 3D maps can be compiled for navigation purposes for AVs. Furthermore, the results indicated that the NDT algorithm performs better than the HDL algorithm.
In further works, the uncertainty estimation of NDT-LIDAR graph SLAM should be investigated—for instance, uncertainty stemming from traffic conditions and 3D building models. Moreover, the accuracy of NDT-based graph SLAM should be evaluated as a function of traffic conditions including moving objects such as cars, pedestrians, and so on.
Footnotes
Abbreviations and notation
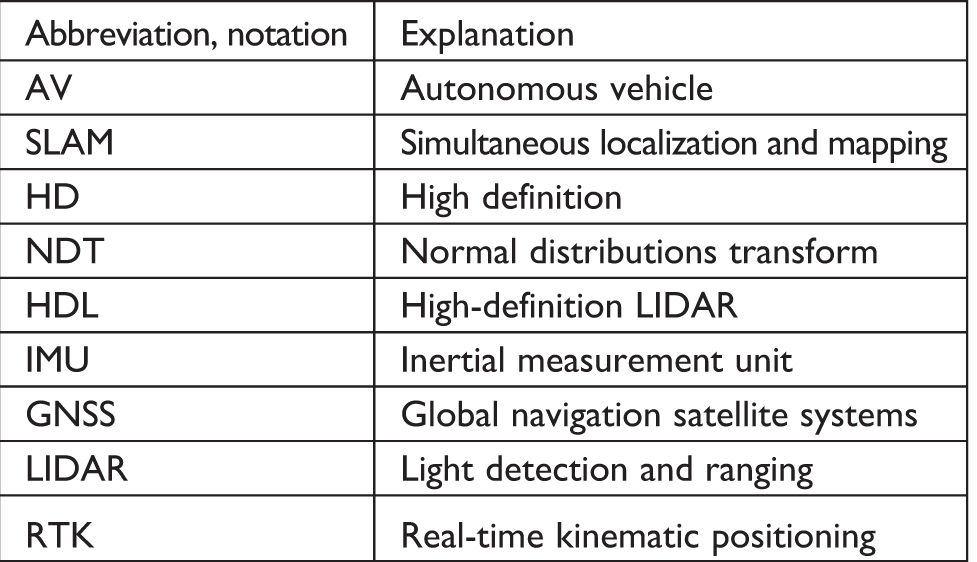
| Abbreviation, notation | Explanation |
| AV | Autonomous vehicle |
| SLAM | Simultaneous localization and mapping |
| HD | High definition |
| NDT | Normal distributions transform |
| HDL | High-definition LIDAR |
| IMU | Inertial measurement unit |
| GNSS | Global navigation satellite systems |
| LIDAR | Light detection and ranging |
| RTK | Real-time kinematic positioning |
Data availability statement
The raw/processed data required to reproduce these findings will be made available on request.
Declaration of conflicting interests
The author(s) declared no potential conflicts of interest with respect to the research, authorship, and/or publication of this article.
Declaration of conflicting interests
The author(s) received no financial support for the research, authorship, and/or publication of this article.