
Abstract
To improve the precision and reduce the movement uncertainty of the industrial robot, a novel hybrid optimization algorithm which combines adaptive genetic algorithm with simulated annealing algorithm is proposed in this article. First, for the sake of increasing the global exploring ability of relevant individuals, the adaptive crossover and mutation operator are used in the phase of adaptive genetic algorithm. If the population optimized by adaptive genetic algorithm is trapped in the local optimal area and simultaneously meets the transformation rule, then it is consequently optimized by simulated annealing to enhance the population diversity and hunt for a better solution so that the probability of finding the global optimal solution is greatly increased. Then, corresponding experiments based on single point repeatability are conducted to acquire data and identify the structural parameters of the industrial robot. Moreover, the single point repeatability test and length test are all implemented at the same time to verify the effectiveness of the proposed method. At last, the result reveals that the proposed method is effective to identify the real structural parameters of the industrial robot, thus enormously decreasing the single point repeatability and length deviation at the same time, which extremely increases the precision and decreases the movement uncertainty of the industrial robot.
Keywords
Introduction
With the rapid development of manufacturing and industrial applications, the industrial robot 1 is the universally used apparatuses in various fields, which makes a profound and critical impact in our production and life. For example, it is not strange to find that the industrial robot is widely used in the fields of measurement, assembly, detection, transportation, and so on. 2 Composed of a base, two arms, three pairs of rotational joints, a probe, and some other relevant components, 2 one kind of industrial robot illustrated in Figure 1 is a special instrument which makes it able to work expediently, move easily, and display data conveniently.
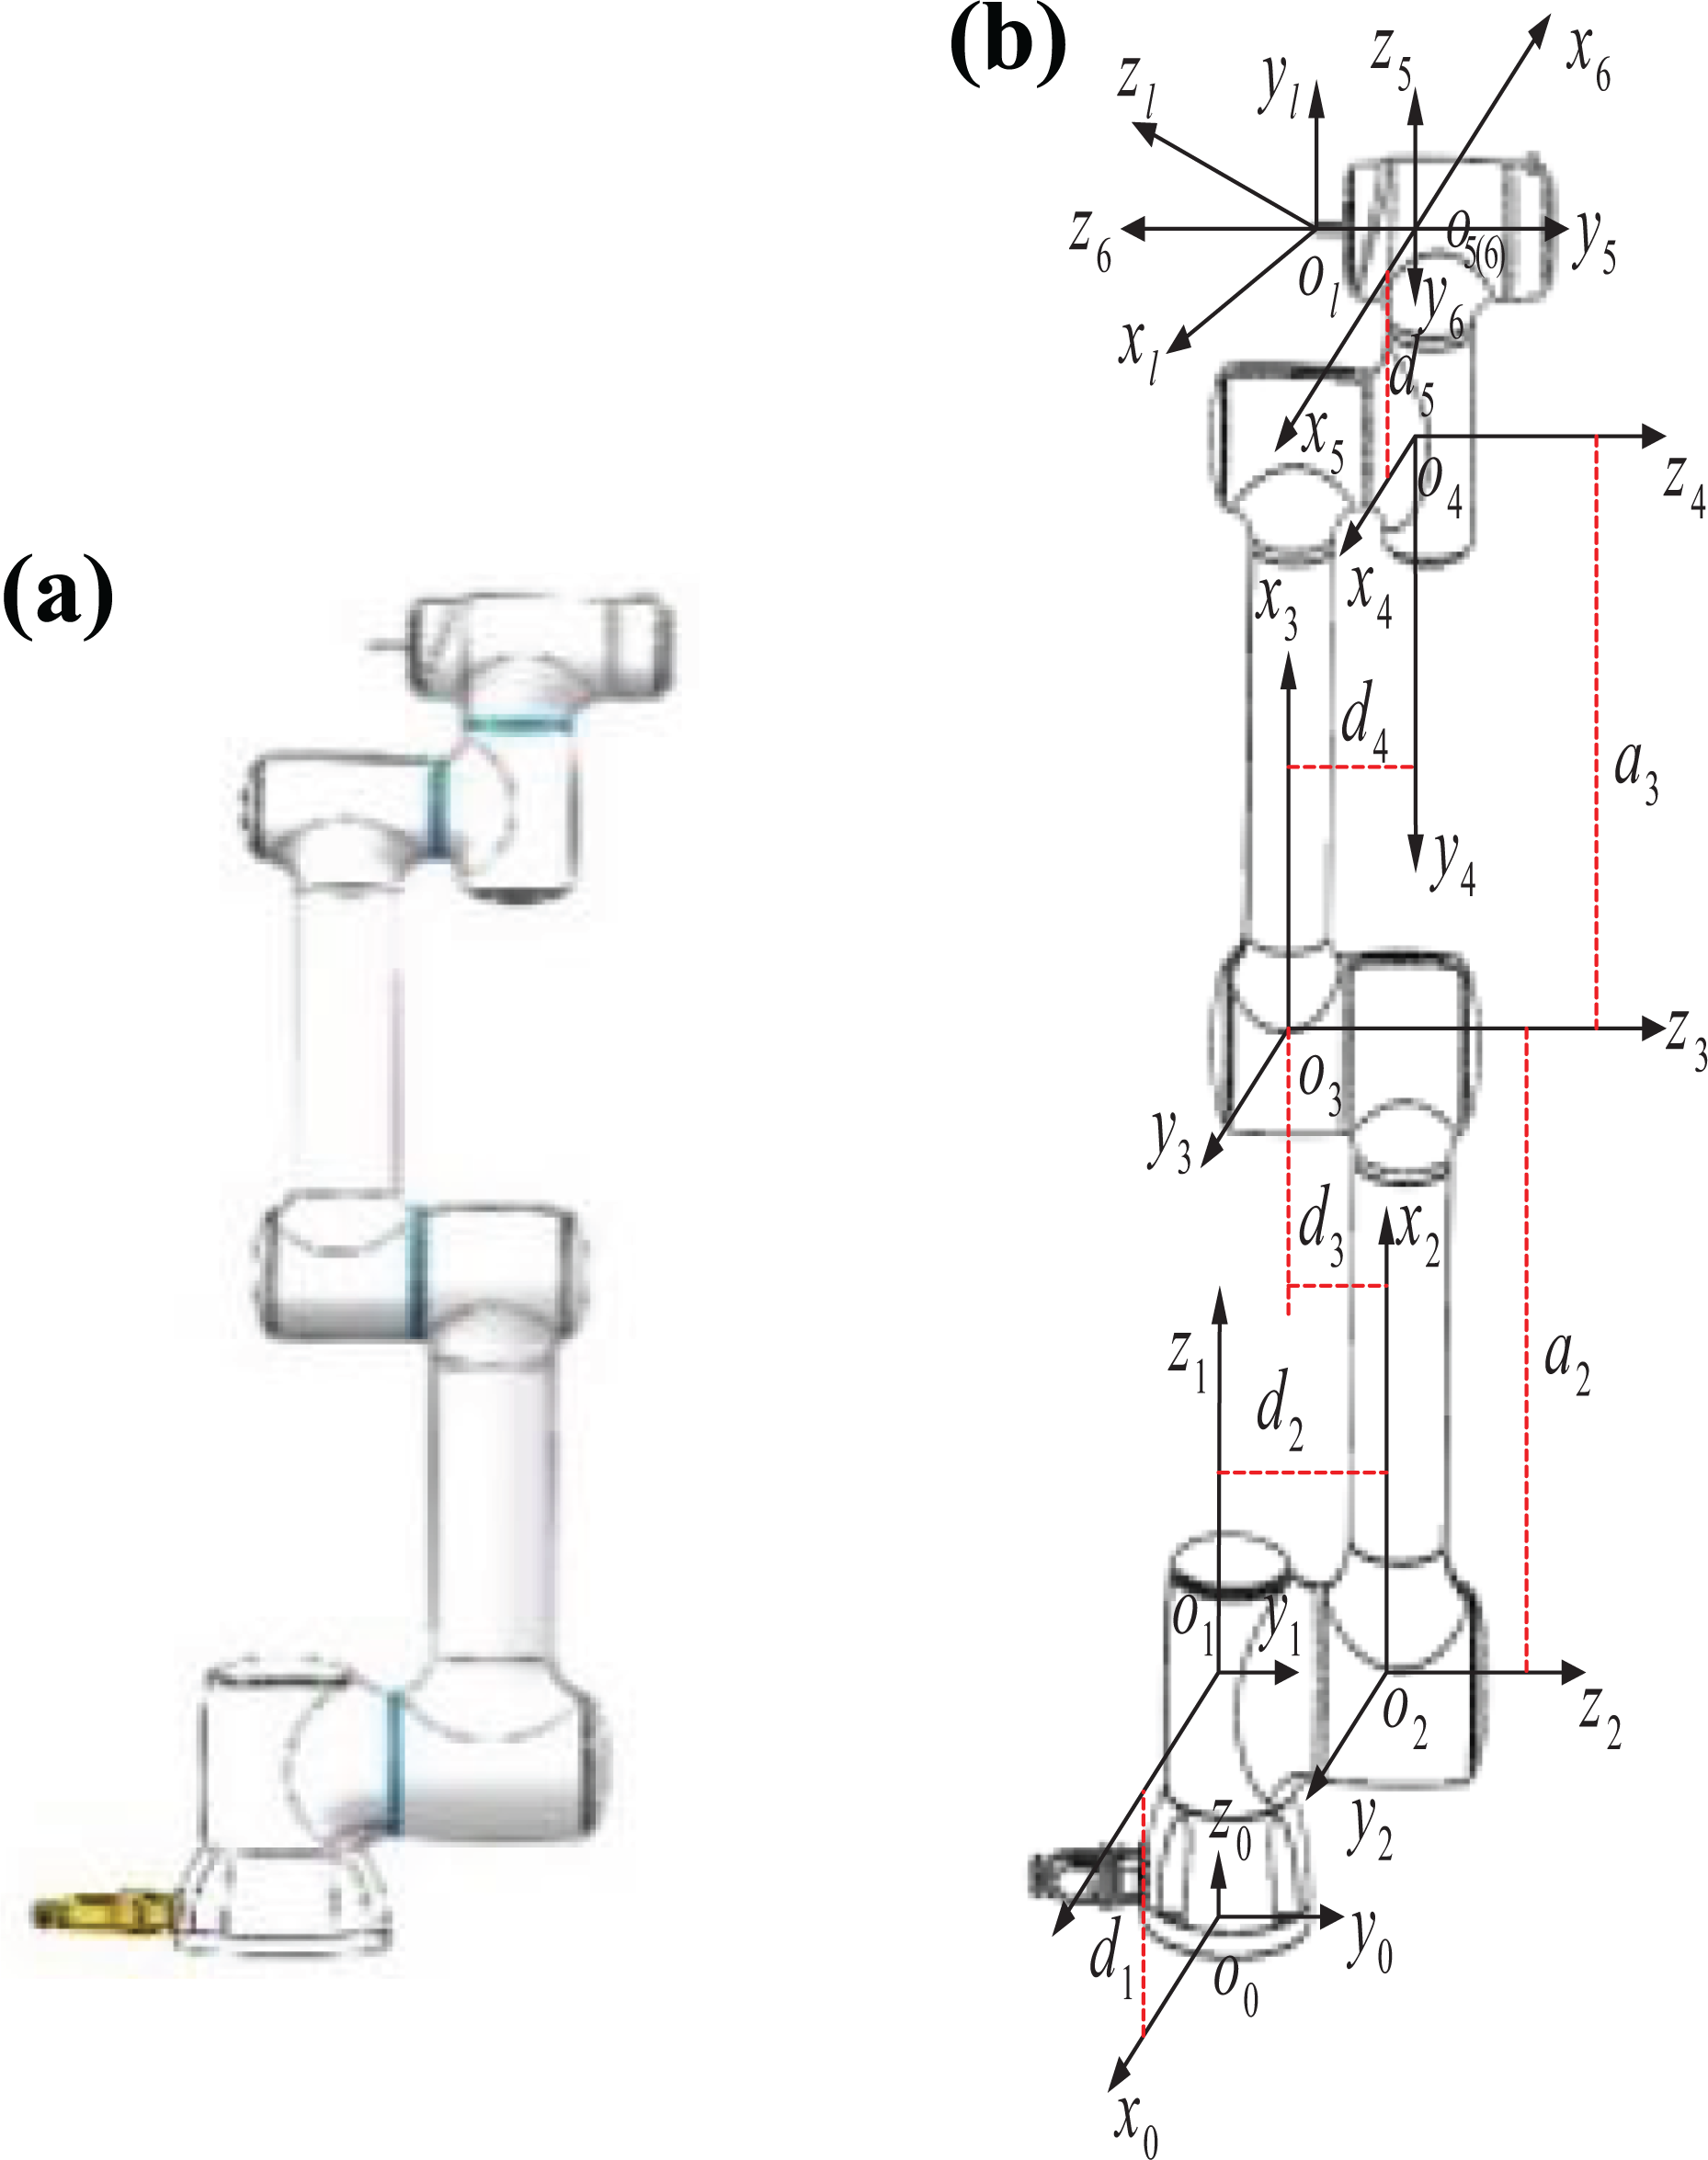
The (a) physical structure and (b) coordinate system of the industrial robot.
Although this kind of industrial robot has many merits, but the coordinate of the probe tip modifies in a large scale if the structural parameters change in a small scale resulting from the fact that the coordinate of the probe tip is obtained by a nonlinear transformation function from all the rotational angles of the joints to the probe tip. 2 Based on this fact and analysis, it is obviously deduced that the coordinate error of the probe tip is greatly and mainly impacted by the structural parameters of the industrial robot. 3 However, what should be noticed is that the real values of the structural parameters are not equal to the corresponding nominal ones in almost cases after the industrial robot has been utilized for a period of time as there exists the actual influential factors such as deviations of temperature and humidity, action of gravity, vibrations and interactions between various instruments, and so on. 3 –5 Hence, affirmation can be made that the real coordinate of the probe tip is not commonly equal to the one which is calculated using the nominal structural parameters. Therefore, it is extremely required for us to improve the accuracy of the industrial robot in various fields, to which a great number of researchers devoted much works and energies.
Nowadays, there are two main methods to improve the accuracy of the industrial robot. 6,7 The first one is to use higher precise components such as high precise coders, sensors, arms, and so on, which in turn dramatically increases the manufacturing cost of the industrial robot. The second one is to identify the structural parameters and compensate them again using a little auxiliary instruments or algorithms without any increased cost of components. 7,8
But, because of the nonlinear transformation function between the coordinate of the probe tip and the structural parameters used in the industrial robot, 2 –6 small deviations of the structural parameters may accumulate and lead to relative substantial coordinate errors of the probe tip. Thus, it is obvious that increasing only one or several components’ precision is not capable of effectively decreasing the whole measurement errors in a good degree. As a result, it is essential and necessary for us to execute another method, that is, identify the real structural parameters by other approaches. For example, Fang and Dang 9 proposed a kinematic parameters identification method using quantum-behaved particle swarm optimization, which is able to simultaneously identify the open-chain series mechanism and parallel mechanism. Santolaria et al. 10 identified the structural parameters of the industrial robot by utilizing four laser tracers to establish a geometric multilateration system and obtained data from laser tracks. Liu et al. 11 combined a geometric identification with the parameters identification to propose a new two-step calibration method. He et al. 12 used a laser tracker for spraying robot calibration, where the precision of the robot was improved by 60%. An elasto-geometrical calibration method was used by Kamali et al. 13 in 2016, in which the geometric parameter errors and joint stiffness parameters were identified at the same time by using a laser tracker.
However, although the methods mentioned above give us a lot of selections and approaches to calibrate and compensate the structural parameters of the industrial robot, but they nearly have the same characteristic that almost all the methods previously mentioned rely on higher precise apparatus especially laser trackers 14,15 which are extreme expensive and affected easily by the external environment, resulting in a relative high cost and nondeterminacy. Moreover, by using lots of precise instruments, the calibration and compensation procedures of the methods are complicated and difficult for us to operate sometimes, which is their defect and bottleneck. To solve this problem and simplify the calibration procedure, a new method is proposed in this article based on single point repeatability by using a hybrid optimization algorithm of adaptive genetic algorithm (AGA) 16 and simulated annealing (SA) 17,18 algorithm. Without using higher precise instruments or complex calibration procedures in the new proposed method, only a conical hole is fixed on a base, to which the probe tip is inserted and the arms of the industrial robot are rotated to a great number of different configurations to generate the acquired data set. Then the data set is utilized by the hybrid algorithm to get the optimized solution, that is, the optimal structural parameters of the industrial robot. And then, the identified parameters of the industrial robot are used to recalculate the single point repeatability and length deviation and some remarkable conclusions are presented at last.
To complete the calibration process, four steps are commonly carried out step by step 19,20 : modeling, measurement, identification, and compensation. Modeling is to formulate the transformation function between the coordinate of the probe tip and the structural parameters of the industrial robot. As was presented by Roth et al., 19 a perfect kinematic model of the robot requires three conditions: (1) completeness, (2) continuousness, and (3) minimality. In recent years, it is known to us all that there are a lot of mathematical models used to calibrate the structural parameters of the industrial robot such as Denavit–Hartenberg (DH) model, 21,22 POE model, 23 CPC model, 24 MDH model, 25 S model, 26 and so on. However, what should be noted is that the DH model and MDH model are most widely utilized in robotic area on account that they have clear physical meaning and thus used conveniently. Therefore, without loss of generality, the MDH model is adopted and used in this article to formulate the transformation function between the coordinate of the probe tip and the structural parameters of the industrial robot.
The main contributions of this article can be briefly summarized as follows: A new computation mechanism combining AGA with SA to formulate simulated annealing-based adaptive genetic algorithm (AGA-SA) is introduced in this article. Through this integration, the hybrid algorithm AGA-SA not only overcomes the weakness by SA that the AGA is easy to be trapped in the local optimal area but also strengthens the ability of local searching by AGA. That is to say, the AGA-SA is not only able to jump out of the local optimal area when it is trapped in it but also maintains strong local searching ability at the same time, which resulting in a higher probability of not only finding the preciser solution of the structural parameters but also increasing the precision and decreasing the movement uncertainty of the industrial robot. The kinematic equation is mathematically analyzed in detail and conclusions are derived that it is impossible for us to precisely measure the real coordinates of the probe tip of the industrial robot, which reveals that it consequently nearly impossible for us to directly calculate the real structural parameters by just acquiring the joint angles and coordinate of the industrial robot. Hence, the algorithm AGA-SA and method of single point repeatability are naturally introduced and integrated to optimize the structural parameters and acquire their real ones. Different from other methods, it is not necessary for us to set precise initial parameters of the structural parameters to be calibrated in the proposed calibration method, that is, the parameters are set arbitrarily as long as they are not too big or small, which simplifies the computation and specification process of the parameters.
The article is organized as follows. The second section formulates the mathematical model of the transformation function from the joint angles to the probe tip. The third section shows the relevant principles and analyses of the scheme. Then, the hybrid algorithm combing AGA and SA is introduced in the fourth section. Moreover, experiments including single point repeatability test and length deviation test are conducted in the fifth section. At last, remarkable conclusions are given in the sixth section.
Kinematic modeling and analysis
Kinematic modeling
The aim of kinematic modeling is to construct the mathematical relationship between the coordinate of the probe tip and the structural parameters of the industrial robot. According to MDH model, 25 the coordinate of the probe tip can be computed by equation

where
It should be noted that there is a deviation between the zero position of the coder and that of the joint, so the joint angle

where
The nominal structural parameters of the industrial robot.

Kinematic analysis
Set

The total differential with respect to every structural parameter of equation (3) is formulated by equation

If the structural parameters of the industrial robot change in an extreme small scale, then the differentials of the structural parameters and the coordinates of the probe tip are referred as equal to their corresponding deviations, that is

and

On the condition that the nominal structural parameters are given beforehand and 27 structural parameters need to be calibrated, if 9 groups of real coordinates of the probe tip and corresponding joint angles are obtained by some instruments, then there are 27 groups of equations derived by equations (4), (5), and (6), which can help to not only directly calculate the deviations of the structural parameters but also compensate the nominal structural parameters by these deviations in turn.
Principle and analysis
Analysis
Based on the analyses previously mentioned, the coordinates of the probe tip can be obtained and the structural parameters can be calibrated by equation (3). Specifically speaking, for a given X, equations can be formulated from equation (4) by using higher precise instruments to acquire N groups of different points

where
However, the fact that the general coordinates
Objective function
As mentioned above, after fixing the conical hole on the base, the probe tip is inserted to the conical hole still and the arms are rotated to N kinds of different configurations for obtaining N groups of different joint angles

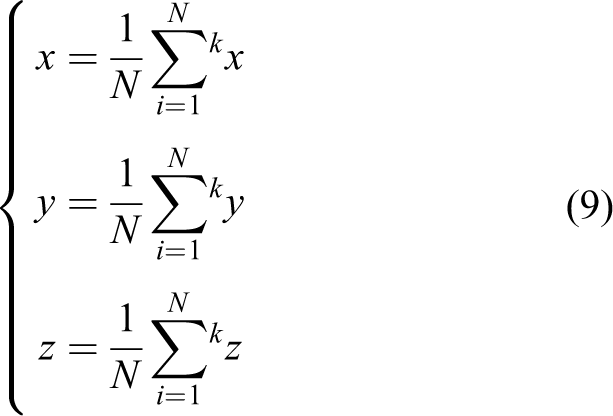
where x, y, and z are the real coordinates of the probe tip in direction of x, y, and z, respectively. Note that it is not easy for us to measure the real coordinate
After given

However, the average deviation

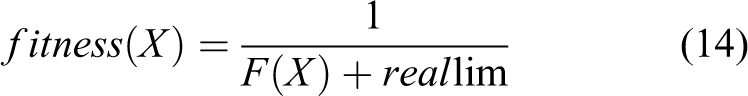
Consequently, the objective function for X based on “3 sigma principle” is

Let

Equation (12) is utilized as the objective function to search for the global optimal solution which is accepted as the real structural parameter of the industrial robot and compensates them in turn. Note that the closer X approaches to
Simulated annealing-based adaptive genetic algorithm
Adaptive genetic algorithm
Genetic algorithm (GA), 27 a natural bioinspired intelligent optimization algorithm simulating the biological mechanism of selection, crossover, and mutation, is a widely used evolutionary optimization method in various fields, which obeys the principle of “survival of the fitness” proposed by Charles Robert Darwin. In GA, the individuals’ survival abilities are indicated by their own fitness values, that is, the individuals with larger fitness values have better survival abilities and thus have larger probabilities of executing the genetic operation and giving birth to child. Note that the individuals with larger fitness values have better survival abilities while the aim of this problem in this article is to search for the best solution with the minimal objective value, hence the fitness function takes the form of
where
However, although GA has a good global searching ability, it can be trapped in a local optimal area with a certain probability especially when the optimized problem is extreme nonlinear such as the problem in this article. Therefore, the AGA 16 is used in this article to increase the probability of hunting for the global optimum. In AGA, the probability of crossover and mutation are all self-adaptive dynamically changing by taking the form of

and

where
For clarification, the details about AGA are specified as follows.
Selection. In selection phase, the individuals are selected by roulette wheel 28 .
Crossover. Let

and

where r is a constant given beforehand.
Ⅲ.Mutation. Mutation operation is executed successively as the following steps:
①Generate the mutation position
②Define variable
③Let
④Let

and

⑤At last, the value

where
SA algorithm and AGA-SA
SA
17,18
algorithm, which simulates the annealing process of the metal, has a good characteristic of escaping from the local optimal area when the best solution found so far is trapped in the local optimal region. Motivated by this trait, if the solution optimized by AGA is trapped in the local optimal region, then it is optimized by SA through a transformation rule to help the current best individual to escape from the local optimal region and wander widely in a broader space. Let t,
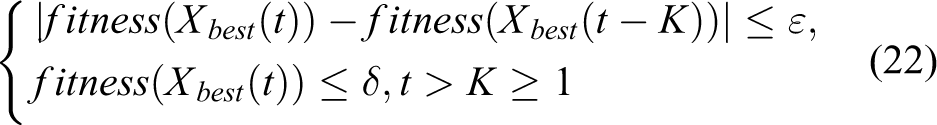
where K is a positive integer,


where t is the generation number, G is the maximal generation number,
The relative parameters are set as follows:
①Population number
②
To make comparison, the AGA, SA, and AGA-SA are respectively utilized as the algorithm to get the structural parameters of the industrial robot and their corresponding obtained optimized structural parameters are respectively implanted into the corresponding controller to replace the corresponding old ones. Moreover, the industrial robot with the old structural parameters and the corresponding new structural parameters is reused again to conduct the experiments of single point repeatability and length deviation test and the relevant outcomes are respectively presented thereafter. The flow chart of AGA, SA, and AGA-SA for calibrating the structural parameters of the industrial robot are shown in Figures 2, 3, and 4, respectively.

The flow chart of AGA. AGA: adaptive genetic algorithm.

The flow chart of SA. SA: simulated annealing.

The flow chart of AGA-SA. AGA-SA: simulated annealing-based adaptive genetic algorithm.
Experiments
Data acquisition
As is illustrated in Figure 5, after the conical hole and the base of the industrial robot are simultaneously fixed on the platform firstly, then the arms of the industrial robot are manipulated to make the probe tip inserted to the conical hole and fitted with it. Moreover, the arms are rotated again to N groups of different poses and the readings
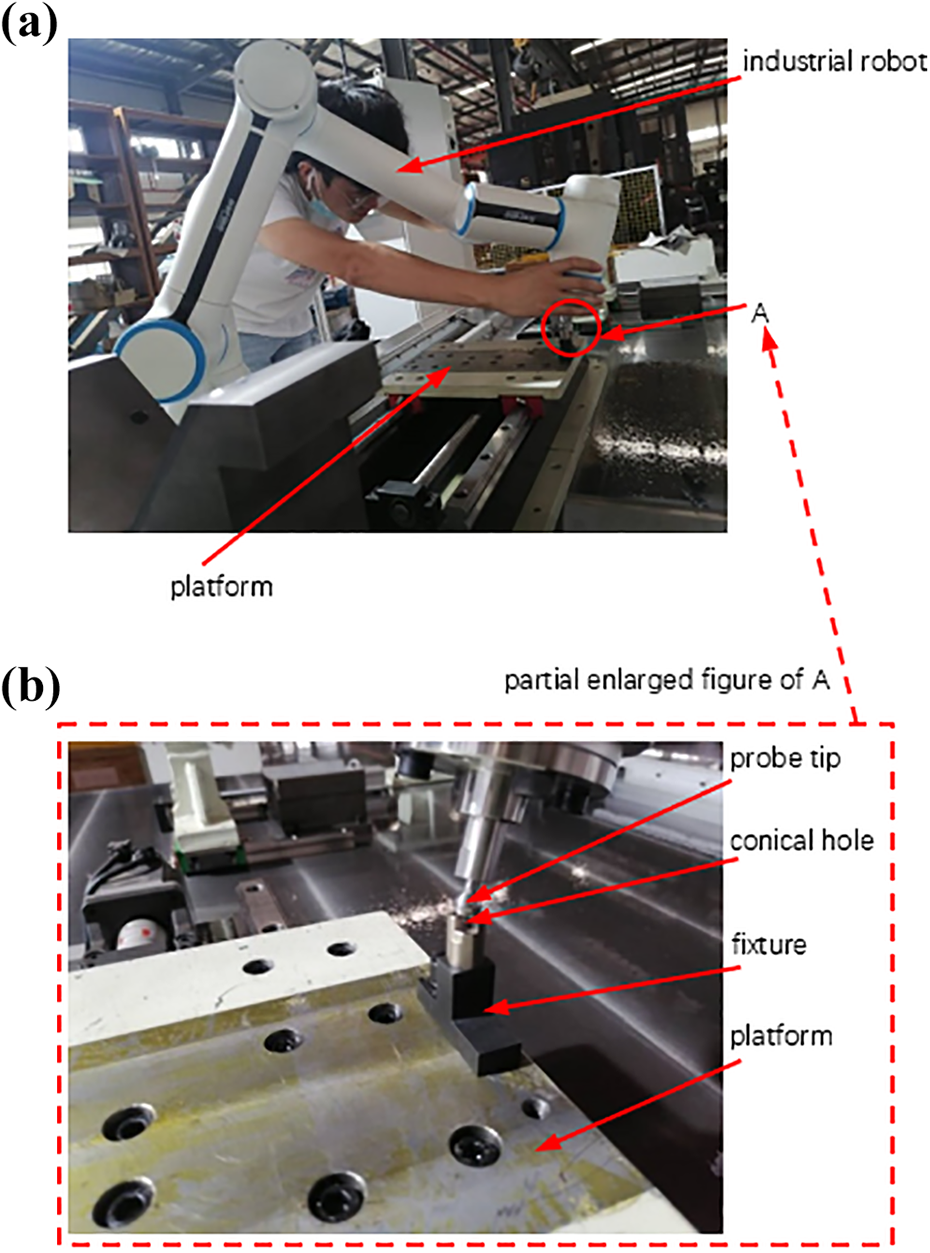
The experimental test of the single point repeatability. (a) and (b) are global figure of the single point repeatability test and partial enlarged figure of A, respectively.
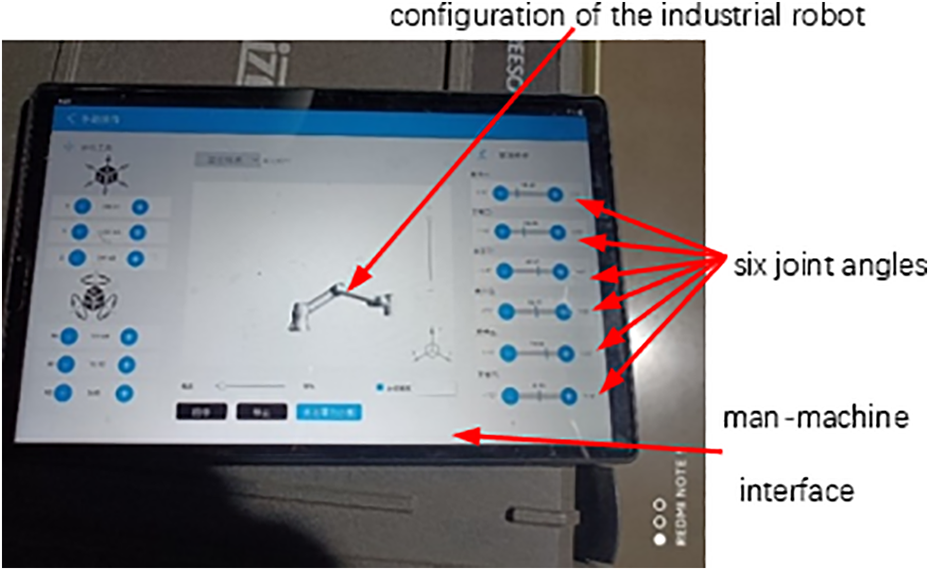
The man–machine interface.
Parameters identification
After obtaining N groups of joint angles, they are used as the data set by AGA, SA, and AGA-SA, respectively, to optimize the structural parameters. If a certain best individual
Other critical problems are the range settings of the various variables of the industrial robot and their boundary treatments when the variables exceed the corresponding boundaries. In this article, because the values of the length parameters are nonnegative numbers and the nominal values of
When a certain variable y among the structural parameters surpasses the corresponding limit, then it is newly generated randomly by a generator, which is expressed by Criterion A illustrated as:
Criterion A
If y exceeds the corresponding constraint
where
Note that the closer the any two arbitrary individuals Xi
and Xj
are, the smaller of the gap between their fitness values are. That is to say, if

Evolutionary curve of the objective function optimized by AGA-SA. AGA-SA: simulated annealing-based adaptive genetic algorithm.

Evolutionary curve of
The calibrated structural parameters of the industrial robot with respect to AGA.
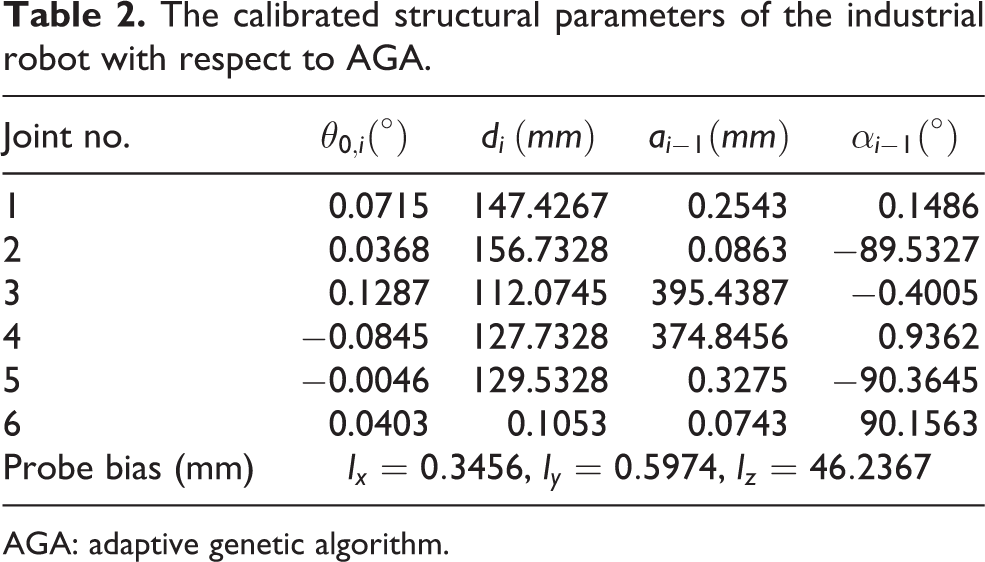
AGA: adaptive genetic algorithm.
The calibrated structural parameters of the industrial robot with respect to SA.

SA: simulated annealing.
The calibrated structural parameters of the industrial robot with respect to AGA-SA.
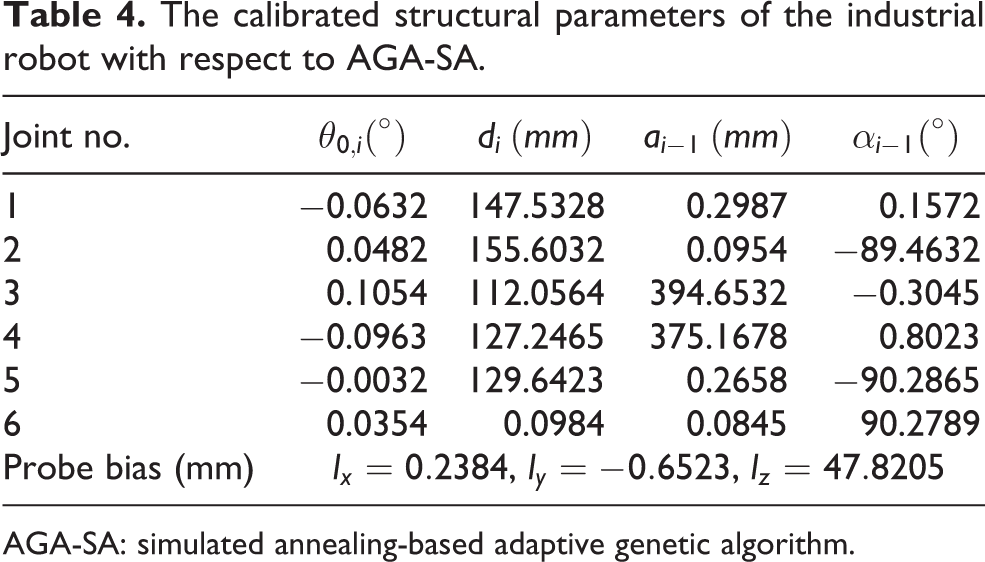
AGA-SA: simulated annealing-based adaptive genetic algorithm.
Verification of the calibrated parameters
Because it is difficult for us to measure the real structural parameters of the industrial robot, thus the single point repeatability test illustrated in Figure 5 and the length test illustrated in Figure 9 are simultaneously used in this phase to verify the effectiveness and correctness of the method used in this article. As is shown in Figure 5, the single point is tested for many times and repeatability results with respect to AGA, SA, and AGA-SA are shown in Figure 10.

The experimental test of the standard distance L between the (a) left and (b) right standard balls.

The changing curves of the single point repeatability. (a) is the changing curve of single point repeatability before calibration and (b), (c), and (d) are the changing curves of single point repeatability after calibration with respect to AGA, SA, and AGA-SA, respectively. AGA: adaptive genetic algorithm; SA: simulated annealing; AGA-SA: simulated annealing-based adaptive genetic algorithm.
As is shown in Figure 9, the two standard balls are attached to the fixture plate with a standard length L between the two ball centers

Let

and

For comparison, the standard length L is tested for many times and the corresponding error curves are shown in Figure 11. Note that the radiuses of the two standard balls are all R and the length between the two centers

The changing curve of the deviation of the standard length L between the two standard balls.
Discussion
After the experiments are completed and verifications are accomplished which are illustrated by the tables and figures, observations can be made and conclusions can be drawn consequently, which are divided into Part 1 and Part 2, respectively.
Part 1. The observations and conclusions about single point repeatability
Before calibration, it is observed from Figure 10(a) that:
①The maximal (Max), minimal (Min), mean (Mea), and standard deviations (Std) of the single point repeatability before calibration are 4.5898 mm, 0.3409 mm, 2.3534 mm, and 0.9331 mm, respectively.
②The Max, Min, Mea, and Std of the single point repeatability before calibration in x direction are 3.3673 mm, −3.1302 mm, 0.020606 mm, and 2.0215 mm, respectively; in y direction are 4.1769 mm, −1.3273 mm, 0.44338 mm, and 1.2210 mm, respectively; and in z direction are 1.7511 mm, −1.4132 mm, −0.17053 mm, and 0.9722 mm, respectively.
However, after optimized by AGA, Figure 10(b) tells us that:
①The Max, Min, Mea, and Std of the single point repeatability after calibration are 0.2344 mm, 0.0630 mm, 0.1438 mm, and 0.0384 mm, respectively.
②The Max, Min, Mea, and Std of the single point repeatability after calibration in x direction are 0.1395 mm, −0.1436 mm, 0.0164 mm, and 0.0853 mm, respectively; in y direction are 0.1490 mm, −0.1482 mm, −0.0101 mm, and 0.0890 mm, respectively; and in z direction are 0.1381 mm, −0.1468 mm, −0.0190 mm, and 0.0815 mm, respectively.
After optimized by SA, Figure 10(c) tells us that:
①The Max, Min, Mea, and Std of the single point repeatability after calibration are 0.4224 mm, 0.0675 mm, 0.2433 mm, and 0.0950 mm, respectively.
②The Max, Min, Mea, and Std of the single point repeatability after calibration in x direction are 0.2850 mm, −0.1865 mm, 0.0133 mm, and 0.1371 mm, respectively; in y direction are 0.2999 mm, −0.1924 mm, 0.0645 mm, and 0.1501 mm, respectively; and in z direction are 0.2758 mm, −0.1920 mm, 0.0551 mm, and 0.1337 mm, respectively.
After optimized by AGA-SA, it is derived from Figure10(d) that:
①The Max, Min, Mea, and Std of the single point repeatability after calibration are 0.1125 mm, 0.0063 mm, 0.0833 mm, and 0.0189 mm, respectively.
②The Max, Min, Mea, and Std of the single point repeatability after calibration in x direction are 0.0794 mm, −0.0737 mm, 0.0017 mm, and 0.0516 mm, respectively; in y direction are 0.0698 mm, −0.0724 mm, −0.0075 mm, and 0.0454 mm, respectively; and in z direction are 0.0787 mm, −0.0766 mm, −0.0039 mm, and 0.0513 mm, respectively.
From the results presented above, analyses can be conducted and some conclusions can be acquired about single point repeatability as follows:
After optimized by AGA, it is concluded that:
①The Max, Min, Mea, and Std of the single point repeatability after calibration compared with those before calibration have been decreased by 95%, 81%, 94%, and 95%, respectively.
②The Max, Min, Mea, and Std of the single point repeatability after calibration compared with those before calibration in x direction are decreased by 96%, 95%, 20%, and 96%, respectively; in y direction are decreased by 96%, 89%, 77%, and 92%, respectively; and in z direction are decreased by 92%, 89%, 89%, and 92%, respectively.
After optimized by SA, conclusions are made that:
①The Max, Min, Mea, and Std of the single point repeatability after calibration compared with those before calibration have been decreased by 91%, 80%, 90%, and 89%, respectively.
②The Max, Min, Mea, and Std of the single point repeatability after calibration compared with those before calibration in x direction are decreased by 92%, 94%, 35%, and 93%, respectively; in y direction are decreased by 93%, 86%, 85%, and 88%, respectively; and in z direction are decreased by 84%, 86%, 68%, and 86%, respectively.
After optimized by AGA-SA, it is observed that:
①The Max, Min, Mea, and Std of the single point repeatability after calibration compared with those before calibration have been decreased by 98%, 98%, 96%, and 98%, respectively.
②The Max, Min, Mea, and Std of the single point repeatability after calibration compared with those before calibration in x direction are decreased by 98%, 98%, 92%, and 98%, respectively; in y direction are decreased by 98%, 95%, 83%, and 96%, respectively; and in z direction are decreased by 96%, 95%, 98%, and 95%, respectively.
Part 2. The observations and conclusions about length error
Before calibration, it is observed from Figure 11 that the Max, Min, Mea, and Std of the length error
After optimized by AGA, SA, and AGA-SA, it is derived from Figure 11 that the Max, Min, Mea, and Std of
From the results presented above, analyses can be conducted and some conclusions can be acquired that the Max, Min, Mea, and Std of
Overall, from the observations and analysis presented above, it is evidently derived that: It is nearly impossible for us to conduct the method of measuring the real coordinates of the probe tip of the industrial robot and directly computing the real structural parameters using the tested data in the real fields, thus a method that combines testing the rotational angles of the probe tip of the industrial robot and utilizing the hybrid algorithm AGA-SA is proposed to simplify the process and resolve the contradictions. The Max, Min, Mea, and Std of the single point repeatability and length error, including their three components in the corresponding directions, are all decreased with a big scale after optimized by corresponding algorithms (AGA, SA, and AGA-SA). However, nearly all the Max, Min, Mea, and Std of the single point repeatability and length error are decreased with a greater scale after optimized by AGA-SA than those optimized by AGA or SA at the same time. Through this analysis, it is shown that the precision and relevant errors of the industrial robot are respectively increased and decreased drastically with a bigger corresponding increasing and decreasing magnitude after optimized by AGA-SA than those optimized by AGA and SA, which indicates that this proposed method and algorithm are effective and more suitable for us to calibrate the real structural parameters of the industrial robot than AGA and SA simultaneously.
Conclusions
A kinematic model of the industrial robot is established based on MDH model firstly. Then, the kinematic model and error formula are analyzed and results are derived that: (1) it is extreme difficult even impossible for us to measure the real coordinates of the industrial robot and; (2) only using a simple conventional algorithm is easy to be trapped in the local optimal region and thus incapable of searching for the real structural parameters of the industrial robot. Moreover, based on these facts and to solve the problem presented previously, the algorithm of AGA and SA are combined to formulate a hybrid algorithm AGA-SA which simultaneously has a good local searing ability and global exploring capacity. And then, the experiments of the single point repeatability and the length test are conducted combining the hybrid algorithm to calibrate the structural parameters and verify the effectiveness of the proposed method. The result shows that the single point repeatability and the length deviation after calibrated by AGA-SA are all decreased substantially and with a bigger magnitude compared with those calibrated by AGA or SA, which suggests that this method is effective and more suitable for us to greatly increase the precision and decrease the movement uncertainty of the industrial robot than AGA and SA.
The proposed modeling and identification method can be commonly expanded to the calibration of a serials of robots, where the identification method is required to increase the accuracy of the corresponding robots. This will be furtherly studied in our future work.
Footnotes
Declaration of conflicting interests
The author(s) declared no potential conflicts of interest with respect to the research, authorship, and/or publication of this article.
Funding
The author(s) received no financial support for the research, authorship, and/or publication of this article.