
Abstract
Objective:
CA-125 is widely used as biomarker of ovarian cancer. However, CA-125 suffers low accuracy. We developed a hybrid analytical model, the Ovarian Cancer Decision Tree (OCDT), employing a two-layer decision tree, which considers genetic alteration information from cell-free DNA along with CA-125 value to distinguish malignant tumors from benign tumors.
Methods:
We consider major copy number alterations at whole chromosome and chromosome-arm level as the main feature of our detection model. Fifty-eight patients diagnosed with malignant tumors, 66 with borderline tumors, and 10 with benign tumors were enrolled.
Results:
Genetic analysis revealed significant arm-level imbalances in most malignant tumors, especially in high-grade serous cancers in which 12 chromosome arms with significant aneuploidy (P<0.01) were identified, including 7 arms with significant gains and 5 with significant losses. The area under receiver operating characteristic curve (AUC) was 0.8985 for copy number variations analysis, compared to 0.8751 of CA125. The OCDT was generated with a cancerous score (CScore) threshold of 5.18 for the first level, and a CA-125 value of 103.1 for the second level. Our most optimized OCDT model achieved an AUC of 0.975.
Conclusions:
The results suggested that genetic variations extracted from cfDNA can be combined with CA-125, and together improved the differential diagnosis of malignant from benign ovarian tumors. The model would aid in the pre-operative assessment of women with adnexal masses. Future clinical trials need to be conducted to further evaluate the value of CScore in clinical settings and search for the optimal threshold for malignancy detection.
Introduction
Ovarian cancer is a major cause of mortality among gynecologic malignancies. There were approximately 22,240 new cases and 14,070 deaths estimated in the United States in 2018. 1 In China, the estimated number of new cases and deaths in 2015 were up to 52,100 and 22,500, respectively. 2 Around 75% of women with ovarian cancer experience tumor relapse and chemo-resistance. 3 The symptoms for ovarian cancer are non-specific and not pathognomonic for the disease; therefore, most ovarian cancer patients are diagnosed at a late stage. At present, effective screening tools to detect the disease at an early stage are lacking.
CA-125—a mucin-like glycoprotein—has been used as a serum biomarker for ovarian cancer detection for over three decades. CA-125 levels higher than 35 U/mL are considered as abnormal and are widely observed in ovarian cancer. 4 In epithelial ovarian cancer, CA-125 is used in clinical practice for the first assessment of pelvic masses 5 and for monitoring response to treatment. 6 However, CA-125 is limited by specificity, since it can also be elevated in women with benign ovarian tumors, pelvic inflammatory disease, endometriosis, and peritoneal disease.7,8 Previous research demonstrates that CA-125 levels are only elevated in 79% 9 and 50% 10 of all or early stage ovarian cancer patients, respectively. In 1999, the human epididymis secretory protein 4 (HE4) gene was found to be overexpressed in ovarian cancer. 11 Moore et al. 12 published a series of papers that used a combination of CA-125, HE4, and menopausal status to predict the presence of a malignant ovarian tumor. The prediction rate was higher when CA-125 was combined with HE4, showing sensitivity for detecting malignant disease of 76.4% at a specificity of 95%. Serum concentration of HE4 depends on the stage of ovarian cancer and the ovarian carcinoma subtype. 13 Therefore, there is still an urgent need to develop a sensitive and highly specific tool to distinguish malignant from benign ovarian tumors.
Circulating tumor DNA is a small proportion of cell-free DNA (cfDNA) released from tumor cells due to apoptosis or necrosis, and has been detected in the plasma of patients with various types of cancer.14,15 Several cancer-related molecular alterations, including tumor-specific mutations, microsatellite instability, loss of heterozygosity, and DNA methylation can be detected in cfDNA using various technologies.16,17 More specifically, whole genome sequencing (WGS) of cfDNA has been used as a sensitive clinical tool for cancer detection, as well as the prediction of treatment response, relapse, and overall survival.18,19 WGS can reveal significant copy number variations (CNVs) in cfDNA as well as in matched tumor tissues. 20 CNVs, defined as chromosomal regions amplified or deleted in the genome, have been a major form of cancer genome variation, and are generally related to cancer progression. Previous studies have shown that patients with breast, lung, and prostate cancer have specific CNVs in their plasma cfDNA that faithfully mirror those tissues in their primary cancer sites, indicating that somatic variations from cancer tissues could be detected from cfDNA.21-23
Cohen et al. 24 also reported that low coverage WGS of cfDNA identified 40.6% of high-grade serous ovarian cancer. Vanderstichele et al. 25 found that the detection rate can be further improved using a genome-wide z-score algorithm, which achieved an area under the curve (AUC) of 0.89 in terms of differentiating 11 benign from 57 invasive/borderline tumors. More recently, abnormal genome alterations from cfDNA were found in 43% of 83 ovarian cancer patients using a support vector machine. 26 Amant et al. 27 reported that during non-invasive prenatal testing (NIPT) in over 4000 prospective pregnancies by parallel sequencing of maternal plasma cfDNA, three aberrant genome representation profiles were observed, and those three patients were referred for magnetic resonance imaging and subsequent pathologic and genetic investigations. The results showed that they were diagnosed as an ovarian carcinoma, a follicular lymphoma, and a Hodgkin lymphoma. All the results suggested that genomic profiling for CNVs may be a feasible approach to improve the performance of CA-125 in the diagnosis of ovarian cancer.
In contrast to the algorithms used in previous work, which basically sum up sub-chromosomal gains or losses, we considered chromosome imbalances as the main focus of the study. More precisely, we consider major copy number alterations at whole chromosome and chromosome-arm level as the main feature of our detection model. 28 We first explored the possibility of utilizing macro-scale chromosome imbalances of cfDNA as a non-invasive tool for the detection of ovarian malignancy. Second, we identified specific patterns of macro-scale chromosome imbalances across many ovarian cancer subtypes, as have been partly shown in other cancer types, 29 and their functional effects through CNV analysis of vital oncogenes.30,31
Methods and materials
Patients and clinical data
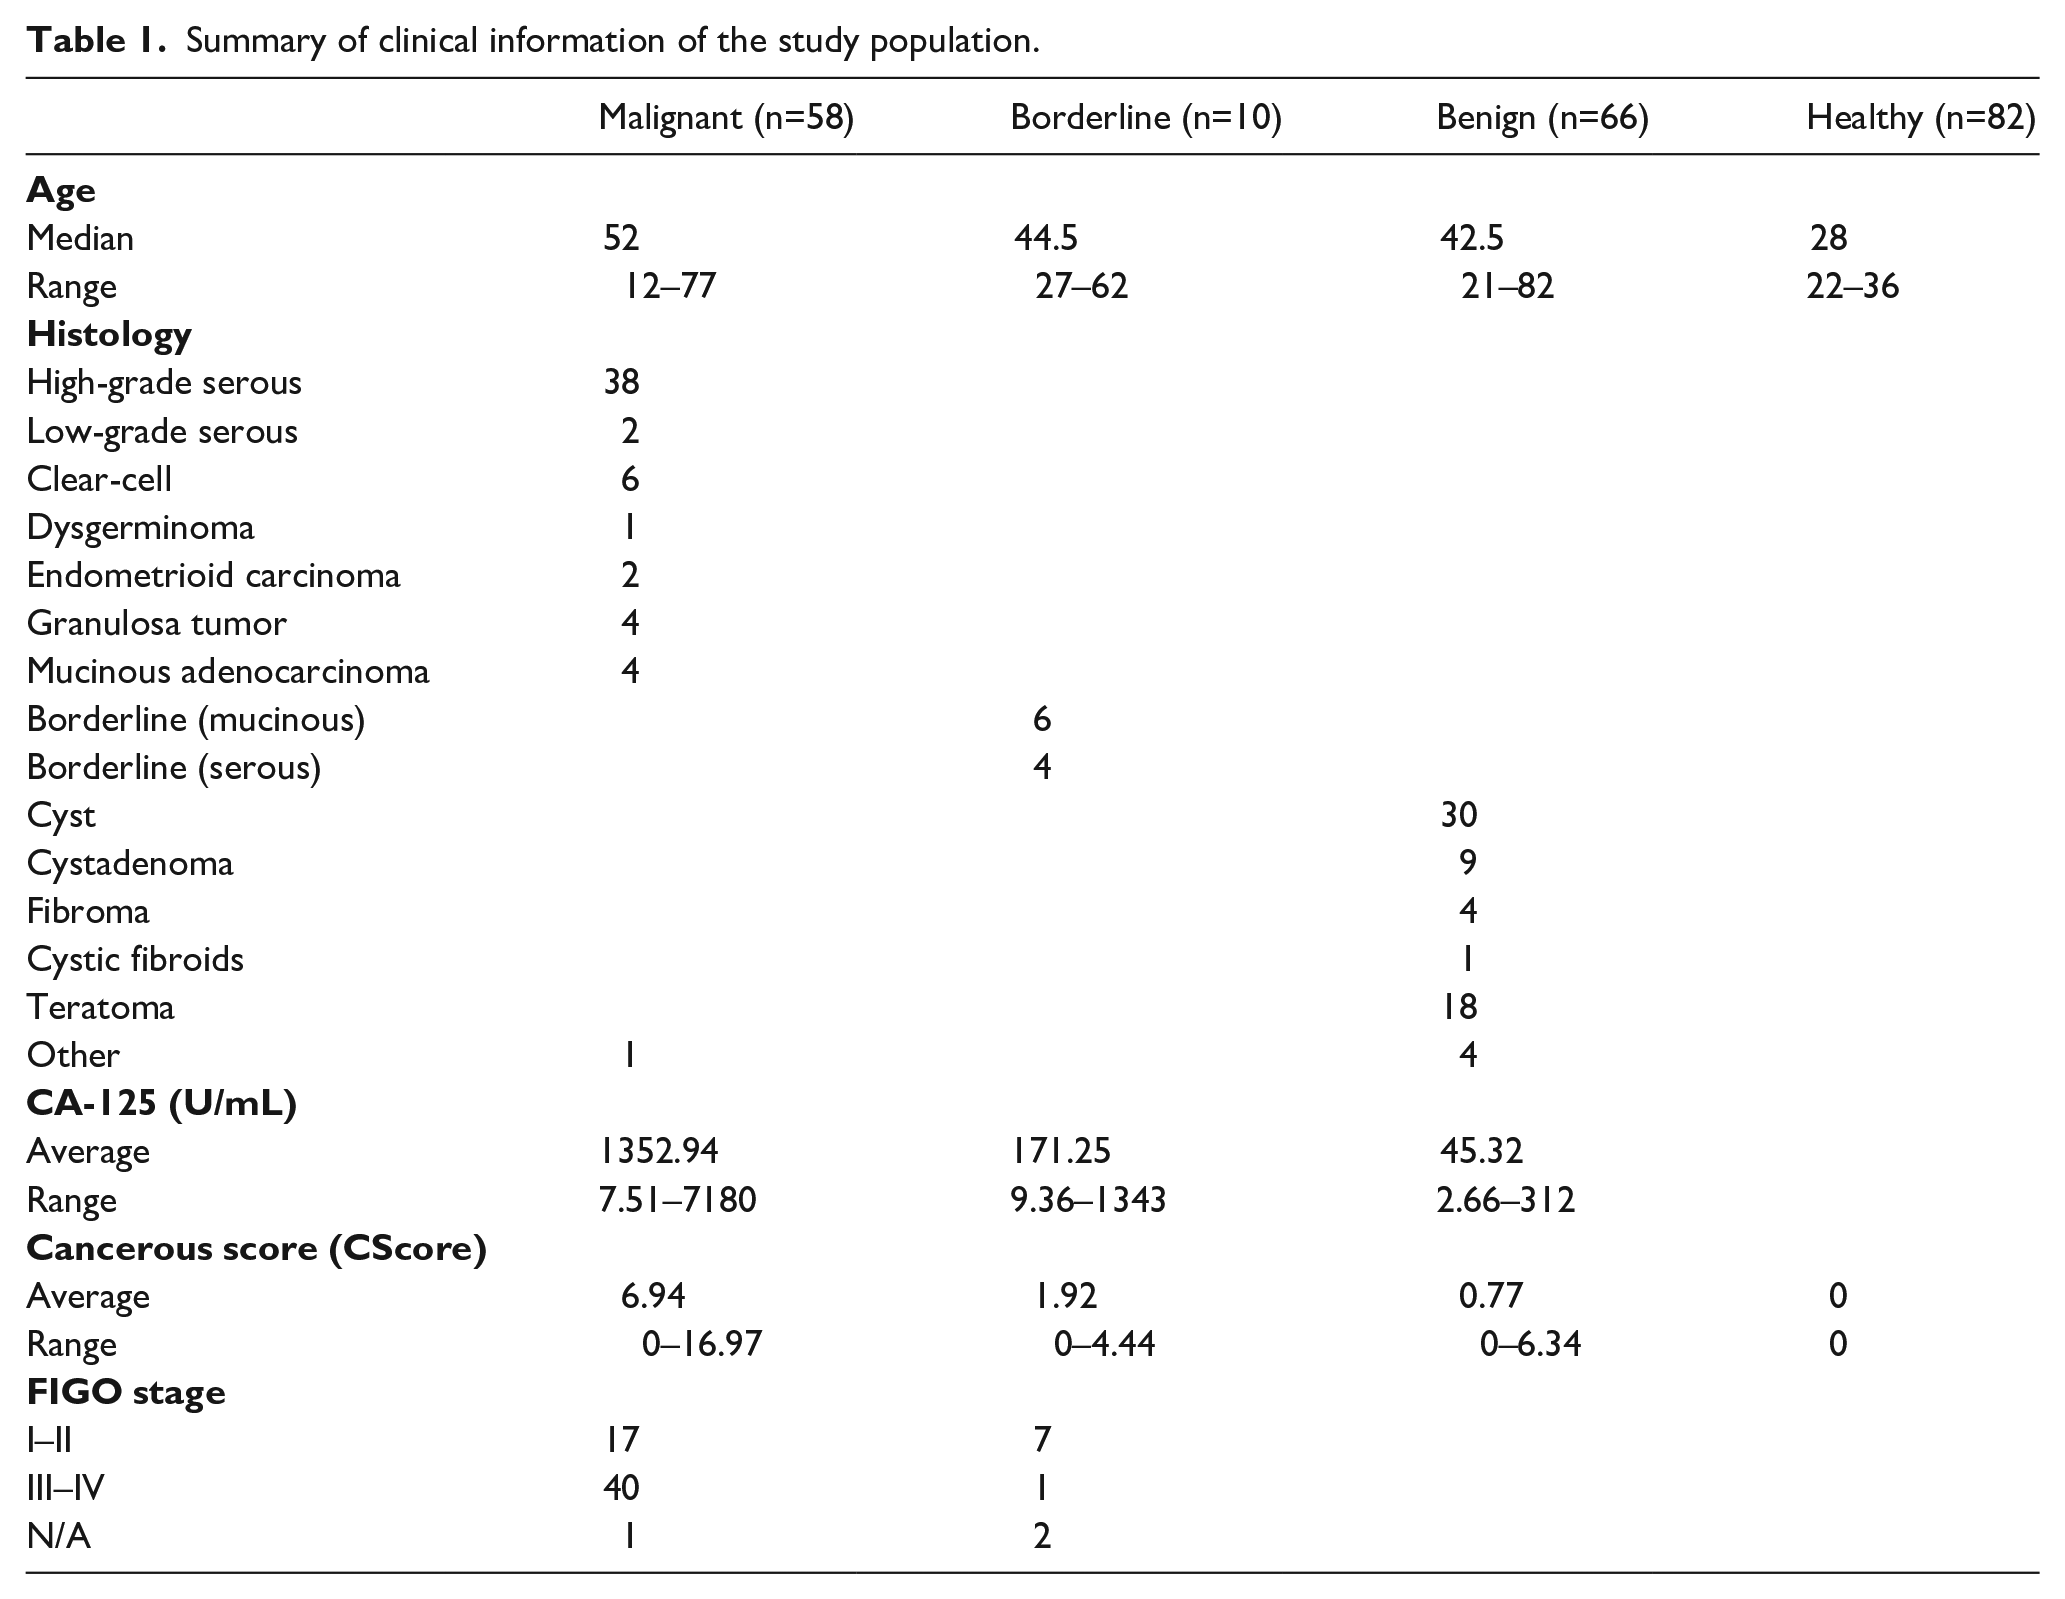
Ethical approval for the study (2017/15) was granted by the Qingdao Municipal Hospital Clinical Research Ethics Committee. All the patients in this study were admitted to the Department of Gynecology of the Qingdao Municipal Hospital from January 2017 to September 2019. All patients were chemotherapy-naive without other cancer history. Blood samples were collected for cfDNA extraction and CA-125 measurement before primary surgery. All recruited subjects signed a written informed consent. There were 58 patients diagnosed with malignant tumors at stage I–IV, 66 with benign tumors, and 10 with borderline tumors. The clinical and pathological information are summarized in Table 1 and Supplemental Table 2. Two-thirds of patients (38 cases) were diagnosed with high-grade serous cancers (HGSC), with the remaining including low-grade serous cancer, clear-cell carcinoma, dysgerminoma, endometrioid carcinoma, granulosa tumor, and mucinous adenocarcinoma, in which 17 cancer patients were diagnosed at an early stage (FIGO I–II) while 40 patients were diagnosed at a late stage (FIGO III–IV). Details were not available for one patient who refused a comprehensive staging operation. All participants were followed up. A total of 82 healthy females (aged from 20 to 67) signed a written informed consent from Qingdao Municipal Hospital Medical Examination Center for a health examination also joined in the study. A control panel was obtained for a normalization reference and z-score calculations by collecting plasma samples from these 82 healthy females. The plasma samples from the healthy females were used as controls for all comparisons in the study.
Summary of clinical information of the study population.
Experimental design
Total genomic DNA and cfDNA were isolated from tissue and plasma samples by using the Amp Genomic DNA Kit (TIANGEN) and the QIAseq cfDNA Extraction Kit (Qiagen), respectively. DNA concentration was measured by Qubit Fluorometric Quantitation device (ThermoFisher). Next generation sequencing was performed following NIPT protocol as previously described. 32 For library preparation, genomic DNA was fragmented into an average size of 300 bp. A total of 100 ng of fragmented genomic DNA or 10 ng cfDNA was ligated to indexed sequencing adaptors and amplified by polymerase chain reaction following the manufacturer’s manual (NEB next Ultra II). Then, purified libraries were massively parallel sequenced by HiSeq X10 platform (Illumina).
Data processing pipeline and cancerous score (CScore) model
At least 3G raw sequencing data per sample were consequently obtained and aligned to the human reference genome hg19. Aligned bases with base quality higher than 30 (duplicates removed) were counted and summed into 50 kb bins. The coverage of bin k on chromosome i is represented as covChrik. Then, self-normalization was performed by dividing the raw coverage of each bin, by the mean bin coverage across whole genome. Then the mean coverage of chromosome p arm and q arm, represented as covChriparm and covChriparm, were calculated by averaging the bin coverage for each individual chromosome arm.
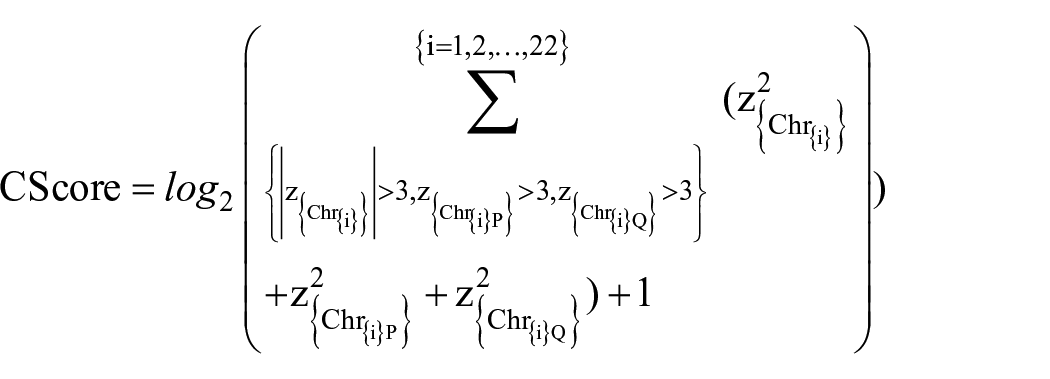
To capture imbalances at whole chromosome and chromosome arm level, we built a CScore model with two z-score normalized components, namely, PQ ratio and arm-level aneuploidy. Specifically, the PQ ratio RChri measured the extend of chromosomal imbalances of chromosome i, and was calculated as the ratio of covChriparmm and covChriparm. Second, arm-level aneuploidy was measured by simply comparing the mean arm-level coverage with healthy control as reference. Finally, both scores were transformed into z-scores by using the mean µcovChrip,µRChri and standard deviation σcovChrip,σRChri, extracted from a panel of normal control samples, respectively. CScore was presented as the logarithmic value of the sum of squares of the two components which has an absolute z-score value greater than 3 shown as follows:

where i=1,2,. . .,22, and
The laboratory researchers were blinded to the case/control allocation of samples.
Decision tree model
The decision tree partition was performed by the ctree (conditional inference trees) function in R-package party. In brief, it takes three recursive steps as follows: First, the global null hypothesis of independence between all input variables and response was tested, which was discontinued while this hypothesis is true; otherwise, the input variable which has the strongest association to the response were selected. Second, a binary split based on the selected variable was implemented. Third, steps 1 and 2 were repeated recursively.33,34
Cytoband copy number calculation and oncogene analysis
T-test was used for estimate of the cytoband coverage differences, which were gains or losses, between the malignant samples and the benign samples. P values less than 0.001 were considered statistically significant. Oncogenes located at the gain cytobands or tumor suppressors located at the loss cytobands were screened through integration of the genes within the cytobands with an oncogene or a tumor suppressor database, respectively. 35
Concordance analysis
To analyze chromosome alterations in tissue and plasma pairs. Pearson’s correlation coefficient was used for determining the concordance between tissue and plasma. The correlation value, larger than 0.85, was considered to represent concordance.
Statistical analysis
Statistical analysis R package pROC 36 was applied to estimate AUC of CScores by receiver operating characteristic (ROC) curves. All above packages ran with default parameters.
Results
Significant chromosome imbalances identified in ovarian cancer
As can be seen in Figure 1(a), chromosome aneuploidy can be widely observed in cancer cases, while women with borderline or benign tumors harbored significantly less chromosome abnormality. Further, we analyzed arm-level aneuploidy of malignant samples against benign samples (Figure 1(b)), in which 12 chromosome arms with significant aneuploidy (P<0.01) were identified, including 7 arms (11q, 8q, 1q, 5p, 20p, 3q, 20q) with significant gains, and 5 arms (17q, 16q, 18q, 17p, 4q) with significant losses. Among the 12 arms, 11q was the one with most significant gain, and 17q was the one with most significant loss. Chromosome aneuploidy was observed across the whole genome, which reflects the complex origin and molecular heterogeneous characteristics of ovarian cancer (Figure 1(c)).
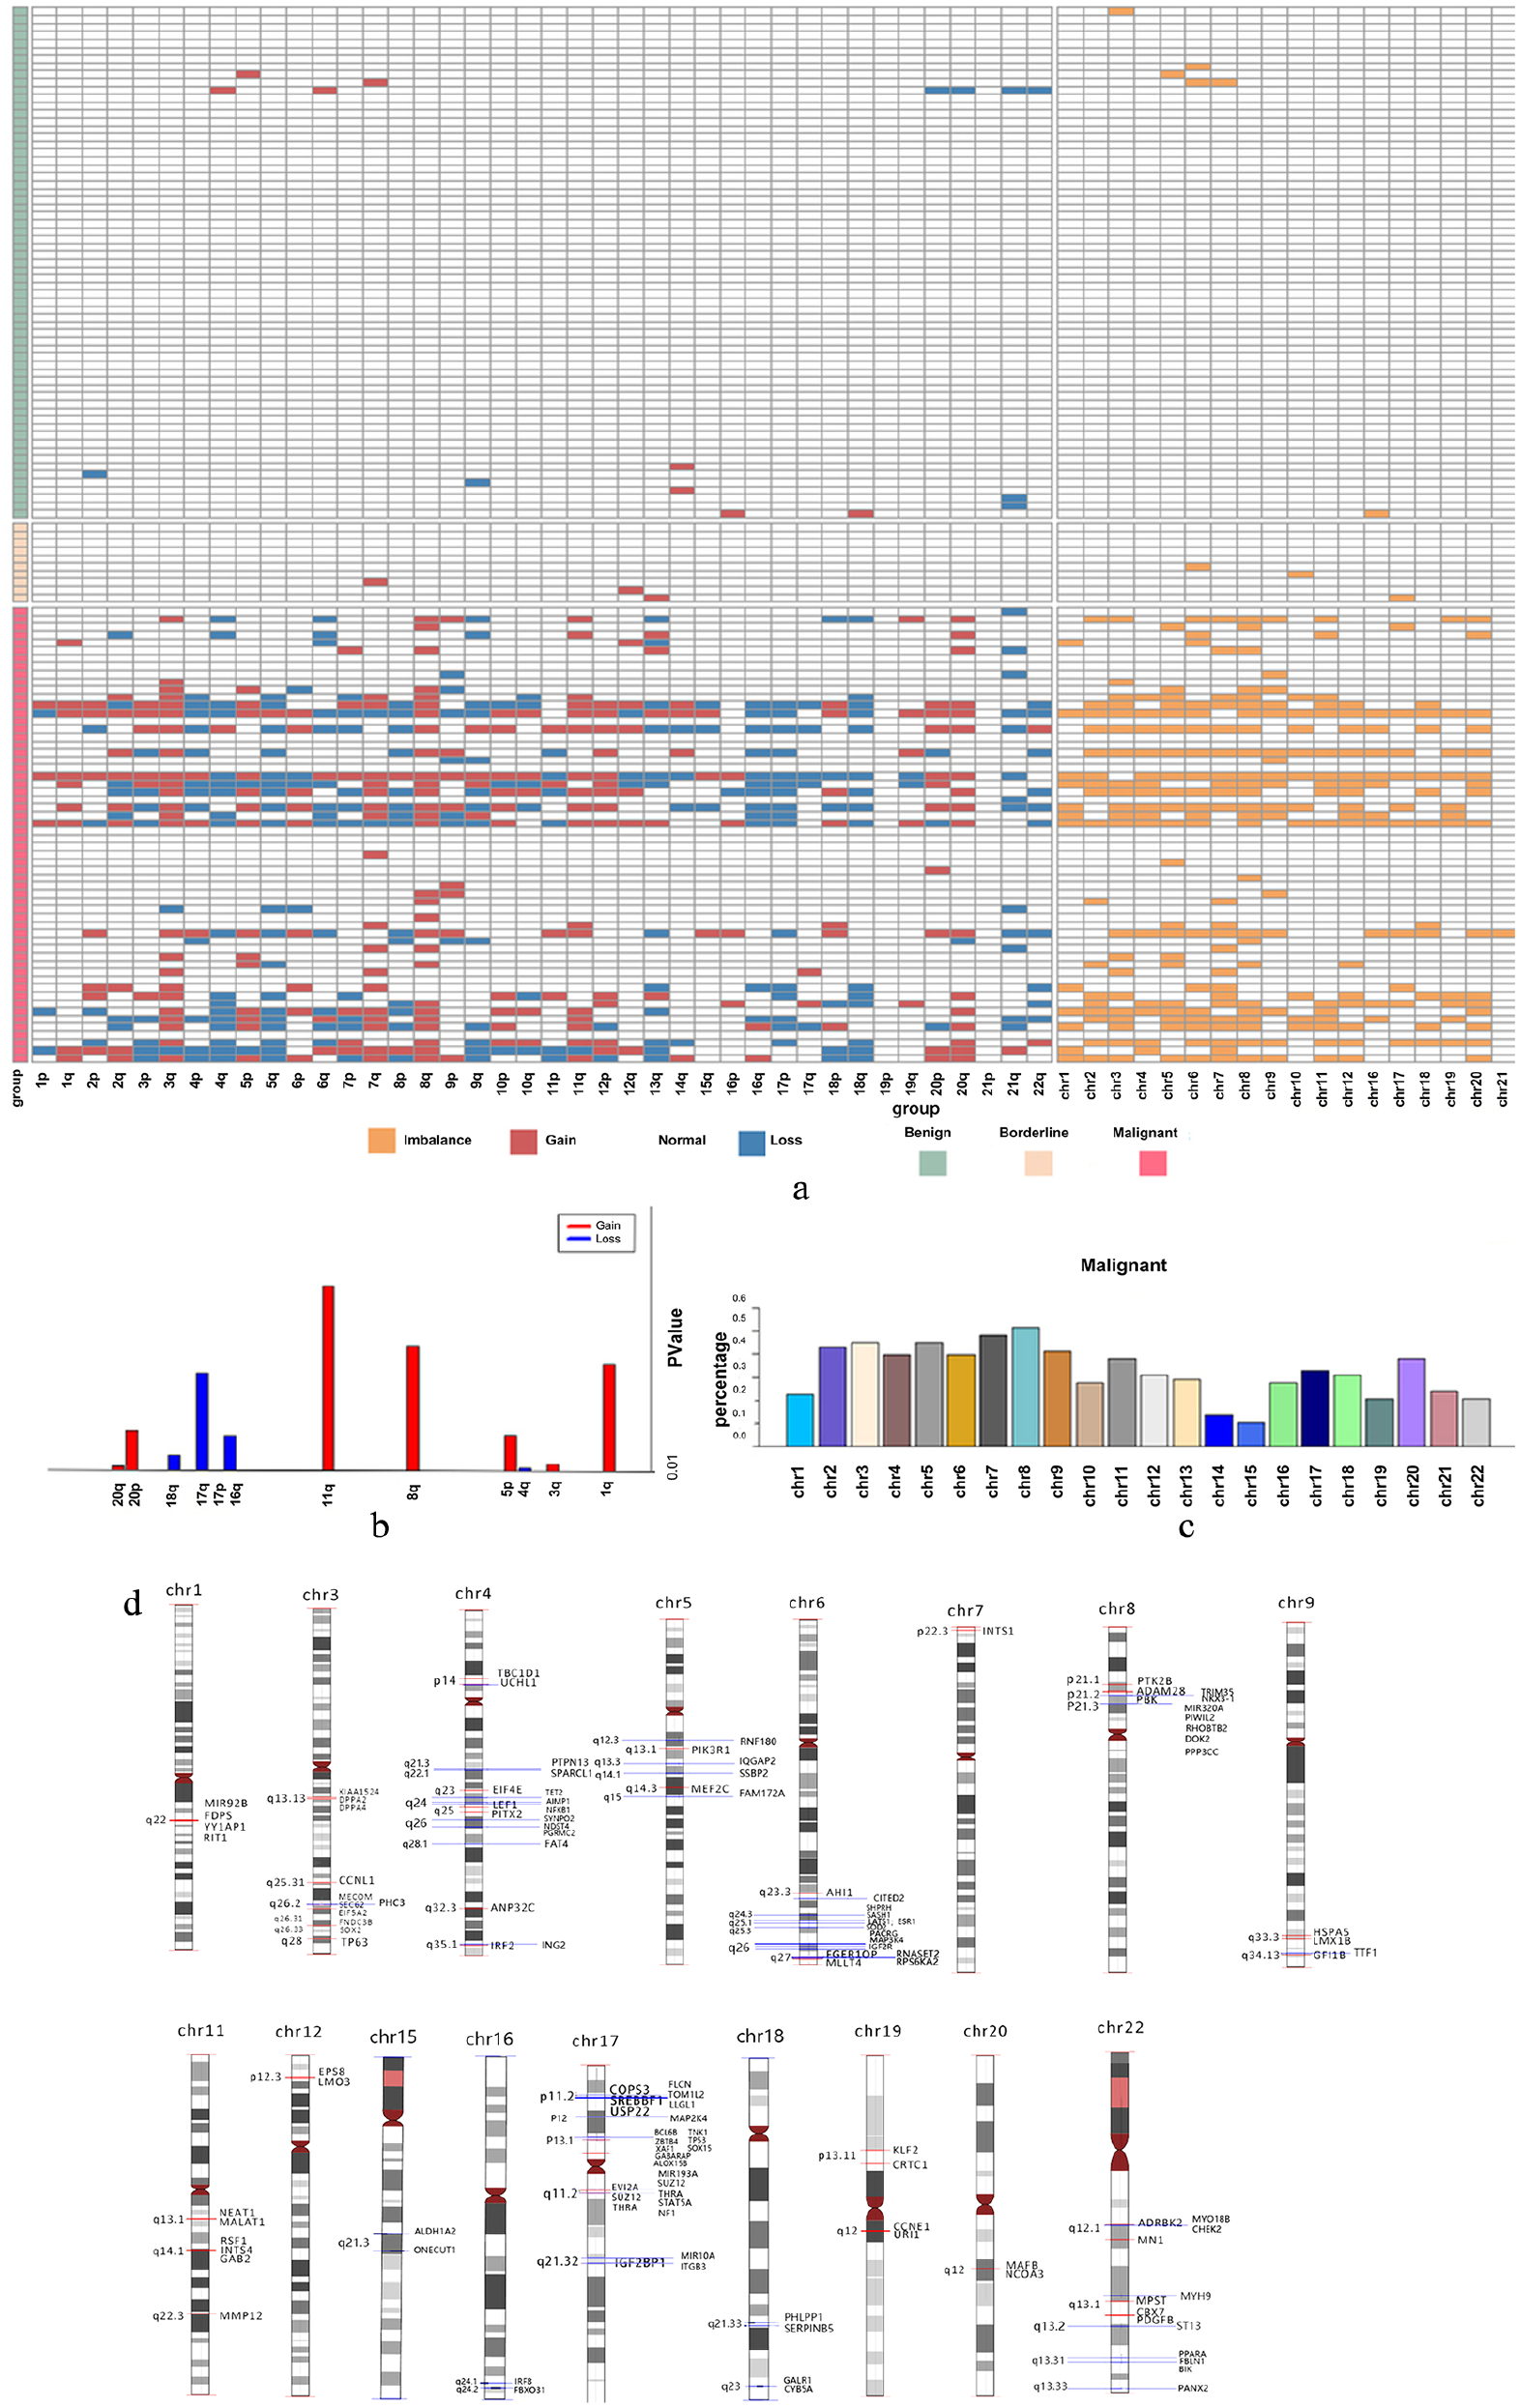
The chromosome imbalances profiles of plasma cfDNA. (a) Heatmap of chromosome imbalances of all 134 samples. (b) Chromosome arms with significant gain or loss between the malignant and benign samples. (c) Distribution of chromosome aneuploidy of all the malignant samples. (d) Gain or loss cytobands were indicated at each chromosome. Oncogenes and tumor suppressors within the cytobands were marked by red lines and blue lines, respectively.
We next analyzed oncogenes located at the gain cytobands and tumor suppressors located at the loss cytobands. In total, 59 oncogenes including TP63, SOX2, and CCNE1 were found within the gain cytobands. On the other hand, 70 tumor suppressor genes, including TP53, were found within the loss cytobands (Figure 1(d); Supplemental Table 1). The results imply potential oncogenic effects of the identified chromosome imbalances in ovarian cancer.
Chromosomal imbalances profile detected from cfDNA represents tumor tissues
Thirty matched tumor tissues were sequenced to confirm that chromosome imbalances observed in plasma cfDNA were truly originated from their primary tumor sites. Figure 2 shows the four most representative tissue-plasma pairs from the same patients visual inspection showed high concordance of chromosomal gains and losses in matched samples. Specifically, the Pearson correlation coefficients of patients (case number ovcc12, 53, 56, 57) were 0.95, 0.86, 0.76, and 0.84, respectively. The discrepancy between tissue and plasma samples may be a result of degradation of plasma cfDNA, which makes the chromosome imbalances detected in cfDNA only a subset of that in tissue. In the cases of patients ovcc56, 57 (case number), the plasma reflected mostly the “gain” parts rather than the “loss” parts of the tissue abnormality. Overall, the Pearson correlation of all ovarian cancer tissue plasma pairs by calculating the coefficient of the averaged tissue sample and the averaged plasma sample, is 0.93 (Figure 2(c)), which confirmed that plasma cfDNA can indeed carry the imbalances signal originated from the tissue.
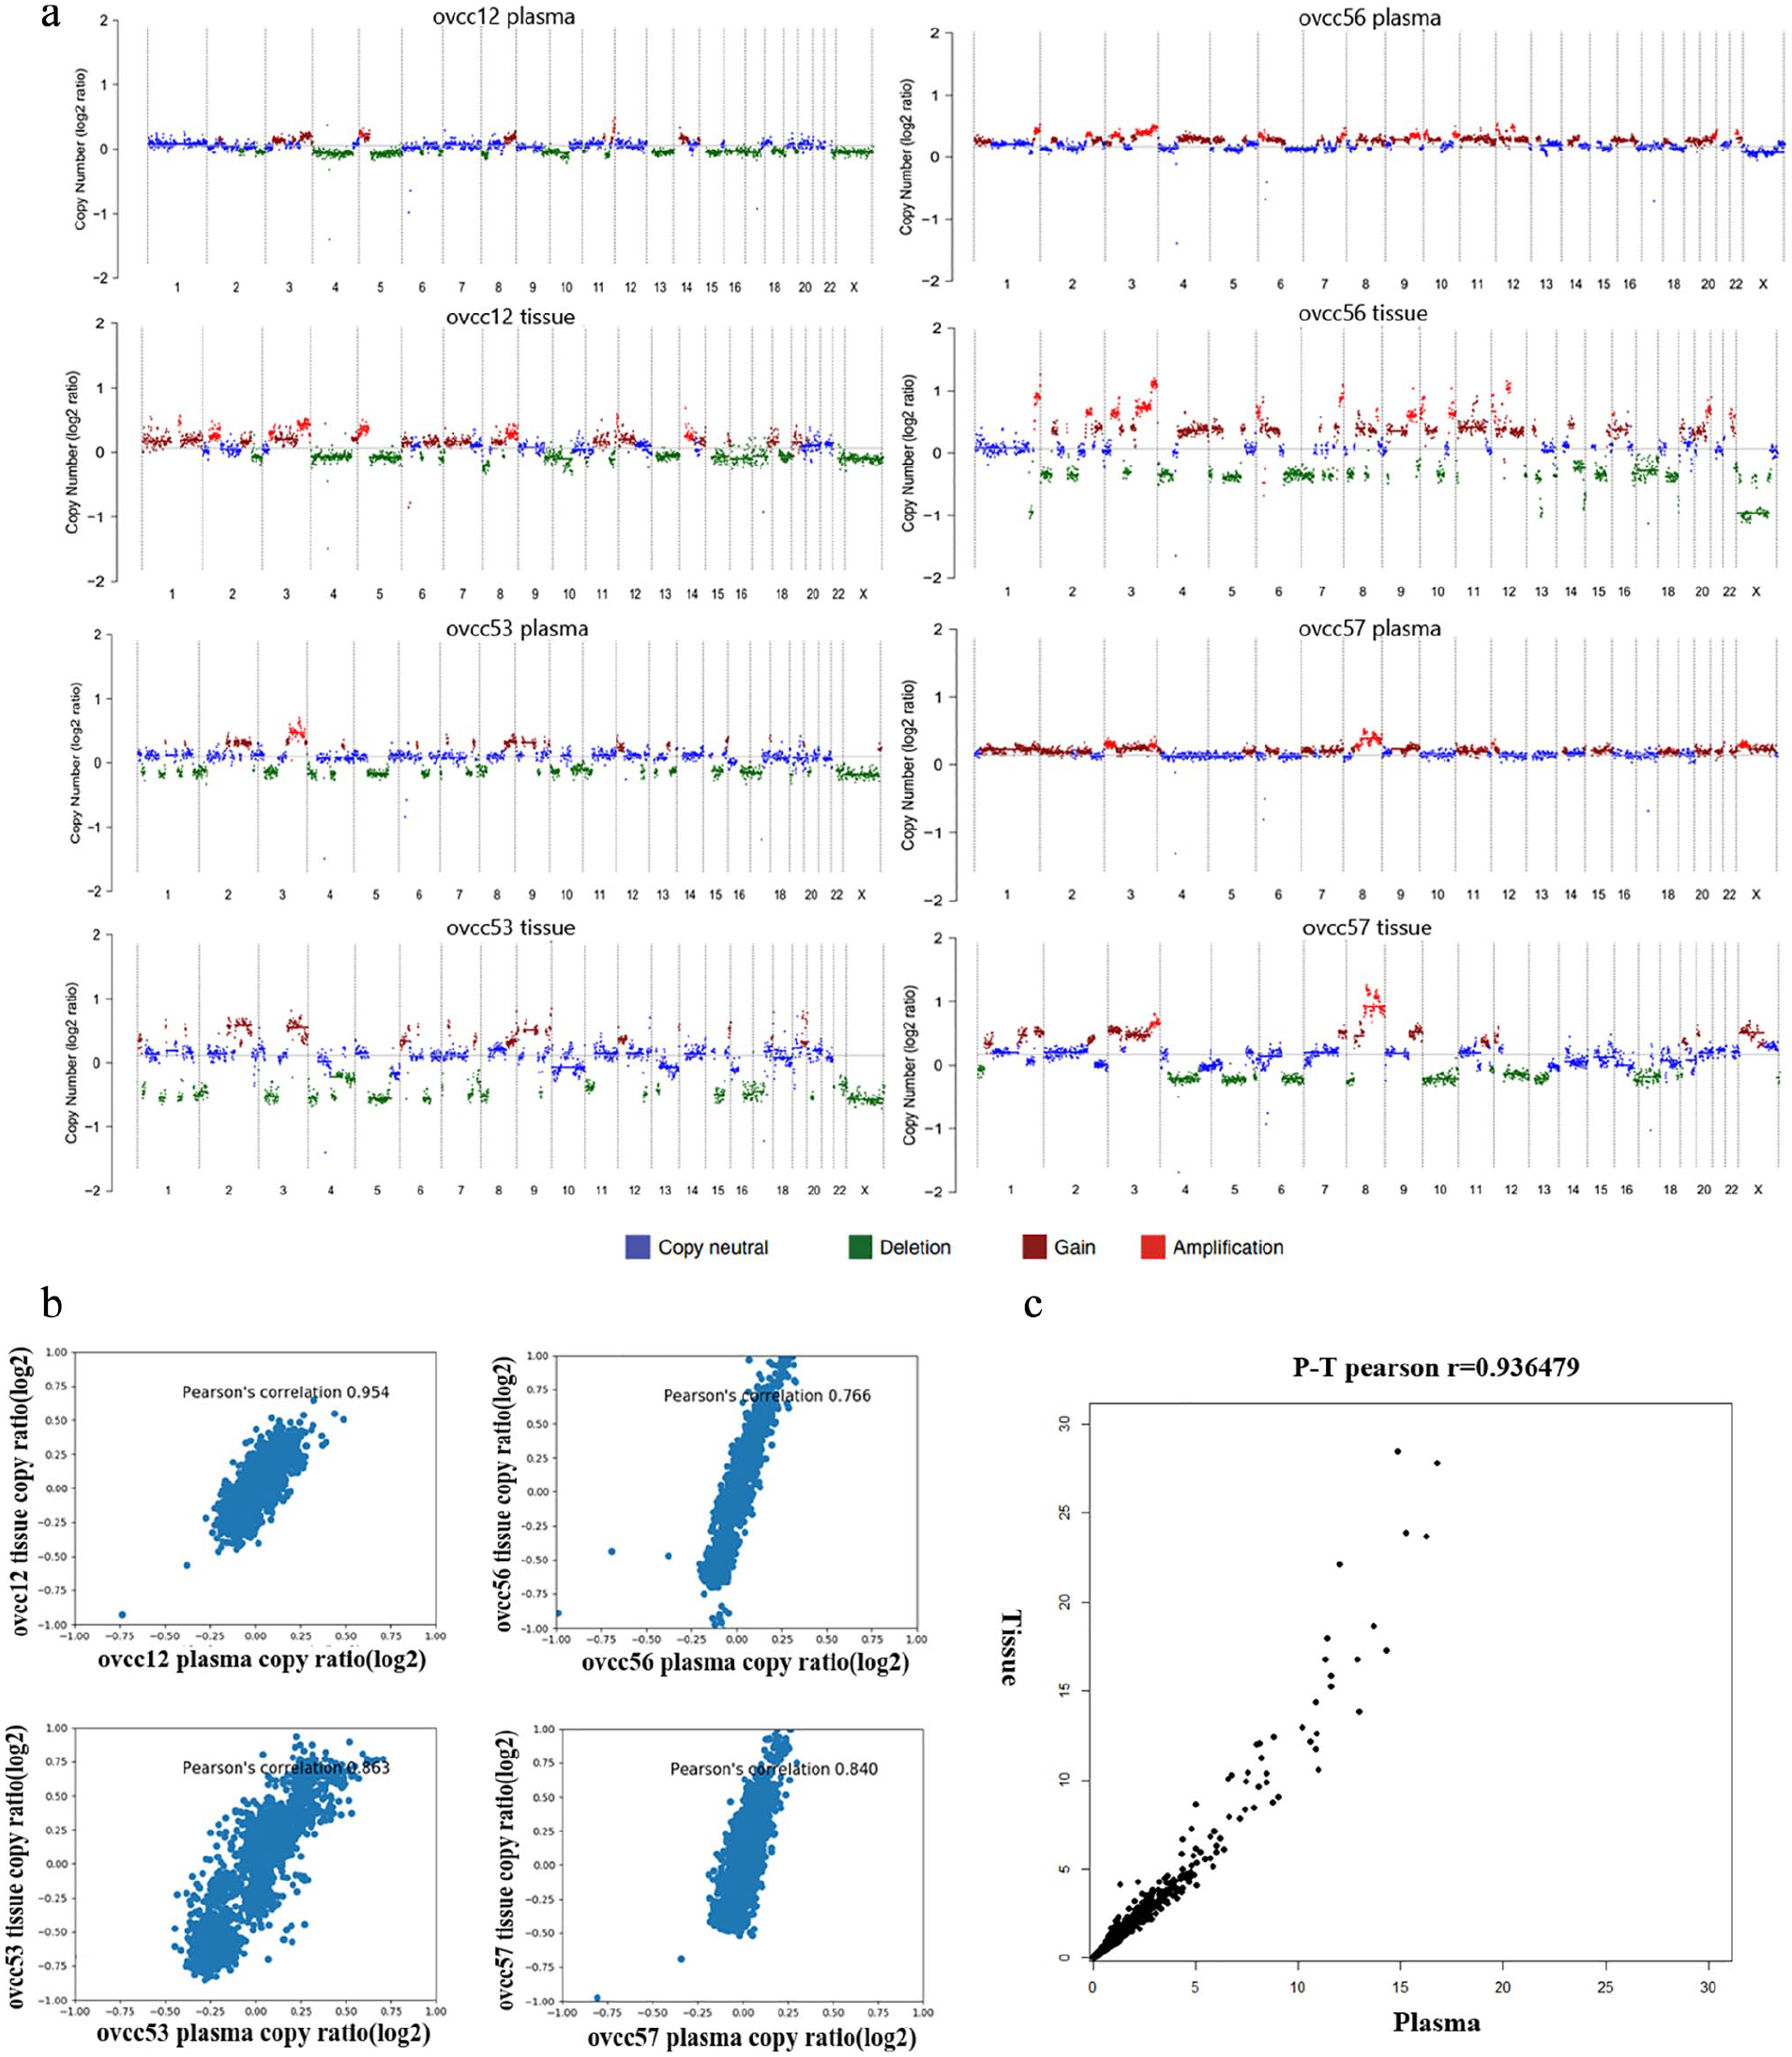
Chromosome copy number variations detected from paired tissue and plasma samples. (a) Genome-wide copy number variations were detected from cfDNA 1× WGS and paired tumor tissue 1× WGS. Ovarian cancer patients ovcc12, ovcc56, ovcc53, and ovcc57 were presented. (b) The correlation between cfDNA and paired tumor tissue was calculated using the Pearson correlation. (c) The Pearson correlation analysis shows the coefficients value of whole cfDNA samples and whole paired tumor tissue samples as 0.93.
Genome-wide analysis of chromosome imbalances in ovarian cancer patients
To quantify the extent of genome-wide chromosome imbalances, we calculated CScores of all samples enrolled in this study. CScore from the algorithm is expected to be positively correlated with the extend of individual genome-wide chromosome imbalances. As can be seen from Figure 3(a), our results show that 81% of ovarian cancer patients were detected with positive CScores. Of these positive CScores, 91% of patients had epithelial ovarian cancers and only 9% had non-epithelial ovarian cancers (Figure 3(b)). The percentage dropped to 50% and 18.2% in the borderline and the benign group, respectively. Moreover, the values of CScore in the cancer group are significantly higher than those in the borderline and the benign group. As expected, high-grade serous cancer has the highest average CScore than other groups, suggesting that CScore can indeed reflect tumor malignancy (Figure 3(b)). Next, we tried to use CScore as an independent biomarker to separate ovarian cancer from benign conditions. The CScores and CA-125 were used to perform ROC curve analysis using R. As shown in Figure 3(c), the AUC was 0.8985 for CNV analysis, compared to 0.8751 of CA-125. Compared to CA-125, the CScore-based prediction did not exhibit superior accuracy. The sensitivity of CA-125 and CScores was 76.47% vs. 58.82% and 92.5% vs. 90% for early- and late-stage ovarian malignant patients, respectively. The specificity of CA-125 and CScores was 65.15% and 81.82%, respectively (Supplementary Table 3).
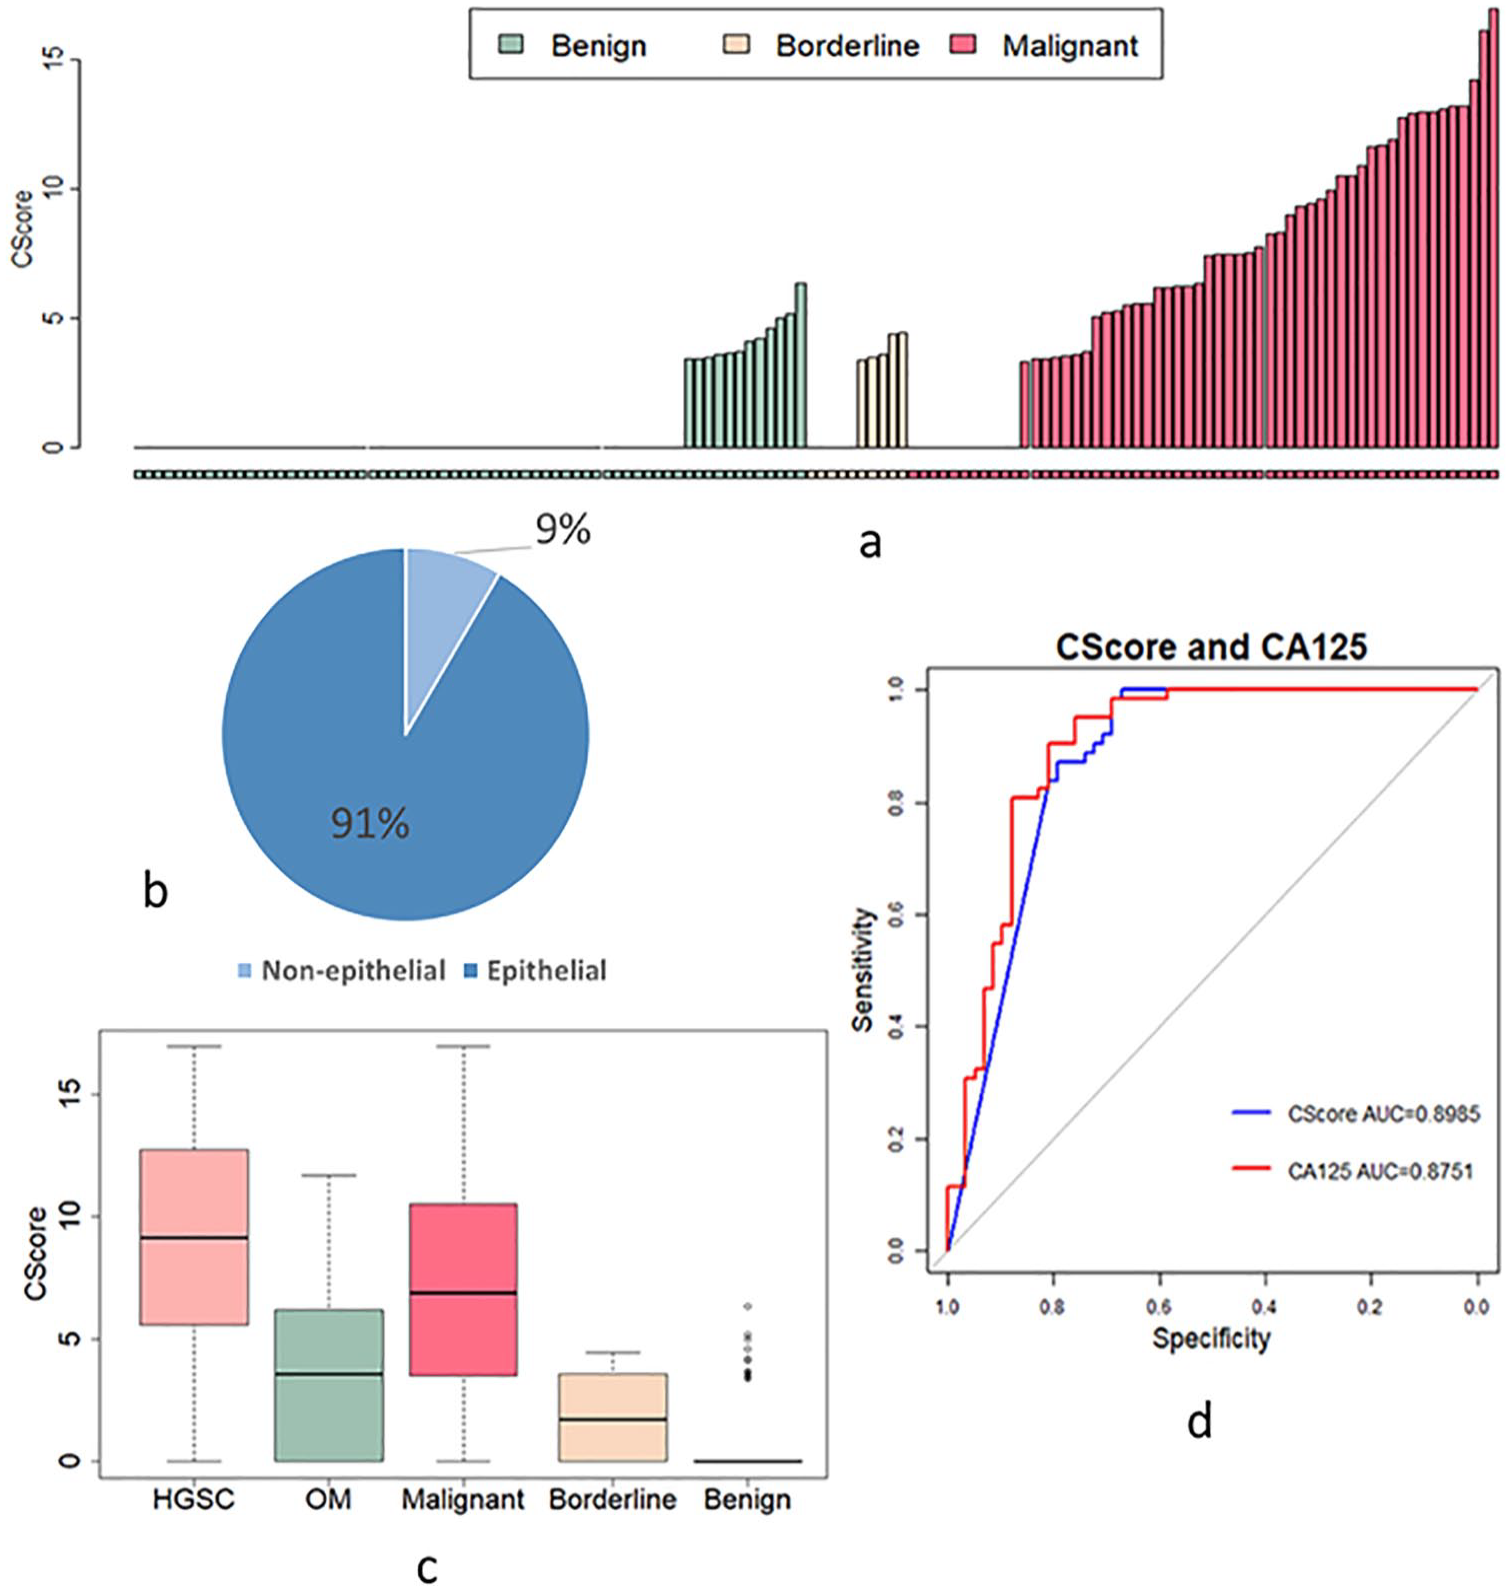
CScores of all samples. (a) CScore of the benign, borderline, and malignant samples. (b) Pie chart of ovarian cancer patients with positive CScore. (c) Box plot of CScores in patients with HGSC (median=9.15), other malignant (OM) subtypes (median=3.57), all malignant (median=6.87), benign (median=0) and borderline (median=1.69). d. ROC analysis was used for measuring sensitivity and specificity basing on serum cfDNA CScore (AUC=0.8985) and CA-125 (AUC=0.8751) from benign tumors and malignant cancer samples.
A two-layer decision tree to separate cancer from benign tumors
For patients with elevated serum CA-125 level (>= 35 U/mL) who might have malignancy, endometriosis, or other benign tumors, our results show cfDNA CNV score may help to further classify the patients with elevated CA-125. By inspecting the data, we found 23 patients with benign tumors that had elevated CA-125 values higher than the threshold of 35 U/mL. However, in terms of chromosome imbalances, 19 (82.6%) of which had a CScore of 0, showing superior specificity of CScore model. In addition, out of the seven malignant tumors with CA-125 values less than 35 U/mL, 3 (42.9%) had non-zero CScores (Supplemental Table 2). The results suggested that a hybrid model considering both CScore and CA-125 may achieve higher sensitivity and specificity. Similarly, all 58 samples of malignant cancer and 66 samples of benign tumor were then pooled and randomly divided into a training set and a validation set with a probability weights for obtaining the samples of 0.66 and 0.33, respectively. The Ovarian Cancer Decision Tree (OCDT) was generated based on the input data of CScore value and CA-125 value from the training set (Figure 4(a)). Using this hybrid model, we achieved an AUC of 0.9752, and a sensitivity and specificity of 0.960 and 0.952, respectively, when choosing a CScore threshold of 5.18 for the first level, and a CA-125 value of 103.1 for the second level. The performance of binary classification of OCDT, CScore, and CA-125 were tested in the validation set. As shown in Figure 4(b), OCDT outperformed the CScore model and CA-125 with an AUC of 0.9752. Positive prediction value, negative prediction value, positive likelihood ratio, and negative likelihood ratio of CA-125 were 0.86, 0.69, 2.52, and 0.19, respectively, while they were 0.96, 0.96, 24.91, and 0.04 for OCDT.
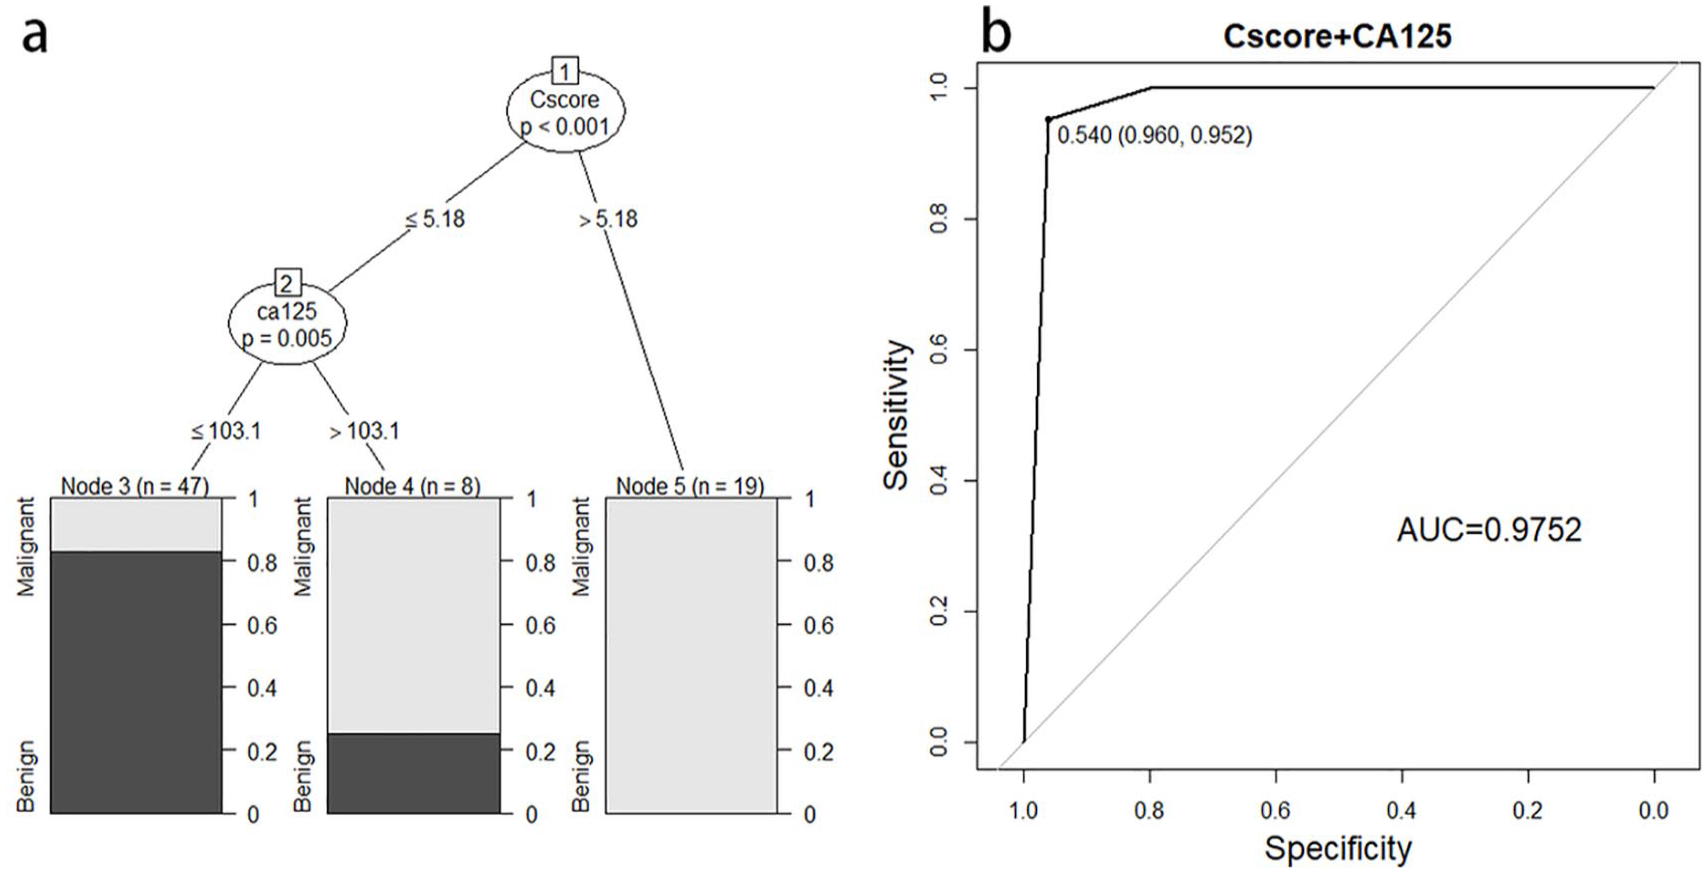
A decision tree model for sample classification. (a) The decision tree model (OCDT) generated from the training dataset for distinguishing malignant tumors from benign tumors. (b) The OCDT model performance in the validation dataset was analyzed by ROC analysis, AUC=0.9752.
Discussion
CA-125 is a widely used tumor marker in ovarian cancer 37 ; however, a high false positive rate and poor sensitivity at early stages limited its application to ovarian cancer diagnosis and screening.38,39 Despite HE4 being one of the most promising biomarkers, the role of this protein in ovarian cancer is yet to be fully established. 40 Recently, research has revealed that chromosomal imbalances are critical to cancer initiation, 41 which open up the possibility of the development of chromosomal imbalances as a biomarker for cancer detection.
Our CScore model consists of two components capturing arm-level aneuploidy originate from amplification and deletion of large-scale genomic regions, as well as imbalances of p- and q-arm of chromosomes. Compared to previous studies, our study had less bias related to sample collection, preparation, transportation, and sequencing process. Substantial evidence has been shown that chromosomal imbalances play an important role in tumor progression and prediction of poor clinical outcome. 42 Most cancer types possess tumor-specific patterns of chromosomal imbalances. 43 In this study, we first proposed using the p/q ratio metric to directly quantify the extend of whole chromosome imbalances in ovarian cancer. Overall, we found that the CScore value was positively correlated with ovarian tumor malignancy and was barely detectable in benign tumors. This finding potentially enables the CScore model to be applied in distinguishing malignant from benign ovarian tumors. On the other hand, we also revealed 103 cytobands with significant copy number gain or loss in ovarian cancer samples. We found seven chromosome arms gained that agreed with the study of Cohen et al., 24 who reported that 5q, 8p, 13q, and 15q were the most common losses in their study, which were also detected as lost in our study. The most common DNA losses were seen on chromosome arms 17q, 16q, 18q, 17p, 4q, which is different from the report of Cohen et al. 24 This may be due to the different tumor types of our study or the different number of patients. Previous studies illustrated that chromosomal imbalances were associated with oncogene copy alteration and affected the global transcriptional profile of cancer cells.44,45 Here, we analyzed oncogenes and tumor suppressors that were involved in the chromosomal imbalances in ovarian cancer. We found 59 oncogenes within the gain cytobands and 70 tumor suppressors within the loss cytobands. The oncogenes including TP63, SOX2, and CCNE1 are critical for ovarian carcinogenesis. Expression of TP63 is considered to be related to ovarian tumor transformation and development. 46 SOX2 is required for maintaining stemness of ovarian cancer cells and copy number amplification of SOX2 links to the poor survival rate of ovarian cancer patients.47,48 CCNE1 amplification is an early event during ovarian tumorigenesis and indicates poor survival. 49 As a well-known tumor suppressor, TP53 is one of the 70 tumor suppressors, and loss of TP53 is an important factor that initiates ovarian cancer and promotes ovarian cancer cell proliferation. 50 Hence, our finding provides another insight into the chromosomal imbalances in ovarian cancer.
Based on the capability of CScore model to distinguish malignant and benign ovarian tumors, we first considered using CScore value as a single biomarker to distinguish malignant and benign ovarian tumors; however, no significant superiority was found either in sensitivity or in specificity compared with CA-125 alone. Of the benign tumor patients with positive CA-125, 82.6% had a negative CScore. Seven patients with malignancies with the histology of granulosa tumor, mucinous adenocarcinoma, and clear cell carcinoma were detected negative CA-125. The pelvic mass patients with negative CA-125 would lead to wrong assessment of the tumor type before surgery. For these malignant patients with negative CA-125, we found that a CScore >0 predicts three of seven (42.9%) malignancies. The results indicated that cfDNA could be a useful tool to identify CA-125 negative ovarian cancer. Also, there is a need to combine CA-125 and cfDNA for increasing ovarian cancer diagnosis. Furthermore, we established a two-layer decision tree model that combined the CScore value with the CA-125 value to classify ovarian tumors. Using this hybrid model with a CScore threshold of 5.18 for the first level, and a CA-125 value of 103.1 for the second level, we achieved higher sensitivity and specificity.
Our results show that new technology, such as cfDNA sequencing, can be combined with conventional serum biomarkers as long as they are complimentary. This can be generalized as the synergistic effects since the multivariate hybrid model often captures abnormal signals at different levels, and big data analysis has great potential in the development of novel diagnostic tools. Using this diagnosis model, the doctor can make a more suitable decision before surgery. Future clinical trials need to be conducted to further evaluate the value of CScore in clinical settings and to search for the optimal threshold for malignancy detection. CA-125 is expressed in most high-grade serous ovarian cancers, but only in 60% of mucinous and clear-cell subtypes. Serous adenocarcinoma and endometrioid ovarian cancers are associated with higher serum HE4 concentrations. 13 In our future work, we will recruit more patients to further improve this model, and we propose a more optimized diagnostic model based on the results of serum HE4 and imaging combined with cfDNA and CA-125 to improve ovarian diagnosis performance and quality of life for patients with ovarian cancer.
Supplemental Material
sj-pdf-1-jbm-10.1177_1724600821992356 – Supplemental material for A novel decision tree model based on chromosome imbalances in cell-free DNA and CA-125 in the differential diagnosis of ovarian cancer
Supplemental material, sj-pdf-1-jbm-10.1177_1724600821992356 for A novel decision tree model based on chromosome imbalances in cell-free DNA and CA-125 in the differential diagnosis of ovarian cancer by Weina Zhang, Yu-min Zhang, Yuan Gao, Shengmiao Zhang, Weixin Chu, Guopeng Wei, Ke Li, Xuesong He, Long Chen, Li Guo, Shufang Luan and Ping Zhang in The International Journal of Biological Markers
Footnotes
Author contributions
Weina Zhang and Yu-Min Zhang contributed equally to this paper.
Declaration of conflicting interests
The author(s) declared no potential conflicts of interest with respect to the research, authorship, and/or publication of this article.
Funding
The author(s) disclosed receipt of the following financial support for the research, authorship, and/or publication of this article: This work was supported by Medical Science and Technology Development Plan of Shandong Province (Grant No.2017WS308) and Qingdao Outstanding Health Professional Development Fund.
Supplemental material
Supplemental material for this article is available online.
References
Supplementary Material
Please find the following supplemental material available below.
For Open Access articles published under a Creative Commons License, all supplemental material carries the same license as the article it is associated with.
For non-Open Access articles published, all supplemental material carries a non-exclusive license, and permission requests for re-use of supplemental material or any part of supplemental material shall be sent directly to the copyright owner as specified in the copyright notice associated with the article.