
Abstract
Background:
Circulating tumor cells and serum tumor markers have been found significant in predicting outcome for several malignancies. However, their role in gastric cancer is not fully clarified. We conducted a retrospective study to explore the prognostic value of circulating tumor cells and their applicability in assessing the treatment efficacy in gastric cancers.
Methods:
From September 2015 to December 2018, 116 patients with newly pathologically diagnosed gastric adenocarcinoma were enrolled. At both baseline and two courses after chemotherapy, the data of circulating tumor cells and serum tumor markers, such as CEA, CA72-4, CA19-9, CA50, and CA242, were collected. The relationships between the change trend of circulating tumor cells and the treatment efficacy were analyzed after chemotherapy, with a paired t-test. Univariate and multivariable analysis were used to find prognostic factors for overall survival (OS).
Results:
We found there is a significant difference between the circulating tumor cells-positive and circulating tumor cells-negative before and after therapy (mOS 12.6 vs. 31.6 months, P<0.001; mOS 12.4 vs. 24.2 months, P=0.002), respectively. Also, differentiation, pre-therapeutic circulating tumor cells and therapeutic response were independent predictors of overall survival. Following two courses of chemotherapy, the number of circulating tumor cells increased obviously in the progressive disease group (P=0.002), while they decreased in the non-progressive disease group (P=0.02). Thus, the change in the circulating tumor cells count had a close association with the therapeutic response (P=0.004).
Conclusion:
Generally, circulating tumor cells provide a novel tool to evaluate the outcomes of gastric cancer patients. Since the change of circulating tumor cells was highly related to treatment response, it may be an auxiliary to assess the effect of chemotherapy, leading an earlier adjustment of following regimens.
Introduction
Gastric cancer is the fifth most commonly diagnosed cancer worldwide and the third leading cause of cancer deaths. 1 It is one of the most prevalent cancers in China, with 410,400 new gastric cancer cases and 293,800 cancer-related deaths estimated in 2014. 2 Although the past years have witnessed some steady decreases in the incidence and mortality rate due to anti-HP antibody use and nutrition improvement, it still remains a serious problem to both China and the world. 3 It is of great importance to identify early prognostic markers for gastric cancer.
Circulating tumor cells (CTCs) are small fractions of tumor cells that enter the bloodstream from primary tumor sites and may cause distant metastasis. CTCs have a potential impact on guiding clinical treatment and evaluating therapeutic effect. 4 Other theories have discovered that serum tumor markers such as CEA, carbohydrate antigen (CA)72-4, CA19-9, CA50, and CA242 had a clinical significance in improving sensitivity for early diagnosis and predicting the outcome of patients with pancreatic cancer, lung cancer, and breast cancer.5-7
However, there are few studies targeting the combination of CTC, tumor markers, clinicopathological characteristics, and therapeutic response among patients with gastric adenocarcinoma. In our study, all of the above were collected in 116 patients with newly pathologically diagnosed gastric adenocarcinoma.
Materials and methods
Patients and clinicopathological information
Patients with newly diagnosed gastric adenocarcinoma were enrolled in Nanjing First Hospital between September 2015 and December 2018. The inclusion criteria were: (a) ⩾18 years; (b) evidence for the diagnosis was provided by pathological and radiological examination; (c) no prior history of other malignancies; and (d) never received any prior treatment for advanced/metastatic disease before the study. Patients were evaluated in the light of the American Joint Committee on Cancer (AJCC) 2016 criteria. 8 Clinicopathological features including gender; age; differentiation; tumor node metastasis stage; metastasis; receiving surgery or not; CTC counts before and after chemotherapy; efficacy assessment; and tumor markers, such as CEA (carcinoembryonic antigen), CA72-4, CA50, CA19-9, and CA242 were recorded. Specimens were collected twice—before and after chemotherapy—to analyze CTCs enumeration and tumor marker levels. Treatment after enrollment was reviewed. Test results were not submitted to physicians; therefore they have no impact on further treatment. All patients signed written informed consent. The study was approved by the Ethics Committee of Nanjing First Hospital in adherence with the principles of the Declaration of Helsinki.
Sample collection and CTC enumeration
CTC enrichment was performed in accordance with a previously published protocol, 9 sing Human White Blood Cell Depletion Kit and Fluorescence In Situ Hybridization Sample Treatment Kit (Cyttel Biosciences, Jiangsu, China). The day before chemotherapy (at baseline), and 1 week after completion of chemotherapy (at the first evaluation) 3.2 mL peripheral blood was drawn from subjects. Samples were subjected to fluorescence in situ hybridization (FISH) with centromere probe (CEP) 8+17 (orange+green) (Cyttel) using an ALLSHENG® FISH Hybridization System (ALLSHENG TDH-500). CD45, DAPI, and CEP8 staining data were combined to identify CTCs. Leukocytes were stained with DAPI+/CD45+, while CTCs shown as DAPI+/CD45−/Chromosome multiploidy (CEP 8+ and/or CEP17+) (Figure S1).
Therapeutic response
Patients were treated according to the NCCN guidelines. 10 Computed tomography scans were obtained for tumor response assessment. Therapeutic response was independently evaluated by Response Evaluation Criteria in Solid Tumor (RECIST, version 1.1). 11
Statistical analysis
We stratified CTC counts into two layers, >3 CTCs (CTC-positive) and ⩽ 3 CTCs (CTC-negative), in consistency with median CTC counts at baseline. The cut-off of CEA, CA72-4, CA50, CA19-9, and CA242 was 5 ng/mL, 6.9 U/mL, 20U/mL, 27U/mL, 20U/mL, respectively, according to the manufacturer’s recommendation. The correlations between the CTCs and tumor markers as well as clinicopathological features were calculated by the Chi-square test and Pearson’s test.
The primary endpoint of the study was overall survival (OS), which was defined as the time from first blood draw to the date of death or the last follow-up if the patient was censored. Kaplan–Meier survival plots for OS were based on CTCs count, tumor markers, treatment response and clinicopathological features, compared by Log-rank tests. Statistically significant parameters in the univariate analysis were added to the multivariate analysis. All analysis was calculated using the SPSS version 22.0 (IBM, Armonk, NY, USA) with two-sided P-value. P < 0.05 was considered statistically significant.
Results
Patient characteristics
A total of 116 patients were recruited in the study. The data of initial blood draw was considered as the baseline. There were 89 (76.7%) males and 27 (23.3%) females. Their ages ranged from 36 to 88 (median 64). A total of 63 (54.3%) patients had poor differentiated tumors, and 72 (62.1%) patients had metastasis. The number of patients with stage I, II, III, and IV gastric adenocarcinoma was 8, 16, 48, and 44, respectively. During the study, 59 (50.9%) patients received chemotherapy only, while others received both surgery and chemotherapy (Table 1). By the end of the study, 61 (52.6%) patients had passed. The median follow-up time was 14.5 months, and the median OS was 23.5 months (95% CI 16.9, 30.1 months).
Correlation of CTC, clinical features and tumor markers at baseline before chemotherapy.
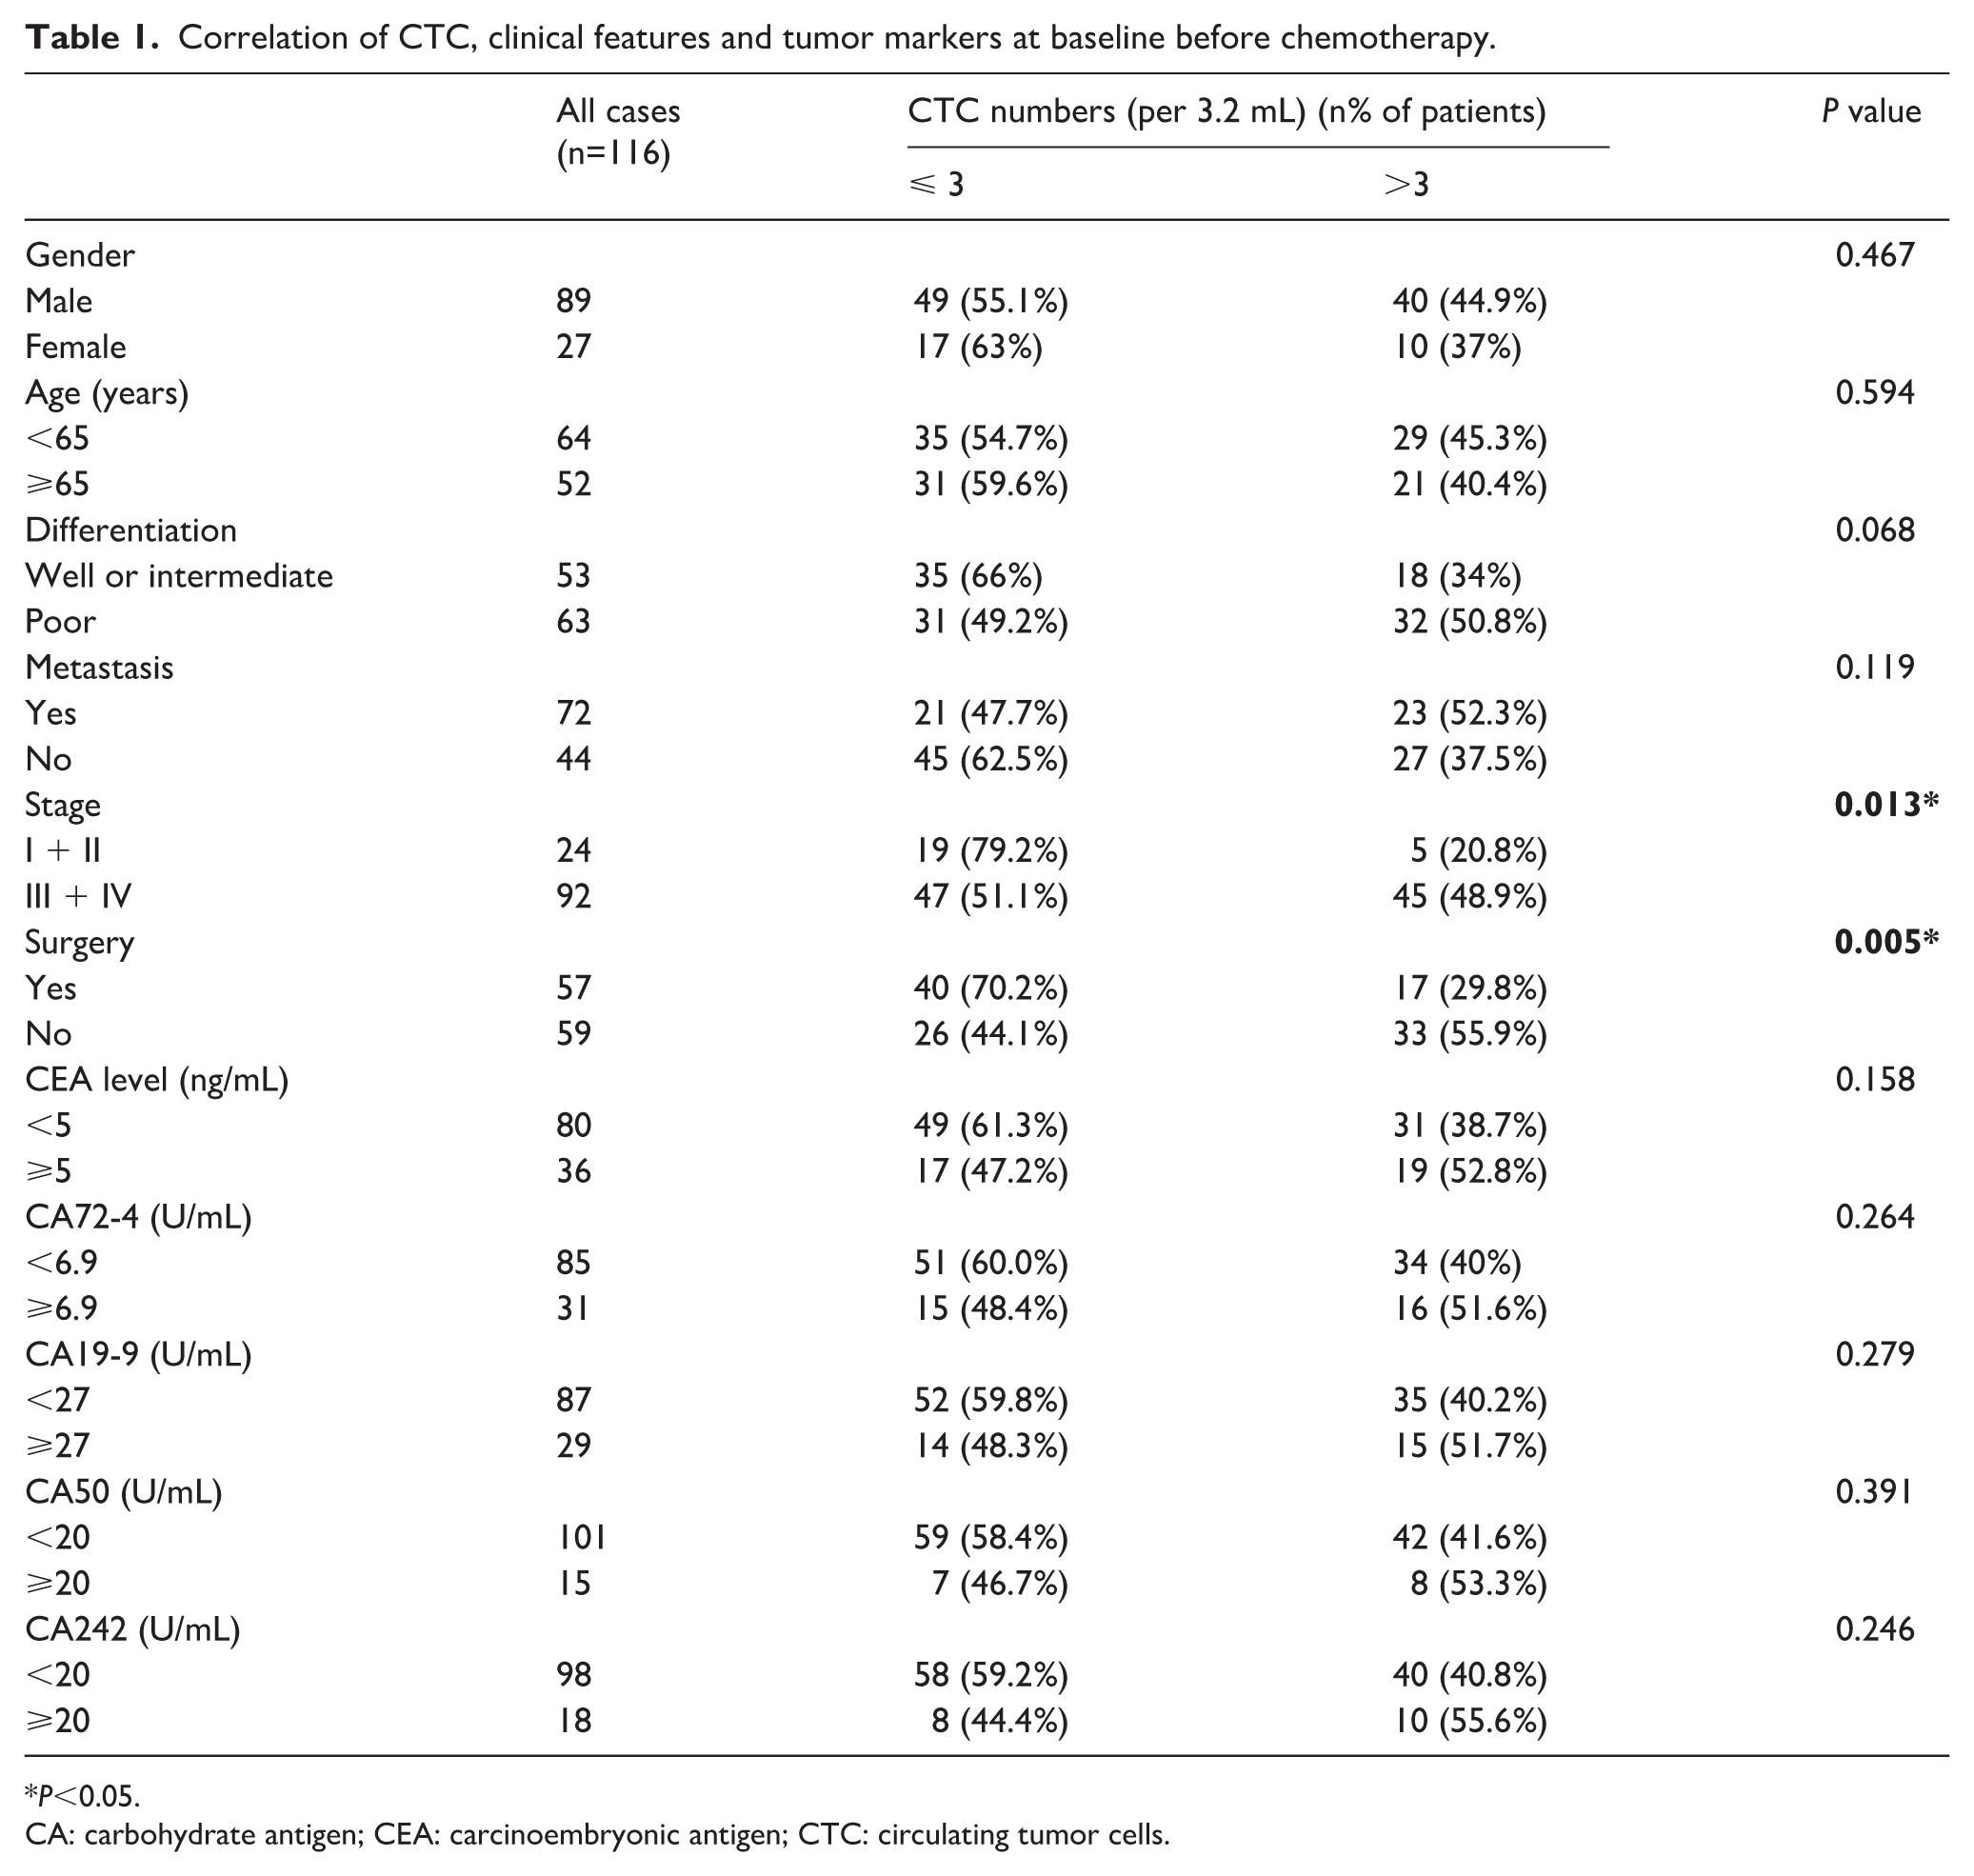
P<0.05.
CA: carbohydrate antigen; CEA: carcinoembryonic antigen; CTC: circulating tumor cells.
CTC counts and its correlation with clinicopathological characteristics
CTC counts over 3/3.2 mL are considered CTC positive while the opposite are CTC negative in the light of the median number of CTCs at baseline. The CTC positivity rate was 56.9% (66/116), ranging from 2 to 42 CTCs (median number, 3/3.2 mL). As demonstrated in Table 1, CTC counts correlated highly with stage (P=0.013) and whether receiving surgery (P=0.005). After chemotherapy, CTCs enumeration ranged from 0 to 19 per 3.2 mL (median number, 2/3.2 mL). Differentiation (P=0.019), metastasis (P=0.037), and tumor stage (P=0.018) were significantly correlated with CTCs (Table 2).
Correlation of CTC, clinical features, and tumor markers after two courses of chemotherapy.
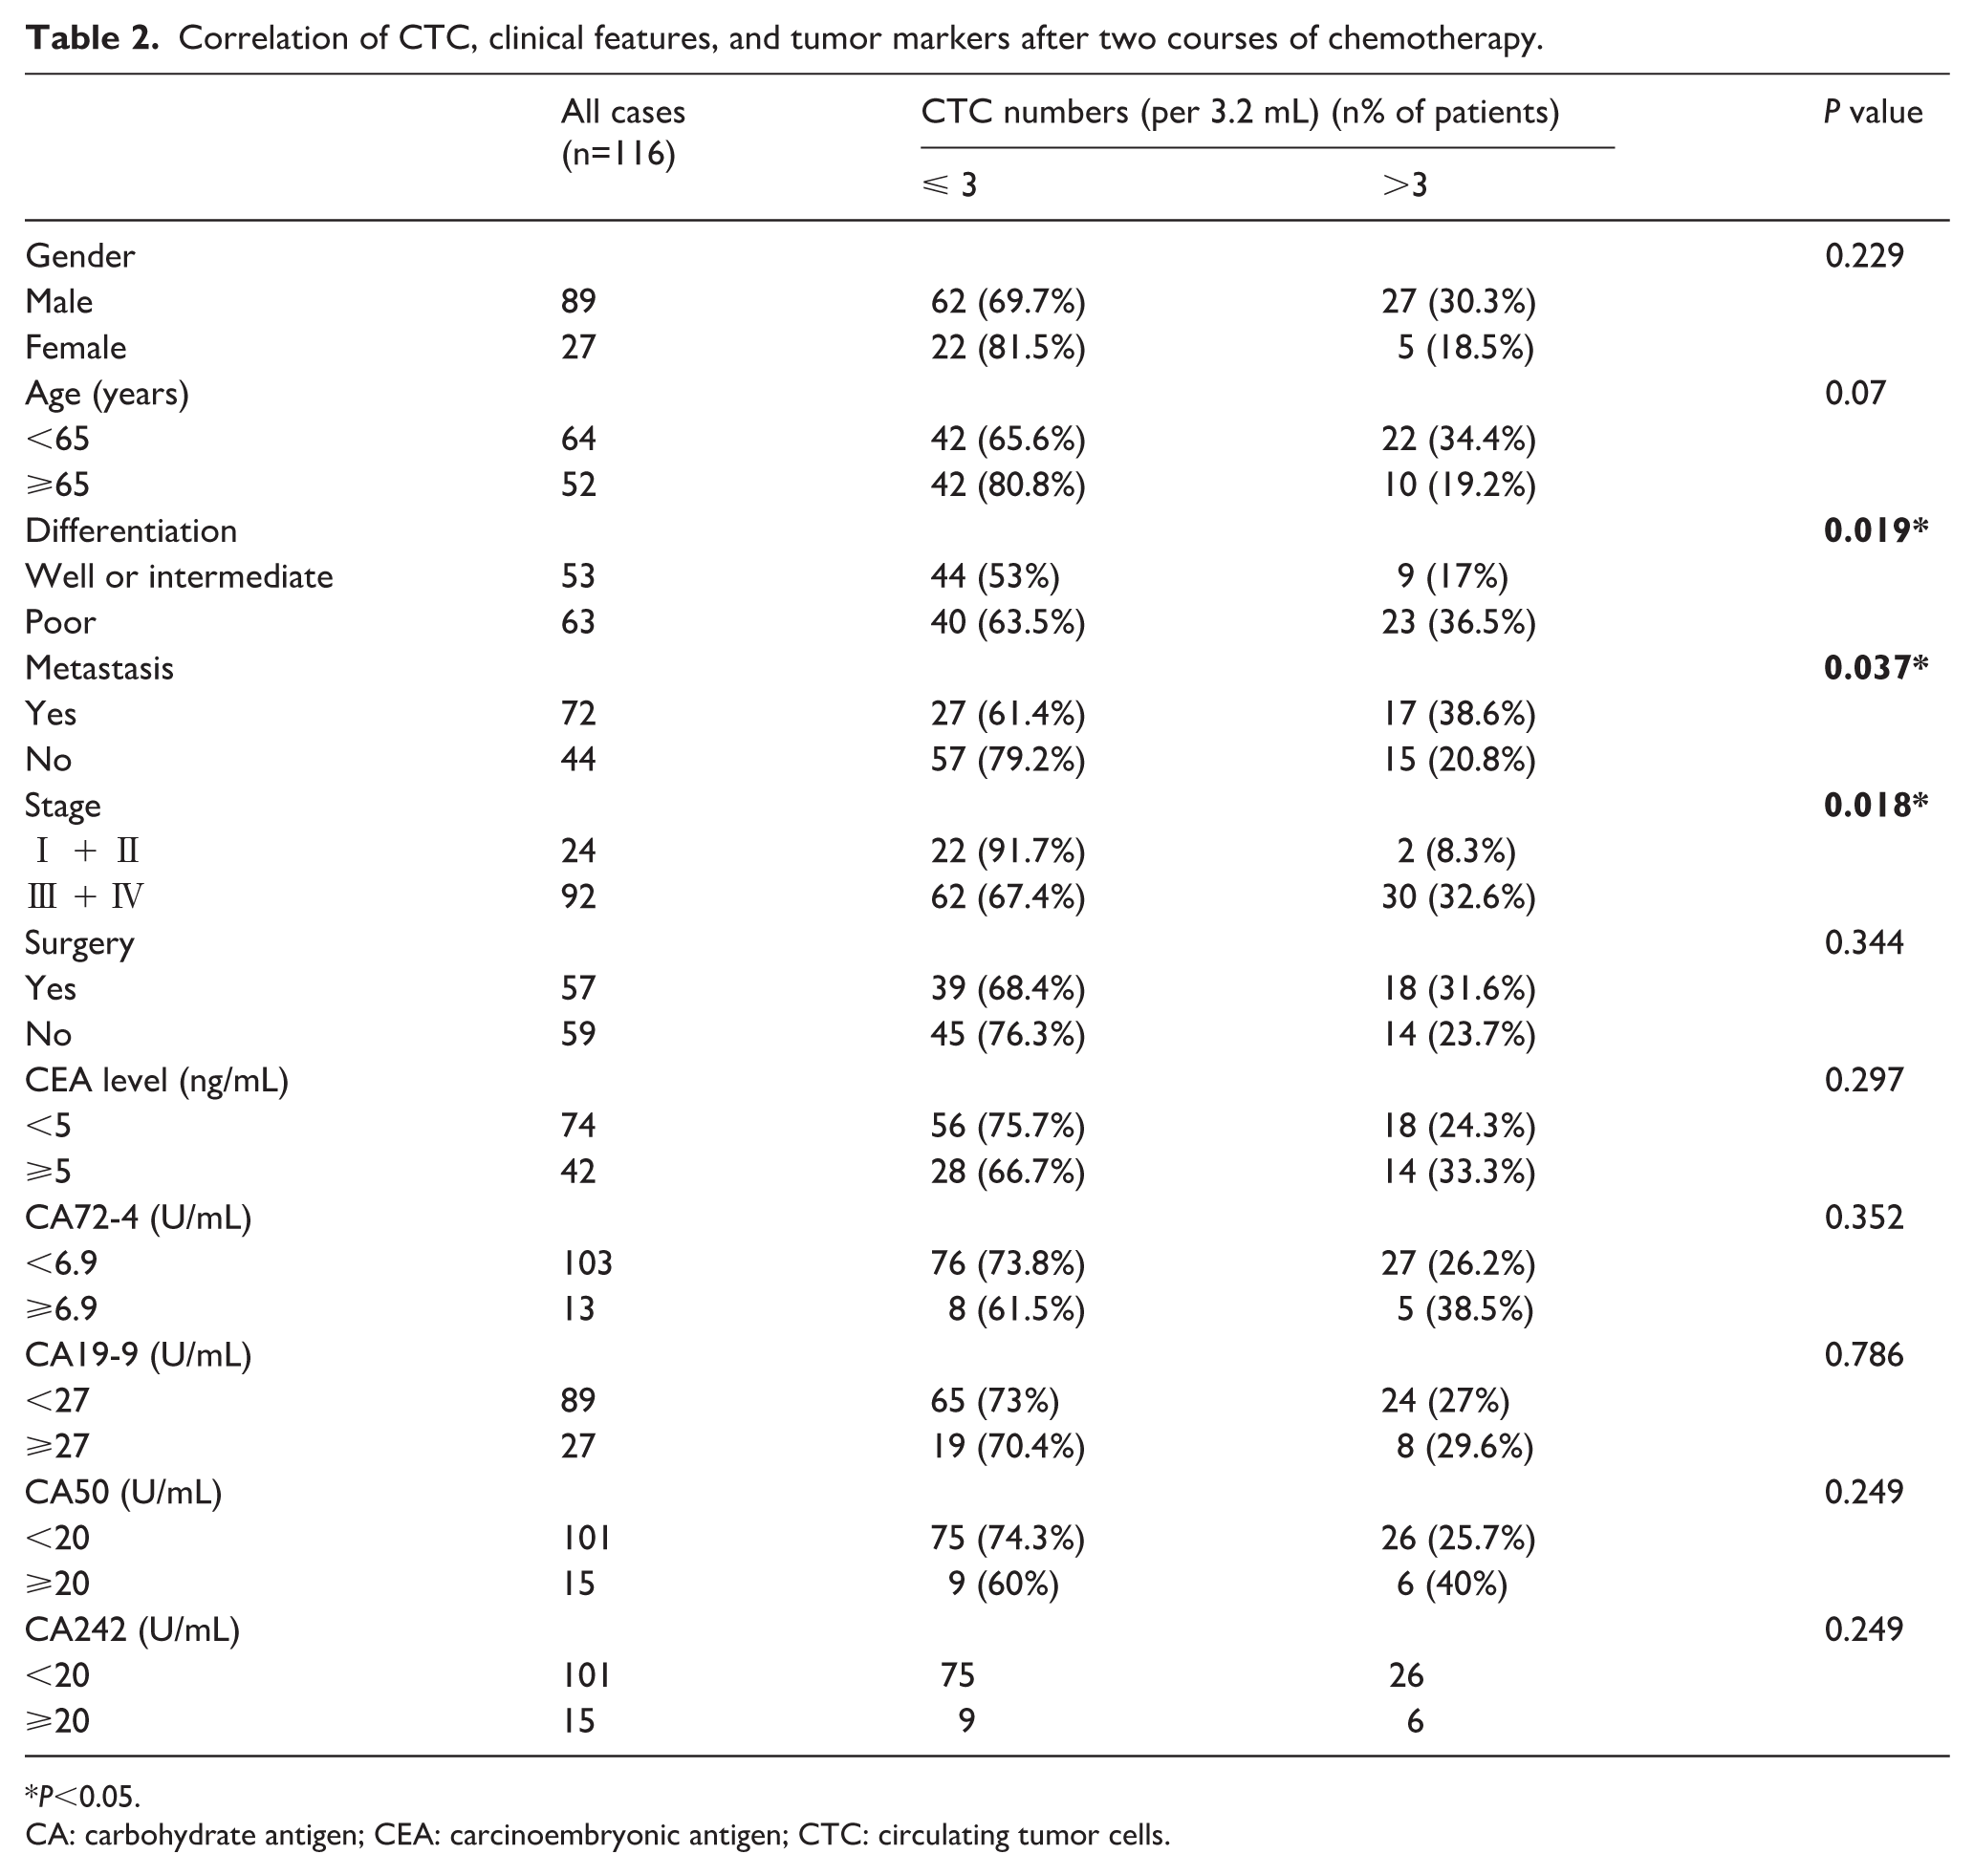
P<0.05.
CA: carbohydrate antigen; CEA: carcinoembryonic antigen; CTC: circulating tumor cells.
The use of CTCs, serum tumor markers and clinical features to predict OS
In regard to Kaplan–Meier curves for OS in clinical features, significant parameters were shown in Supplementary Figure 2. Poor differentiation had a shorter mOS (11.8 vs. 42.7 months, P<0.001) (Figure S2(a)). Patients with metastasis had an inferior mOS (10.7 vs. 34.1 months, P<0.001) (Figure S2(b)). The mOS of advanced gastric adenocarcinoma (stage Ⅲ and Ⅳ) was inferior to the early stage (18.7 vs. 45.7 months, P=0.001) (Figure S2(c)).
We discovered that patients classified as CTC-negative had a significantly longer mOS (31.6 months, 95% CI 19.2, 43.9) than the CTC-positive (12.4 months, 95% CI 9.9, 14.9) (P<0.001) (Figure 1(a)). Moreover, mOS of patients whose CEA ⩾ 5 ng/mL at baseline was significantly shorter (12.3 months, 95% CI 8.6, 16.0) than those CEA <5 ng/mL (31.6 months, 95% CI 17.8, 45.4) (P=0.002) (Figure 1(b)).The mOS of patients with CA19-9 ⩾ 27ng/mL had a shorter mOS (15.7 months, 95% CI 9.3, 22.1) than the others (28.2 months, 95% CI 18.8, 37.6) (P=0.039) (Figure 1(c)). The mOS of patients with CA72-4 ⩾ 6.9 U/mL (12.8 months, 95% CI 9.1, 16.5) was significantly shorter than those with CA72-4 < 6.9 U/mL (31.6 months, 95% CI 18.1, 45.1) (P=0.001) (Figure 1(d)). And similarly, patients with CA242 ⩾ 20 U/mL had a shorter mOS (12.8 months, 95% CI 5.3, 20.3) than those CA242 < 20 U/mL (26.8 months, 95% CI 18.6, 35.0) (P=0.021) (Figure 1(e)). The mOS of CA50 ⩾ 20 U/mL (14.8 months, 95% CI 8.1, 21.5) tend to have an inferior mOS than the rest (26.8 months, 95% CI 18.9, 34.7) (P=0.033) (Figure 1(f). No significant differences were observed in gender, age, and whether or not the patients received surgery.
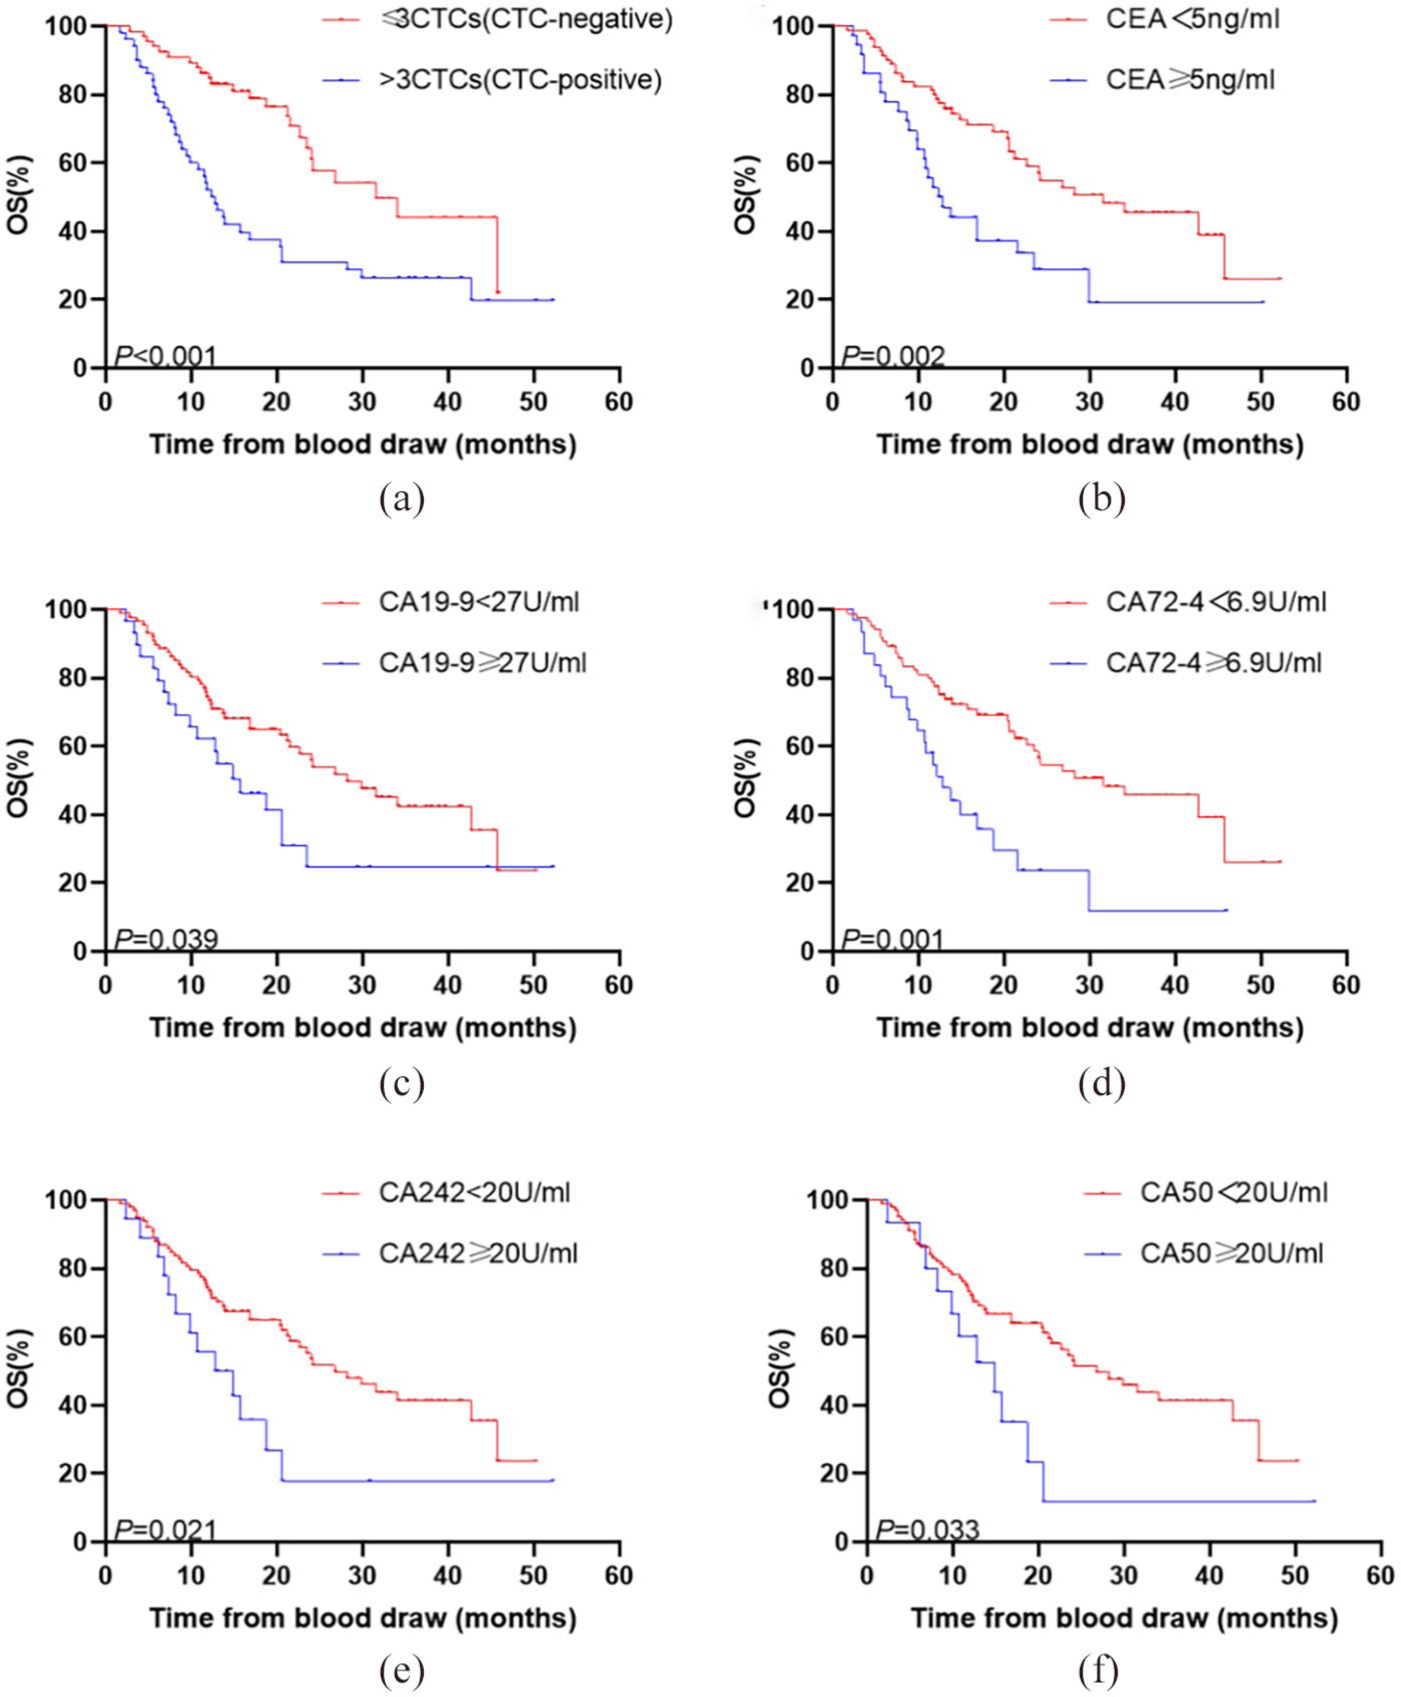
Kaplan–Meier curves for OS in patients with significant parameters at baseline. (a) Kaplan–Meier curves for patients with CTC-negative or CTC-positive. (b) Kaplan–Meier curves for patients with CEA <5 ng/mL or CEA ⩾5 ng/mL. (c) Kaplan–Meier curves for patients with CA19-9 < 27 U/mL or CA19-9 ⩾ 27 U/mL. (d) Kaplan–Meier curves for patients with CA72-4<6.9 U/mL or CA72-4 ⩾ 6.9 U/mL. (e) Kaplan–Meier curves for patients with CA242<20 U/mL or CA242⩾20 U/mL. (f) Kaplan–Meier curves for patients with CA50<20 U/mL or CA50⩾20 U/mL.
After two courses of chemotherapy, CTC-positive patients were found to have an inferior mOS (12.4 months, 95% CI 3.8, 21.0) than the opposite ones (26.8 months, 95% CI 10.0, 43.6) (P=0.002) (Figure 2(a)). Besides, the mOS of patients whose CEA ⩾ 5 ng/mL was significantly shorter (13.7 months, 95% CI 2.5, 24.9) than those CEA < 5 ng/mL (28.2 months, 95% CI 17.0, 39.4) (P=0.022) (Figure 2(b)). Patients with CA19-9 ⩾ 27 U/mL had a shorter mOS significantly (15.7 months, 95% CI 5.3, 26.1), compared with those CA19-9 < 27 U/mL (29.9 months, 95% CI 19.0, 40.8) (P=0.004) (Figure 2(c)). Similarly, patients with CA72-4 ⩾ 6.9 U/mL (9.8 months, 95% CI 2.9, 16.7) had an inferior mOS than the others (24.2 months, 95% CI 16.1, 32.3) (P = 0.003) (Figure 2(d)). We also found that patients with CA242 ⩾ 20 U/mL had a shorter lifetime (9.8 months, 95% CI 5.5, 14.1) than CA242 < 20 U/mL (26.8 months, 95% CI 18.6, 35.0) (P<0.001) (Figure 2(e)). Furthermore, the mOS of CA50 ⩾ 20 U/mL tended to be longer (9.8 months, 95% CI 4.9, 14.7) than CA50 < 20 U/mL, significantly (26.8 months, 95% CI 18.7, 35.0) (P=0.007) (Figure 2(f)). For clinical response assessment, the patients evaluated as non-progressive disease (PD) had a longer mOS (31.6 months, 95% CI 17.9-45.3) than those with progressive disease (7.3 months, 95% CI 3.8, 10.8) (P<0.001) (Figure 2(g)).
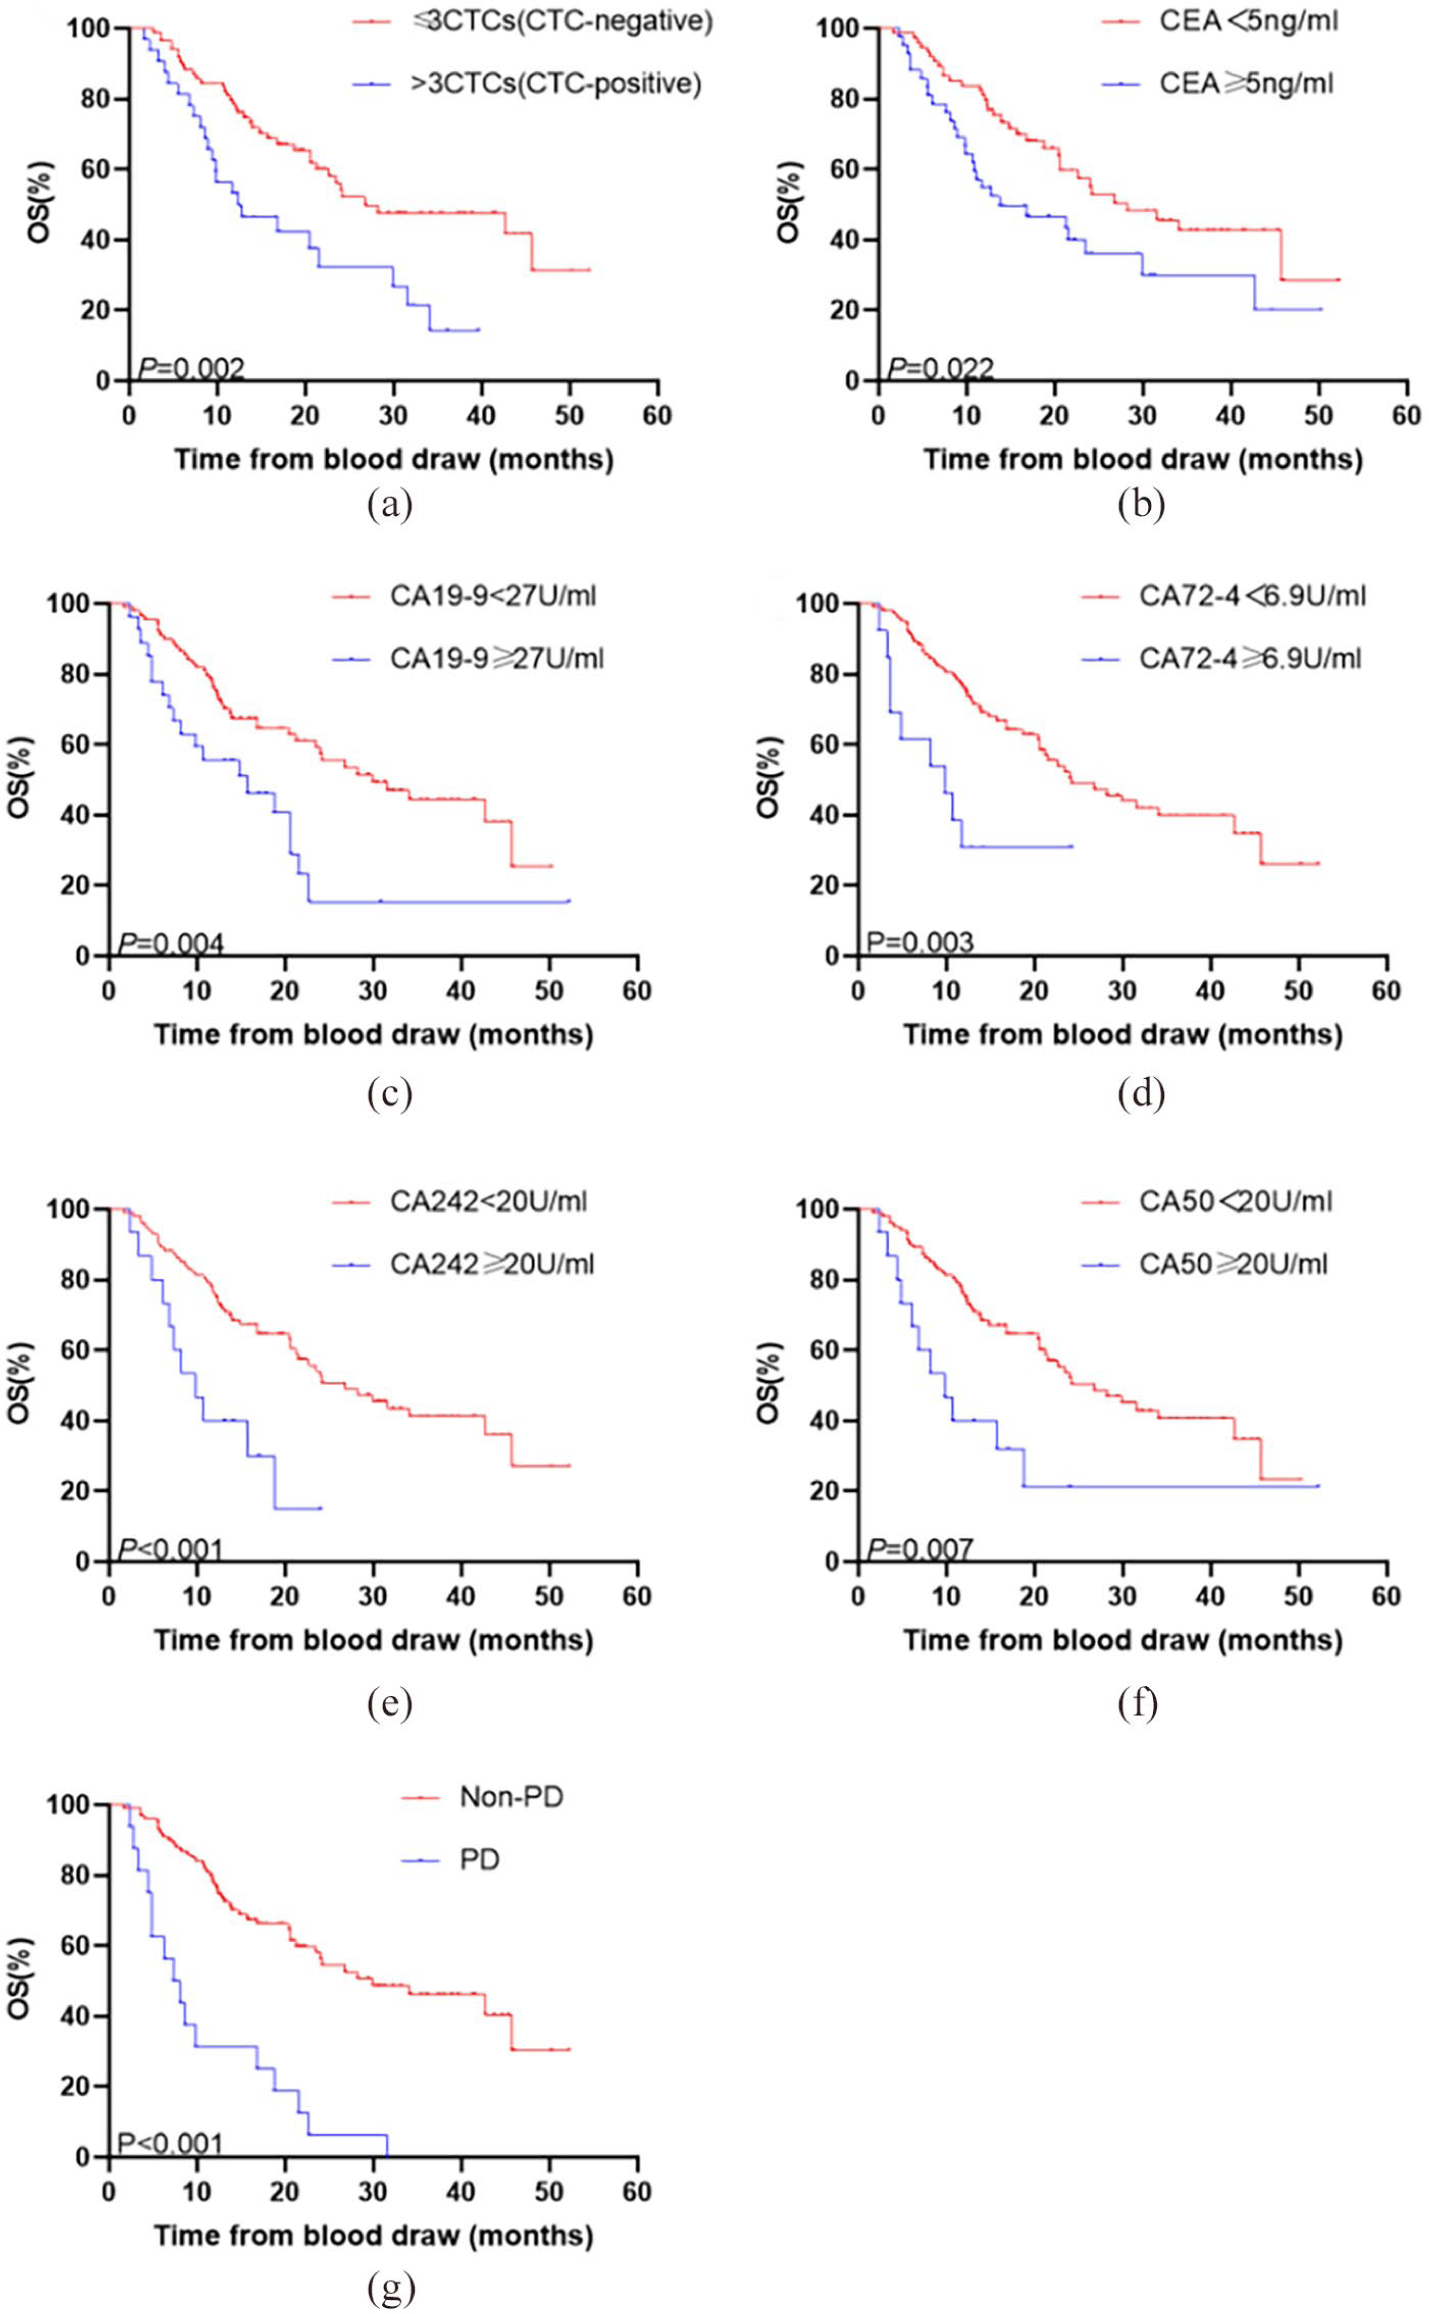
Kaplan–Meier curves for OS in patients with significant parameters after two courses of chemotherapy. (a) Kaplan–Meier curves for patients with CTC-negative or CTC-positive. (b) Kaplan-Meier curves for patients with CEA<5 U/mL or CEA⩾5 U/mL. (c) Kaplan–Meier curves for patients with CA19-9<27 U/mL or CA19-9⩾27 U/mL. (d) Kaplan–Meier curves for patients with CA72-4<6.9 U/mL or CA72-4⩾6.9 U/mL. (e) Kaplan–Meier curves for patients with CA242<20 U/mL or CA242⩾20 U/mL. (f) Kaplan–Meier curves for patients with CA50<20 U/mL or CA50⩾20 U/mL. (g) Kaplan–Meier curves for patients with progressive disease or without progress.
Our multivariate analysis showed that differentiation, pre-therapeutic CTCs and therapeutic response were effective in predicting OS (Supplemental Table). Apart from differentiation, after adjustment for clinically significant parameters, pre-therapeutic CTCs and therapeutic response were independent predictors of OS (hazard ratio (HR) 2.518, 95% CI 1.389, 4.564, P = 0.002), (HR 3.128, 95% CI 1.397, 7.002, P = 0.006), respectively.
The correlation between the change of CTCs after therapy and treatment efficacy
At last, we analyzed the relationship between the change trend of CTCs after chemotherapy and treatment efficacy. In the PD group, the number of CTCs increased evidently after chemotherapy (P=0.002), while it decreased in the non-PD group (P=0.02) (Figure 3(a) and (b)). With the Chi-square test and Pearson’s test, the close interrelation was verified again (P=0.004) (Figure 3(c)). To clarify, monitoring the change of CTCs may be a promising index to evaluate therapeutic effect.
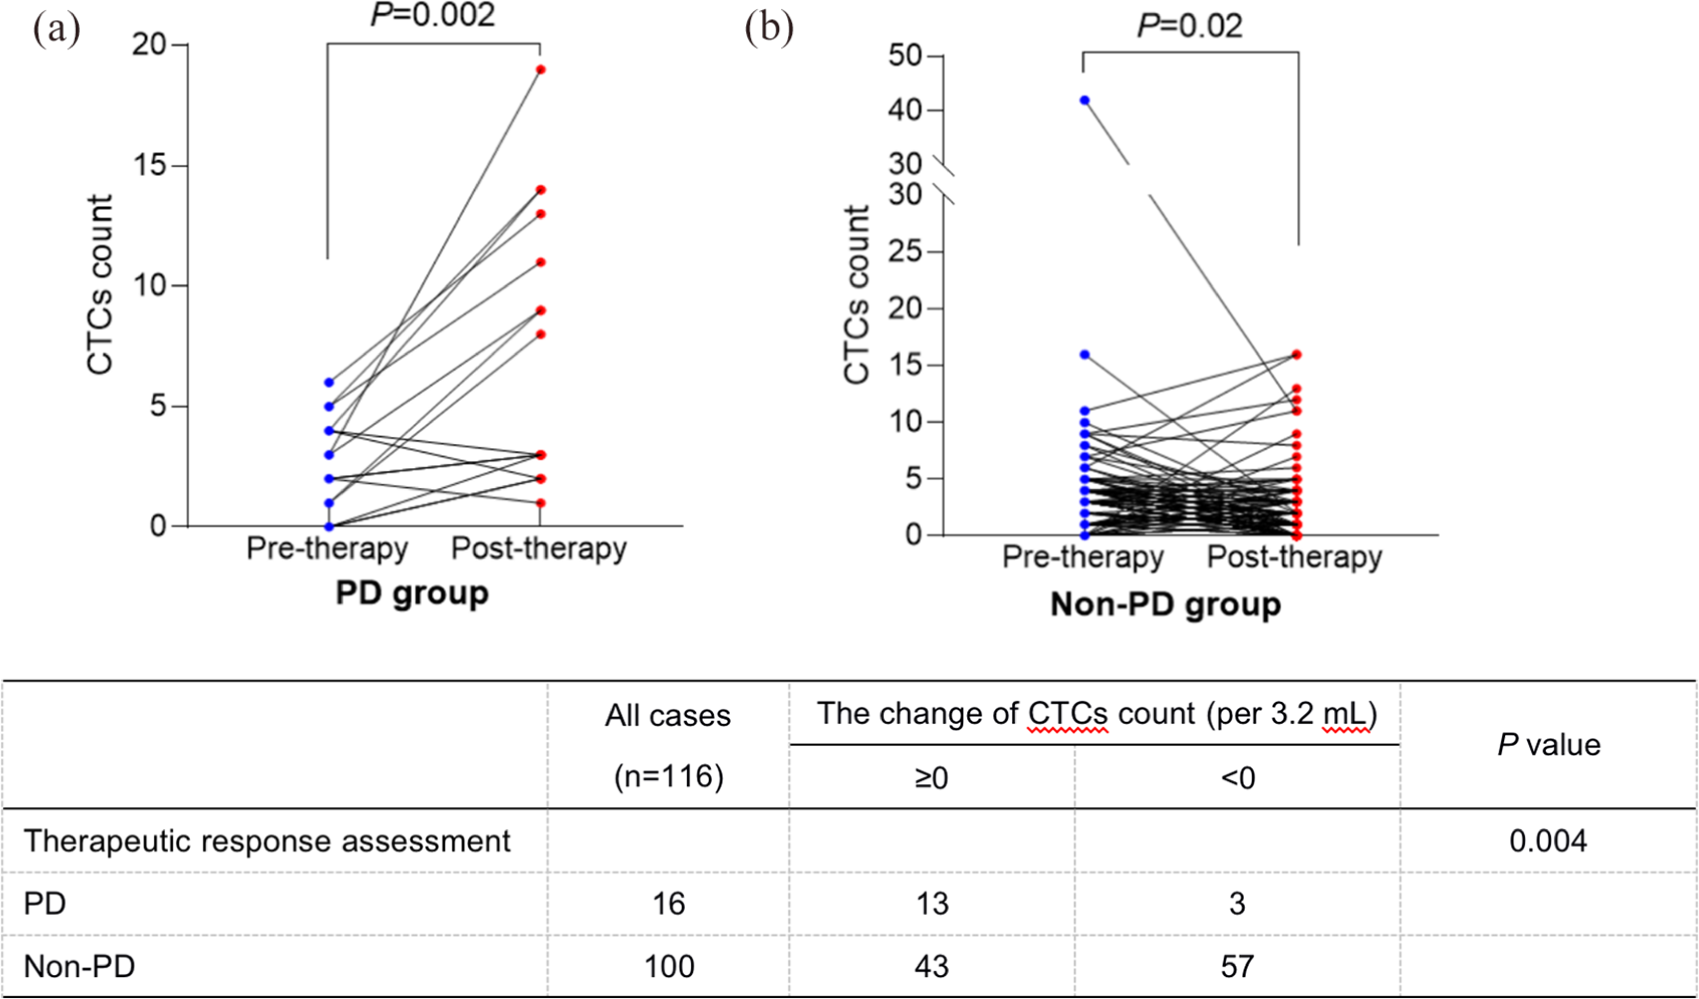
The correlation between the change of CTCs after therapy and treatment response.
Discussion
Gastric cancer has been a great burden to China due to its high incidence and mortality rate. It is necessary to determine the prognosis and survival of patients as early as possible. Although CTCs are beneficial for monitoring treatment response and prognosis in breast cancer, prostate cancer, and colorectal cancer,12-14 evidence for its role in the prognosis of gastric adenocarcinoma is limited. CTC-positive patients were observed to have a worse survival rate in pancreatic cancer and lung cancer.15,16 Our findings also indicate a significant prognostic value of CTC enumeration, which is in consistence with results of previous studies. Moreover, our study suggested that therapeutic response assessment was an independent predictor of OS. Further large-scale clinical trials are needed to confirm this. Some studies reported that monitoring the number of CTCs may be more useful for evaluating chemotherapy.17,18 The analysis revealed that patients with decreased CTC numbers after chemotherapy may have a favorable treatment response. This means that detecting the change of CTCs may provide an alternative method to evaluate the therapeutic effect, instead of referring to computed tomography/magnetic resonance imaging, which take more risks from radiation and have an economic burden. Also, on the basis of our results, clinicians could adjust the following therapy regimen according to the change of CTCs earlier and conveniently.
Serum tumor markers could be potentially used for early diagnosis and the prediction of therapeutic approaches. The combination of CA72-4, CA242, CA19-9, and CEA improves the sensitivity for the diagnosis and prognosis of gastric cancer.19,20 Serum CA72-4 is a predictive factor for tumor response and positively impacts the prediction of prognosis or early detection of gastric cancer.21,22 We have discovered that the levels of CEA, CA72-4, CA19-9, CA242, and CA50, no matter whether at baseline or after chemotherapy, are associated with OS in gastric adenocarcinoma. Favorable tumor markers attribute to a good prognosis. Therefore, tumor markers are essential elements for predicting the outcome of gastric cancer.
There is still a lot to do in further investigations. Most of our evidence is based on rather small cohorts in a single institution; therefore, the study of large cohorts in multi-centers is particularly required to account for the comparably small number of events. More effort is required to explore the practical impact of CTC enumeration on chemotherapy regimen optimization.
In summary, we have provided evidence that the combination of the two time points of baseline and after chemotherapy could help discriminate between prognoses. Also, the effect of chemotherapy for patients with gastric adenocarcinoma can be determined earlier according to the change in CTC counts before and after chemotherapy. While importance should be attached to the increase of CTCs with prior regimen, another chemotherapy regimen needs to be considered with further accurate clinical response assessment.
Supplemental Material
sj-pdf-1-jbm-10.1177_1724600820981972 – Supplemental material for Circulating tumor cells: A surrogate to predict the effect of treatment and overall survival in gastric adenocarcinoma
Supplemental material, sj-pdf-1-jbm-10.1177_1724600820981972 for Circulating tumor cells: A surrogate to predict the effect of treatment and overall survival in gastric adenocarcinoma by Yinxing Zhu, Nan Chen, Manman Chen, Xiaowen Cui, Han Yang, Xuedan Zhu, Jiali Dai, Yang Gong, Dongying Gu, Xinying Huo, Huanhuan Huang and Cuiju Tang in The International Journal of Biological Markers
Footnotes
Author contributions
Yinxing Zhu, Nan Chen, and Manman Chen contributed equally to this work as first co-authors.
Declaration of conflicting interests
The author(s) declared no potential conflicts of interest with respect to the research, authorship, and/or publication of this article.
Funding
The author(s) disclosed receipt of the following financial support for the research, authorship, and/or publication of this article: This work was supported by the National Key Research and Development Program of China (No. 2017YFC 1308900).
Supplemental material
Supplemental material for this article is available online.
References
Supplementary Material
Please find the following supplemental material available below.
For Open Access articles published under a Creative Commons License, all supplemental material carries the same license as the article it is associated with.
For non-Open Access articles published, all supplemental material carries a non-exclusive license, and permission requests for re-use of supplemental material or any part of supplemental material shall be sent directly to the copyright owner as specified in the copyright notice associated with the article.