
Abstract
Background:
A well-known transcriptional regulator of the proto-oncogene c-Myc, far-upstream element (FUSE) binding protein 1 (FUBP1) has been demonstrated by previous work to be aberrantly expressed in lots of cancers and plays a critical role in tumor progression; however, its expression and function in tongue squamous cell carcinoma (TSCC) remains unclear.
Methods:
Evaluations with immunohistochemistry, quantitative real-time polymerase chain reaction (qRT-PCR) and Western blot were performed to assess FUBP1 expression. The correlations of FUBP1 expression levels with various clinicopathological factors were evaluated with univariate and multivariate analyses. In addition, the role of FUBP1 in TSCC proliferation was studied in TSCC cells by silencing FUBP1. The role of FUBP1 on proliferation and apoptosis was confirmed by cell counting Kit-8, colony formation, cell cycle, and cell apoptosis assays.
Results:
Immunohistochemistry, qRT-PCR and Western blot results showed FUBP1 expression was higher in TSCC tissues in comparison with adjacent non-cancerous tissues (P <0.05), as well as in patients with advanced-stage disease or cervical lymph node metastasis (P<0.001). The 5-year survival rate was significantly lower in the group with high FUBP1 expression than in that with low FUBP1 expression (P=0.035). FUBP1 expression was also an independent predictor for overall survival in TSCC patients, and was closely related to poor prognosis. FUBP1 knockdown inhibited cancer cell proliferation, and induced cell cycle arrest and apoptosis.
Conclusion:
FUBP1 was overexpressed in TSCC, and correlated with TSCC cell proliferation and poor prognosis. FUBP1 appears to act as a potential oncogene in TSCC, and may be considered a novel biomarker for TSCC.
Introduction
Tongue squamous cell carcinoma (TSCC) has the highest incidence of all oral cancers, 1 notable for being highly malignant, proliferative, and invasive. 2 Common treatment approaches for TSCC involve surgical resection, radiotherapy, and chemotherapy before and after surgery. However, the therapeutic efficacy and 5-year survival rate of TSCC remain unsatisfactory, mainly due to local recurrence and metastasis. 3 At present, the choice of treatment and prognosis of TSCC patients are chiefly based on tumor node metastasis (TNM) staging. 4 However, traditional clinical prognostic factors remain insufficient to distinguish clinical outcomes (including cure, recurrence, metastasis, and death) resulting from the same TNM staging. In addition, these factors do not appear to accurately gauge therapeutic efficacy and response. Therefore, it is essential to identify novel specific biomarkers to allow targeted therapy and prognostic evaluation of TSCC patients. 5
The human far upstream element (FUSE) binding protein 1 (FUBP1) was originally identified in undifferentiated cells as a transcription factor that binds to the promoter of the c-Myc proto-oncogene and regulates its expression via transcriptional activation. 6 Previous studies have shown that, as one of the FUSE binding proteins of the proto-oncogene c-Myc, FUBP1 can regulate its expression by modulating transcription, cleavage, RNA trafficking, post-translational processing, and mRNA degradation. Aberrant FUBP1 expression has been observed in renal cell carcinoma, liver cancer, colorectal cancer, and non-small cell lung cancer. High expression of FUBP1 can also promote cancer cell proliferation and differentiation, and inhibit apoptosis, facilitating tumorigenesis and tumor development.7-9 Based on the aforementioned reports regarding the functions of FUBP1 in tumor progression, we hypothesized that FUBP1 may act as a critical regulator in the pathogenesis of TSCC. However, the contribution of FUBP1 expression to TSCC development remains still unknown. In this study, we assessed FUBP1 expression in TSCC and adjacent non-cancerous tissues, and investigated the relationship between FUBP1 expression and the clinicopathological parameters and prognosis of TSCC. In addition, we elucidated its role in regulating TSCC cell proliferation and carcinogenesis through gene silencing.
Materials and Methods
Patient and tissue specimens
(a) Paraffin specimens: TSCC and non-cancerous adjacent tissues were collected from 90 patients with pathological diagnoses of TSCC who had undergone radical surgery at the Department of Oral and Maxillofacial Surgery of the First Affiliated Hospital of Sun Yat-Sen University from August 2009 to August 2012. None of the patients received any preoperative radiotherapy or chemotherapy. Clinical data of the patients were collected, including gender, age, smoking history, tumor size, stage of differentiation, presence of lymph node metastasis, and TNM staging, according to the 8th American Joint Committee on Cancer (AJCC) classification for oral and oropharyngeal cancer. All tissue specimens were fixed in 4% paraformaldehyde and embedded in paraffin. (b) Fresh tissue specimens: TSCC and non-cancerous adjacent tissues were collected from 20 TSCC patients who had undergone radical surgery (including extensive resection of tongue carcinoma and radical or selective neck dissection) at the Department of Oral and Maxillofacial Surgery of the First Affiliated Hospital of Sun Yat-Sen University from March 2016 to March 2017. The inclusion criteria were: (a) patients with a clinically and histopathologically confirmed diagnosis of TSCC; (b) patients who had undergone radical surgery; (c) patients who had archived tumor tissue and paired adjacent tissues that were stored at the Pathological Department of the hospital; and (d) patients whose clinicopathological and follow-up data were complete. Patients were excluded if they underwent radiotherapy or chemotherapy prior to surgery. All samples were frozen in liquid nitrogen immediately after resection. Follow-up data were obtained in patient or family member visits, re-examinations, and telephone interviews. Overall survival (OS) was calculated from the day of surgery until death, or the date of the final follow-up. The median follow-up period was 45 months (range: 6–60 months). This study was approved by the Ethics Committee of the First Affiliated Hospital of Sun Yat-sen University.
Immunohistochemical staining
Paraffin blocks were cut into 3-μm sections and mounted on specific slides for immunohistochemistry (IHC). These were incubated in an oven at 60°C for 120 min for antigen retrieval, and then stained with the streptavidin-peroxidase (SP) method and 3,3′-diaminobenzidine (DAB) for color development. Breast cancer slides provided by the reagent company were used as positive controls, while phosphate-buffered saline (PBS) solution was used as the negative control. Hematoxylin was used to counter-stain the nucleus. 1
FUBP1 staining results were independently scored by two pathologists from the First Affiliated Hospital of Sun Yat-sen University who were blinded to the patients’ clinical data. The percentage of positively stained cells and staining intensity were calculated as described below. To count positive cells, five random fields were selected under 400× magnification, and 100 cells were counted in each field. Cells with yellowish-brown stained nuclei were categorized as positively stained. According to the percentage of positively stained cells (P), the TSCC samples were scored as follows: 0—negative samples, 1—samples with ⩽10% positive cells, 2—samples with 11%–50% positive cells, 3—samples with 51–75 positive cells, and 4—samples with ⩾75% positive cells. On the other hand, staining intensity (I) was scored as follows: 0—negative/unstained cells, 1—pale yellow cells, 2—brownish yellow cells, 3—reddish brown cells, and 4—deep brown cells. The staining index (SI) was calculated by multiplying the percentage of positive cells by the staining intensity. Samples were classified as highly FUBP1 expressing when SI ⩾6, and low expressing when SI <6.
Quantitative real-time fluorescence polymerase chain reaction (qRT-PCR)
Total RNA was extracted using Trizol reagent, and then reverse transcribed into cDNA. The sequences of the qRT-PCR primers were:
FUBP1 forward sequence: 5′-AGGATTACCAGCCTGAACACT-3′,
FUBP1 reverse sequence: 5′-GACAACACCCGAAAGGATAGC-3′
GADPH forward sequence: 5′-GGAGTCAACGGATTTGGTCGT-3′
GAPDH reverse sequence: 5′-GCTTCCCGTTCTCAGCCTTGA-3′.
Using the GAPDH gene as the internal control, qRT-PCR amplification was performed in an ABI 7500 instrument under the following conditions: pre-denaturation at 95°C for 10 min, followed by 40 cycles of denaturation at 95°C for 10 s, and then annealing/extension at 55°C for 35 s. The experiment was repeated three times. The cycle threshold (Ct) was obtained from the PCR response curve, and the qRT-PCR results were analyzed using the 2-ΔΔCT values. 2
Western blot
Protein fractions were extracted from the tissues, and then measured and separated by SDS-PAGE. The protein bands were then transferred onto a PVDF membrane and incubated overnight with the primary antibody (1:500) at 4°C, followed by a second 1-h incubation period with the secondary antibody (1:10000) at room temperature. The PVDF membranes were soaked with a mixture of equal parts ECL chemiluminescence solutions A and B, and then developed and fixed in the dark with developing and fixing reagents, respectively. The optical density of the bands was measured using the Image J imaging analysis system, and the exposure conditions were adjusted according to these results. Finally, the films were scanned and archived, and the Image J software processing system was used to analyze and compare the target bands. 3
Cell culture and FUBP1 siRNA transfection
Human TSCC cell lines SCC25 and UM1 were purchased from ATCC (Rockville, MD, USA). These were maintained at 37°C and 5% CO2 in DMEM medium (Gibco, USA), supplemented with 10% fetal bovine serum (Gibco) and 100 U/mL penicillin-streptomycin (Gibco). Small interfering RNA (siRNA) sequences were obtained from Ruibo (Guangzhou, China). These were transfected using Lipofectamine 2000 (Invitrogen, USA) at a final concentration of 100 nM, according to the manufacturer’s instructions. The transfection efficiency of each siRNA was detected by Western blot. 6
CCK8
SCC25 and UM1 cells were transfected with siRNA in the logarithmic growth phase, and then respectively cultured in 96-well plates (Corning Inc., USA) at a concentration of 2×10⁴ cells/well in 100 μL culture medium. CCK-8 reagent (Dojindo, Japan) was added to a subset of wells after culturing overnight, after which the cells were cultured for another period of time of 0, 24, 48, or 72 h. After a final incubation period of 2 h at 37°C, the optical density of each well was measured at 450 nm wavelength on a plate reader (TECAN, Switzerland). Each experiment was repeated at least three times. 6
Colony formation assays
After 48 h of transfection with siRNA, the SCC25 and UM1 cells were seeded in 6-well plates at concentrations of 300-1000 cells/well, and then cultured at 37°C and 5% CO2 for 14 days. Subsequently, the medium was discarded, and the cells were fixed with a 35% methanol solution, and stained with 1% crystal violet. After drying, the samples were photographed, and the percentage of surface area covered by colonies was quantified using Image J software. 5
Cell cycle analysis
A DNA quantification kit (Solarbio, China) was used according to the manufacturer’s instructions to analyze cell cycle profiles. After transfection with siRNA3, SCC25, and UM1 cells were cultured in 6-well plates for 48 h. The cells were then trypsinized and collected by centrifugation, and the pellets were re-suspended in pre-chilled PBS. Next, the cells were fixed overnight in 70% ethanol at 4°C, and then washed again with pre-chilled PBS. The cell pellets were incubated with 100 μL of RNase A for 30 min in a water bath at 37°C. Finally, 400 μL of PI was added into each tube, and the cells were stained at room temperature for 30 min in the dark. Subsequently, the distribution of the cells in the cell cycle was analyzed using flow cytometry (Beckman, USA). 5
Apoptosis assay
After 48 h of transfection with siRNA3, the SCC25 and UM1 cells were trypsinized and collected by centrifugation, and then washed with pre-chilled PBS and adjusted to 1×10⁷ cells/L. The cells were stained using an Annexin V-FITC/PI double staining kit as per the manufacturer’s instructions, and then analyzed by flow cytometry. The percentage of apoptotic cells was calculated with the differential staining; apoptotic cells were stained green with Annexin V-FITC/PI, while cells at the late stage of apoptosis with impaired cell membrane integrity were stained red by PI. 6
Statistical analysis
All statistical analyses were performed using SPSS v19.0, and all data were expressed as mean ± SD. Continuous data were analyzed using the t-test, while the LSD-t test was used for comparing between two indicators. One-way analysis of variance (ANOVA) was used for comparisons among multiple indicators, while the Chi-square test was used to analyze the correlation between FUBP1 expression and the clinicopathological parameters of TSCC patients. Survival curves were plotted with the Kaplan–Meier method and compared with the Log-rank test. The prognostic value of FUBP1 expression and the clinicopathological parameters of TSCC patients were evaluated using univariate analysis and Cox multivariate regression. Results with P values <0.05 were considered statistically significant.
Results
FUBP1 is upregulated in TSCC tissues
To investigate the levels of FUBP1 protein and mRNA expression in TSCC tissues, we performed IHC (90 pairs), Western blot (16 pairs) and qRT-PCR (20 pairs) analysis of cancer tissues and the matched adjacent non-cancerous tissues. IHC results indicated FUBP1 was predominantly expressed in the nucleus of positive cells (Figure 1(c)). Higher FUBP1 expression was observed in 65% (58/90; Figure 1(a)) of cancer tissues; whereas only 12% (11/90) of the adjacent non-cancerous tissues expressed higher FUBP1 levels. Both the percentage of positively stained cells and staining intensity were significantly higher in the TSCC tissues than the adjacent non-cancerous tissues (P<0.001; Figure 1(a)). In addition, FUBP1 expression was also significantly higher in the tumor tissues from TSCC patients in stages III–IV, than in those from patients in stages I–II (P <0.001; Figure 1(b)).
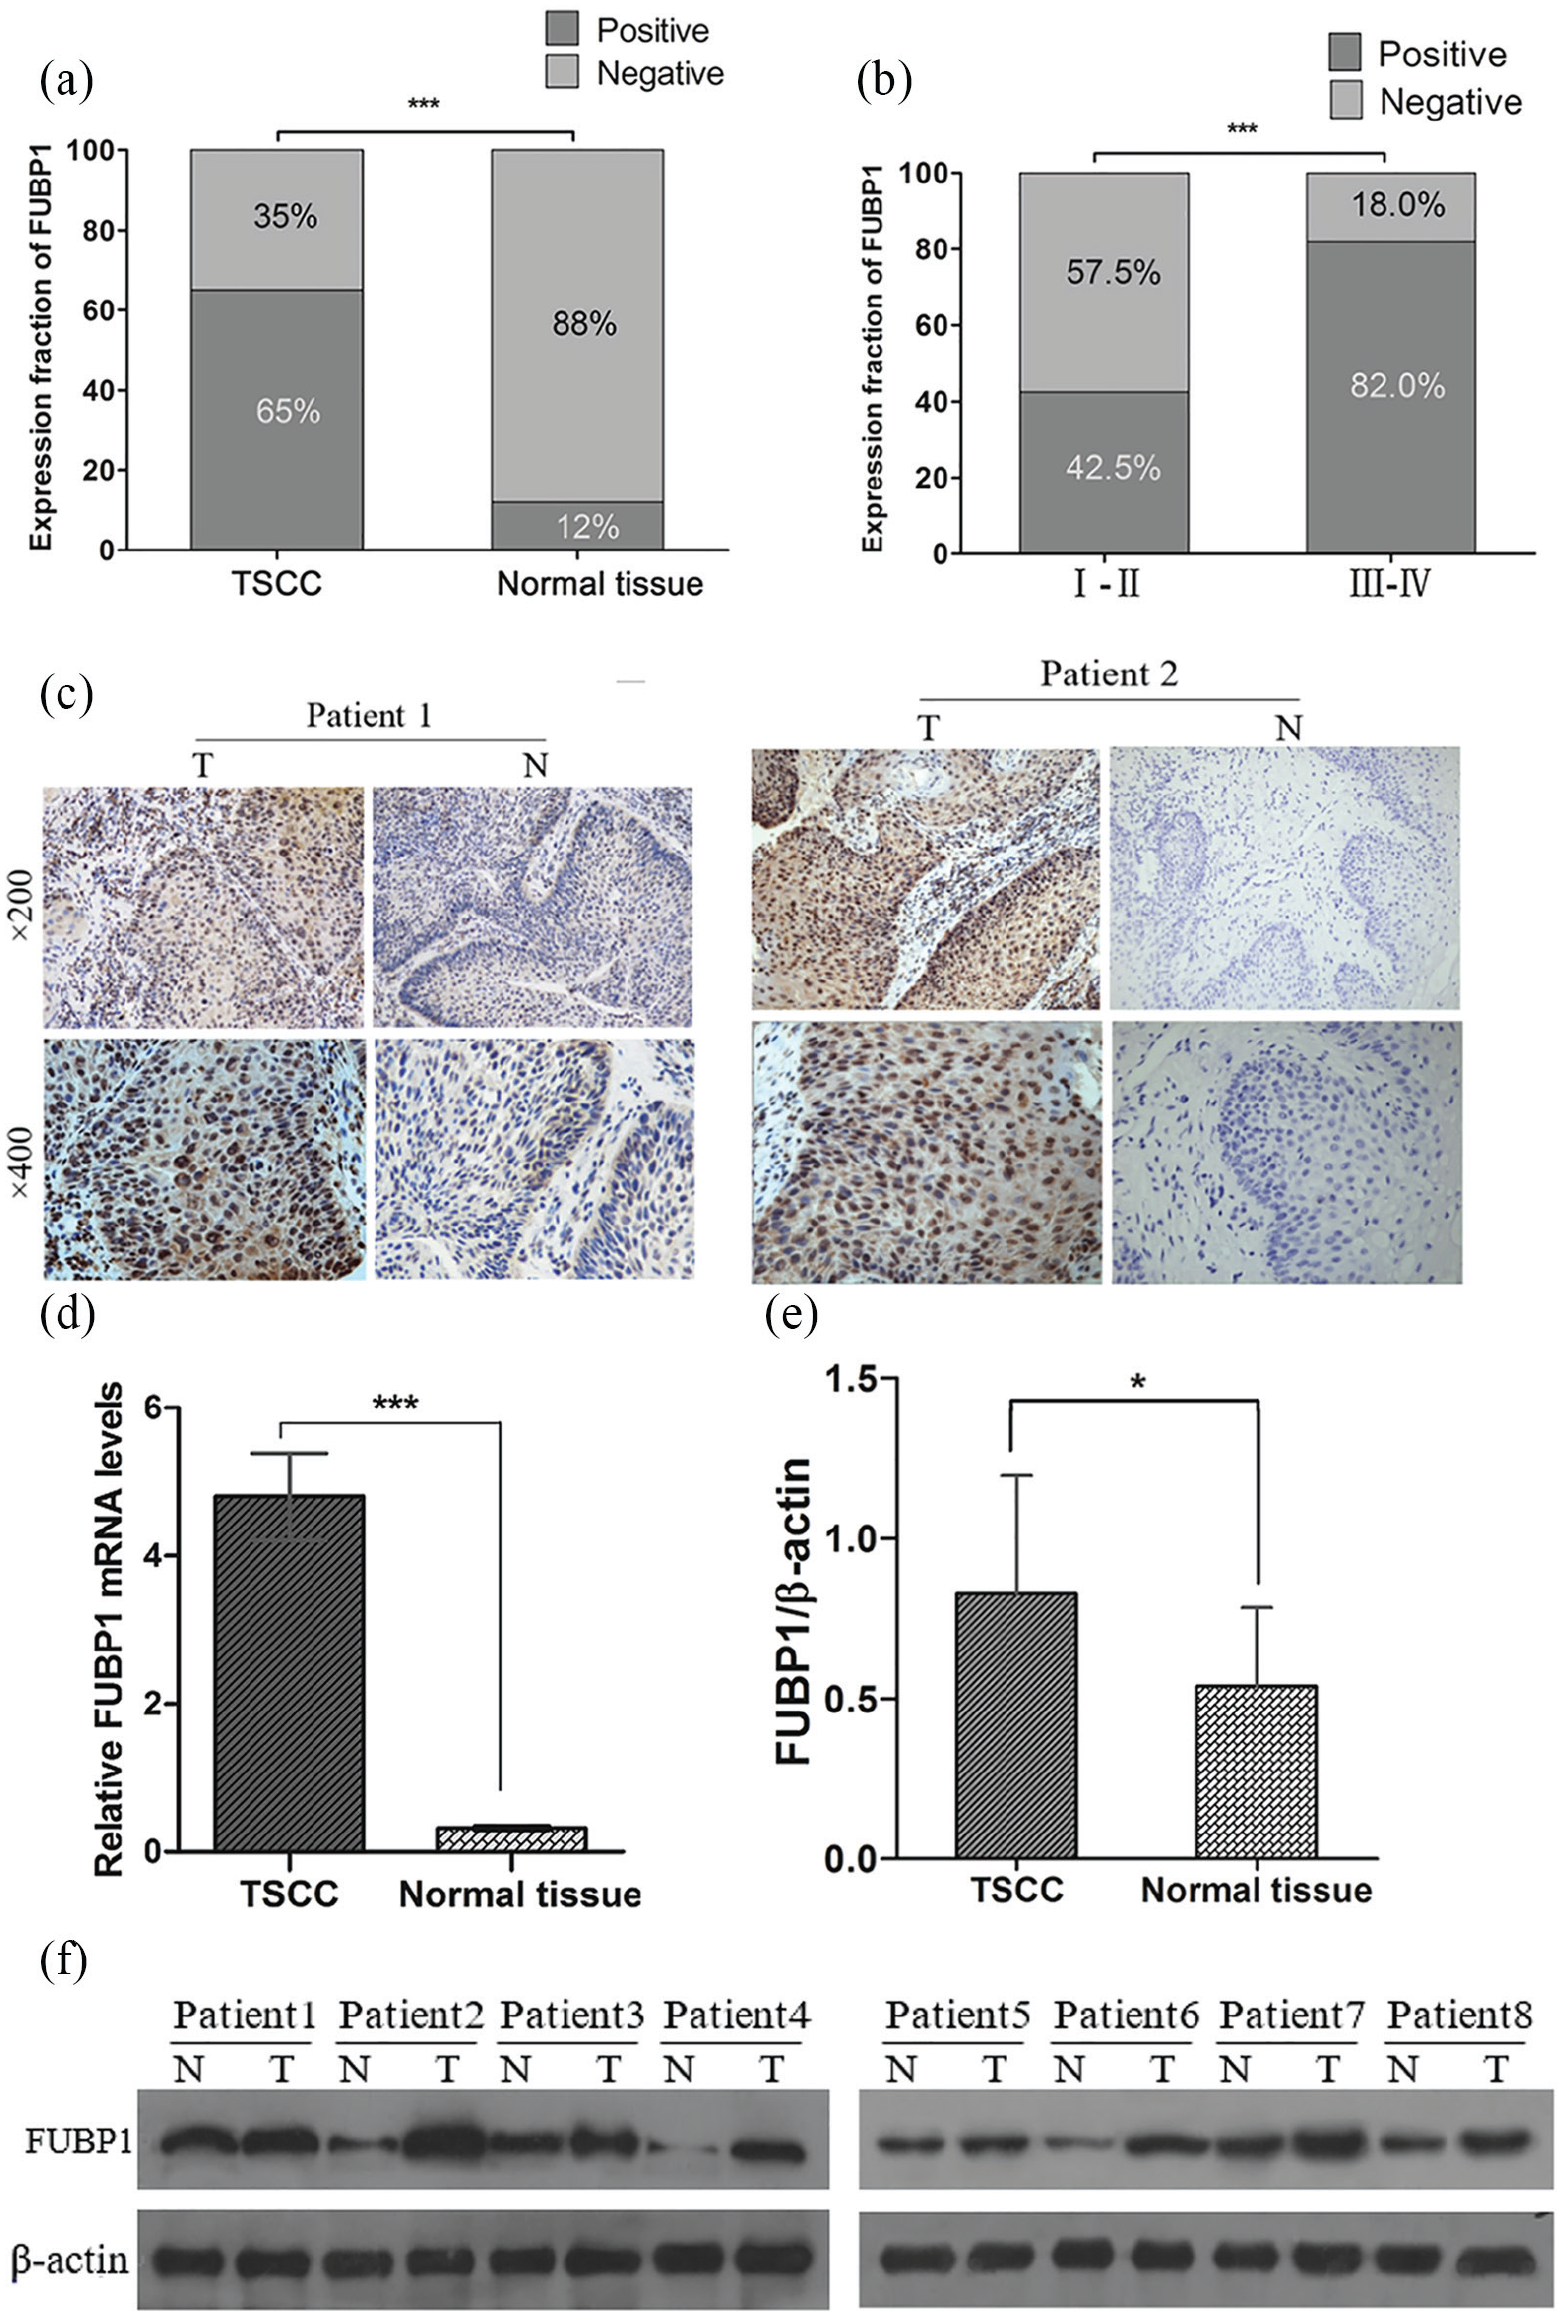
FUBP1 is upregulated in TSCC tissues. (a) Percentage of FUBP1 expression in TSCC and adjacent non-tumorous tissues. (b) Percentage of FUBP1 expression in early and late TSCC patients. (c) Representative immunohistochemical staining of FUBP1 in TSCC tumor tissues and adjacent non-tumorous tissues (magnification: 200× or 400×). Positive expression of FUBP1 was mainly located in the nucleus of TSCC cells, appearing as brown and tan particles. (d) Comparison of FUBP1 and mRNA expression levels in TSCC tumor tissues and adjacent non-tumorous tissues. (e) and (f) Western blot analysis of FUBP1 protein expression in TSCC (P<0.05).
Similarly, Western blot demonstrated the relative expression of FUBP1 protein was significantly higher in the tumor tissues than in the corresponding adjacent non-cancerous tissues: 0.83±0.37 vs. 0.54±0.25; t=−2.618, P=0.014 (Figure 1(e) and (f)).
Finally, real-time qPCR was used to measure relative FUBP1 mRNA levels in 20 pairs of TSCC samples and the adjacent non-cancerous tissues. The 2-∆∆ct values of FUBP1 mRNA in the TSCC and normal adjacent tissues were 5.25±0.92 and 0.39±0.03, respectively, indicating a higher relative amount of FUBP1 mRNA in the TSCC tissues (t=−5.237, P<0.001; Figure 1(d)).
Association between FUBP1 expression with the clinicopathological characteristics and prognosis of patients with TSCC
To assess the association between FUBP1 expression and patients’ clinicopathological parameters, the patients were divided into two groups based on their FUBP1 expression levels. No correlation was found between FUBP1 expression and patients’ gender, age, smoking history, tumor size, or histological differentiation (P>0.05). However, FUBP1 expression was significantly correlated with TNM staging and lymph node metastasis (P <0.05; Table 1). Furthermore, the 5-year survival rate was significantly lower in the high-expression group (31.0%) compared with the low-expression group (68.8%) (P =0.035; Figure 2). Univariate analysis showed TNM staging, lymph node metastasis, tumor size, and FUBP1 expression significantly affected overall survival (OS) (P <0.05). On the other hand, multivariate regression analysis showed that TNM staging, lymph node metastasis, and FUBP1 expression were independent prognostic factors for OS in TSCC patients (P <0.05; Table 2).
Relationship between the expression of FUBP1 and the clinicopathological parameters of 90 TSCC patients (%).
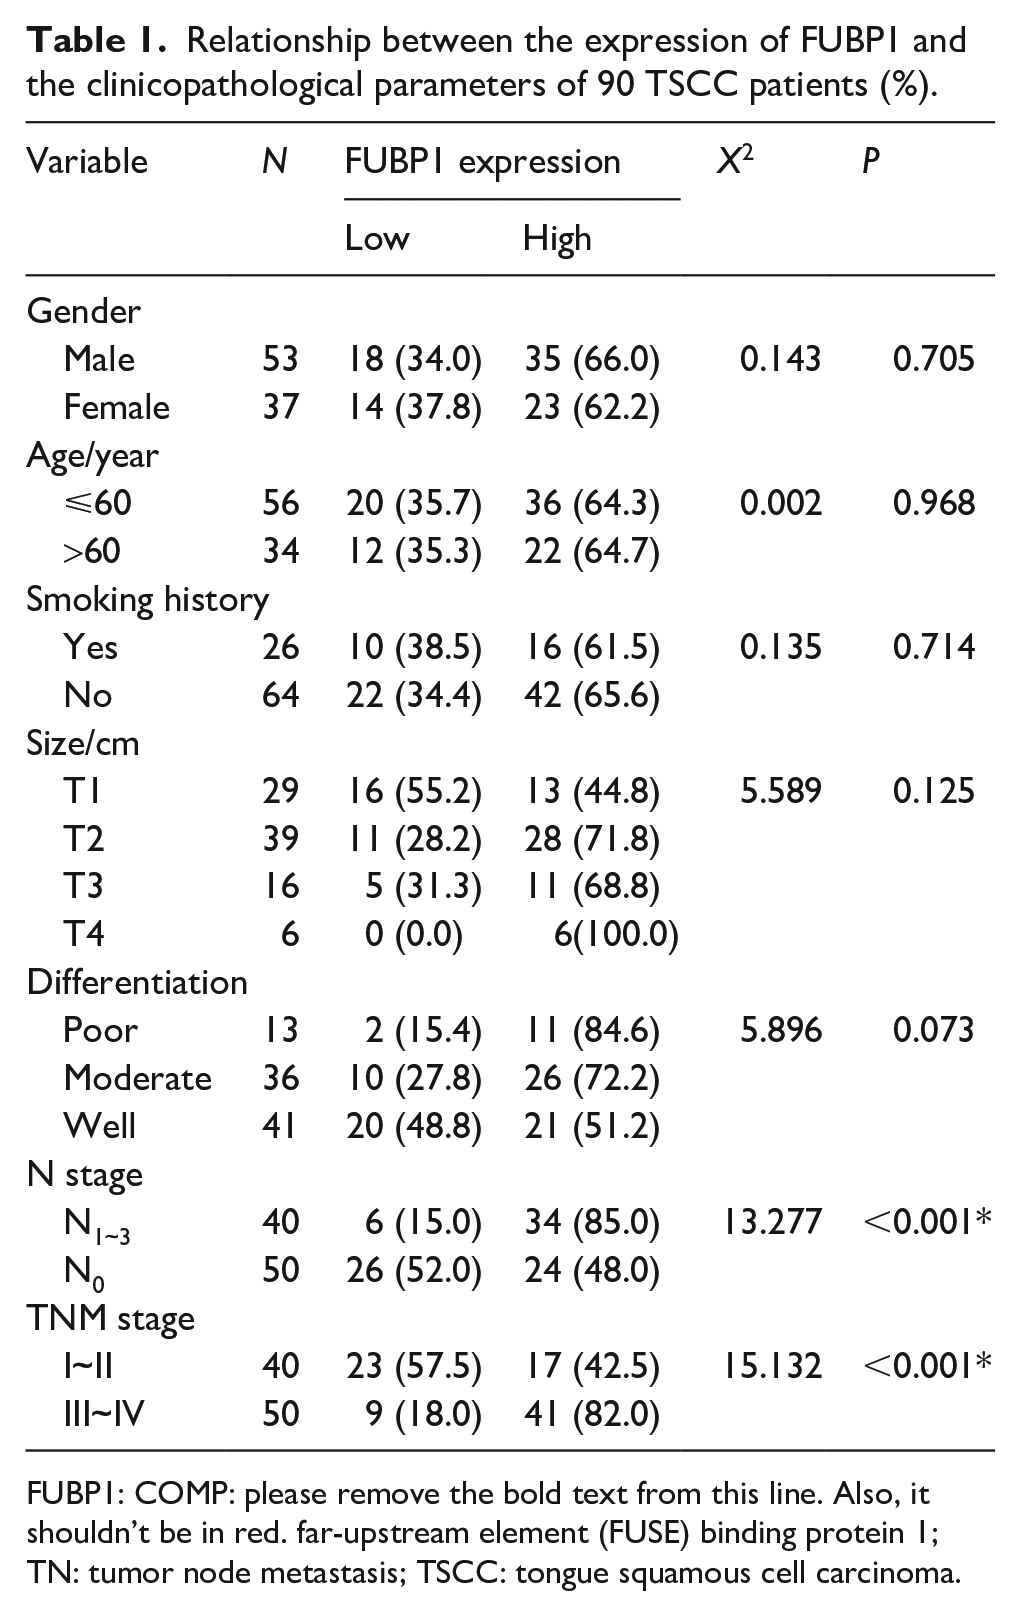
FUBP1: COMP: please remove the bold text from this line. Also, it shouldn’t be in red. far-upstream element (FUSE) binding protein 1; TN: tumor node metastasis; TSCC: tongue squamous cell carcinoma.
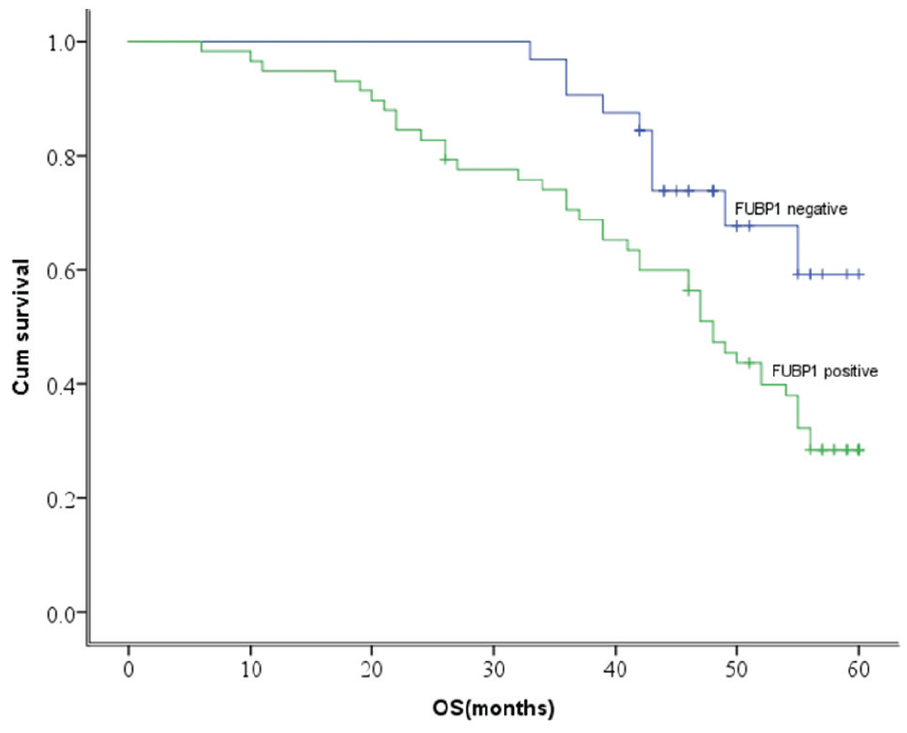
Relationship between the expression of FUBP1 and the survival rate of patients with TSCC. Patients with low FUBP1 expression had longer overall survival time than those with high FUBP1 expression, P=0.035.
FUBP1 silencing suppressed proliferation of SCC25 and UM1 cells
To further investigate the effect of the changes in FUBP1 expression on TSCC cell proliferation, SCC25 and UM1 cells were transiently transfected with FUBP1 siRNA and nanoconjugates (NC) siRNA. The efficiency of FUBP1 siRNA was confirmed by Western blot assays (Figure 3(a)). After successful transfection, proliferative ability was analyzed with CCK-8 and colony formation assays. The growth curves plotted from the CCK-8 assays are shown in Figure 3(b). SCC25 and UM1 cells transfected with FUBP1-siRNA showed significantly lower absorbance at 48 h and 72 h post-transfection, in comparison with the untransfected and NC-siRNA groups; this difference became greater over time (P <0.05). Furthermore, the colony-forming capacity of the FUBP1-siRNA transfected cells was also significantly reduced (Figure 3(c)). In ensemble, these results indicate that the down-regulation of FUBP1 inhibited TSCC cell proliferation.
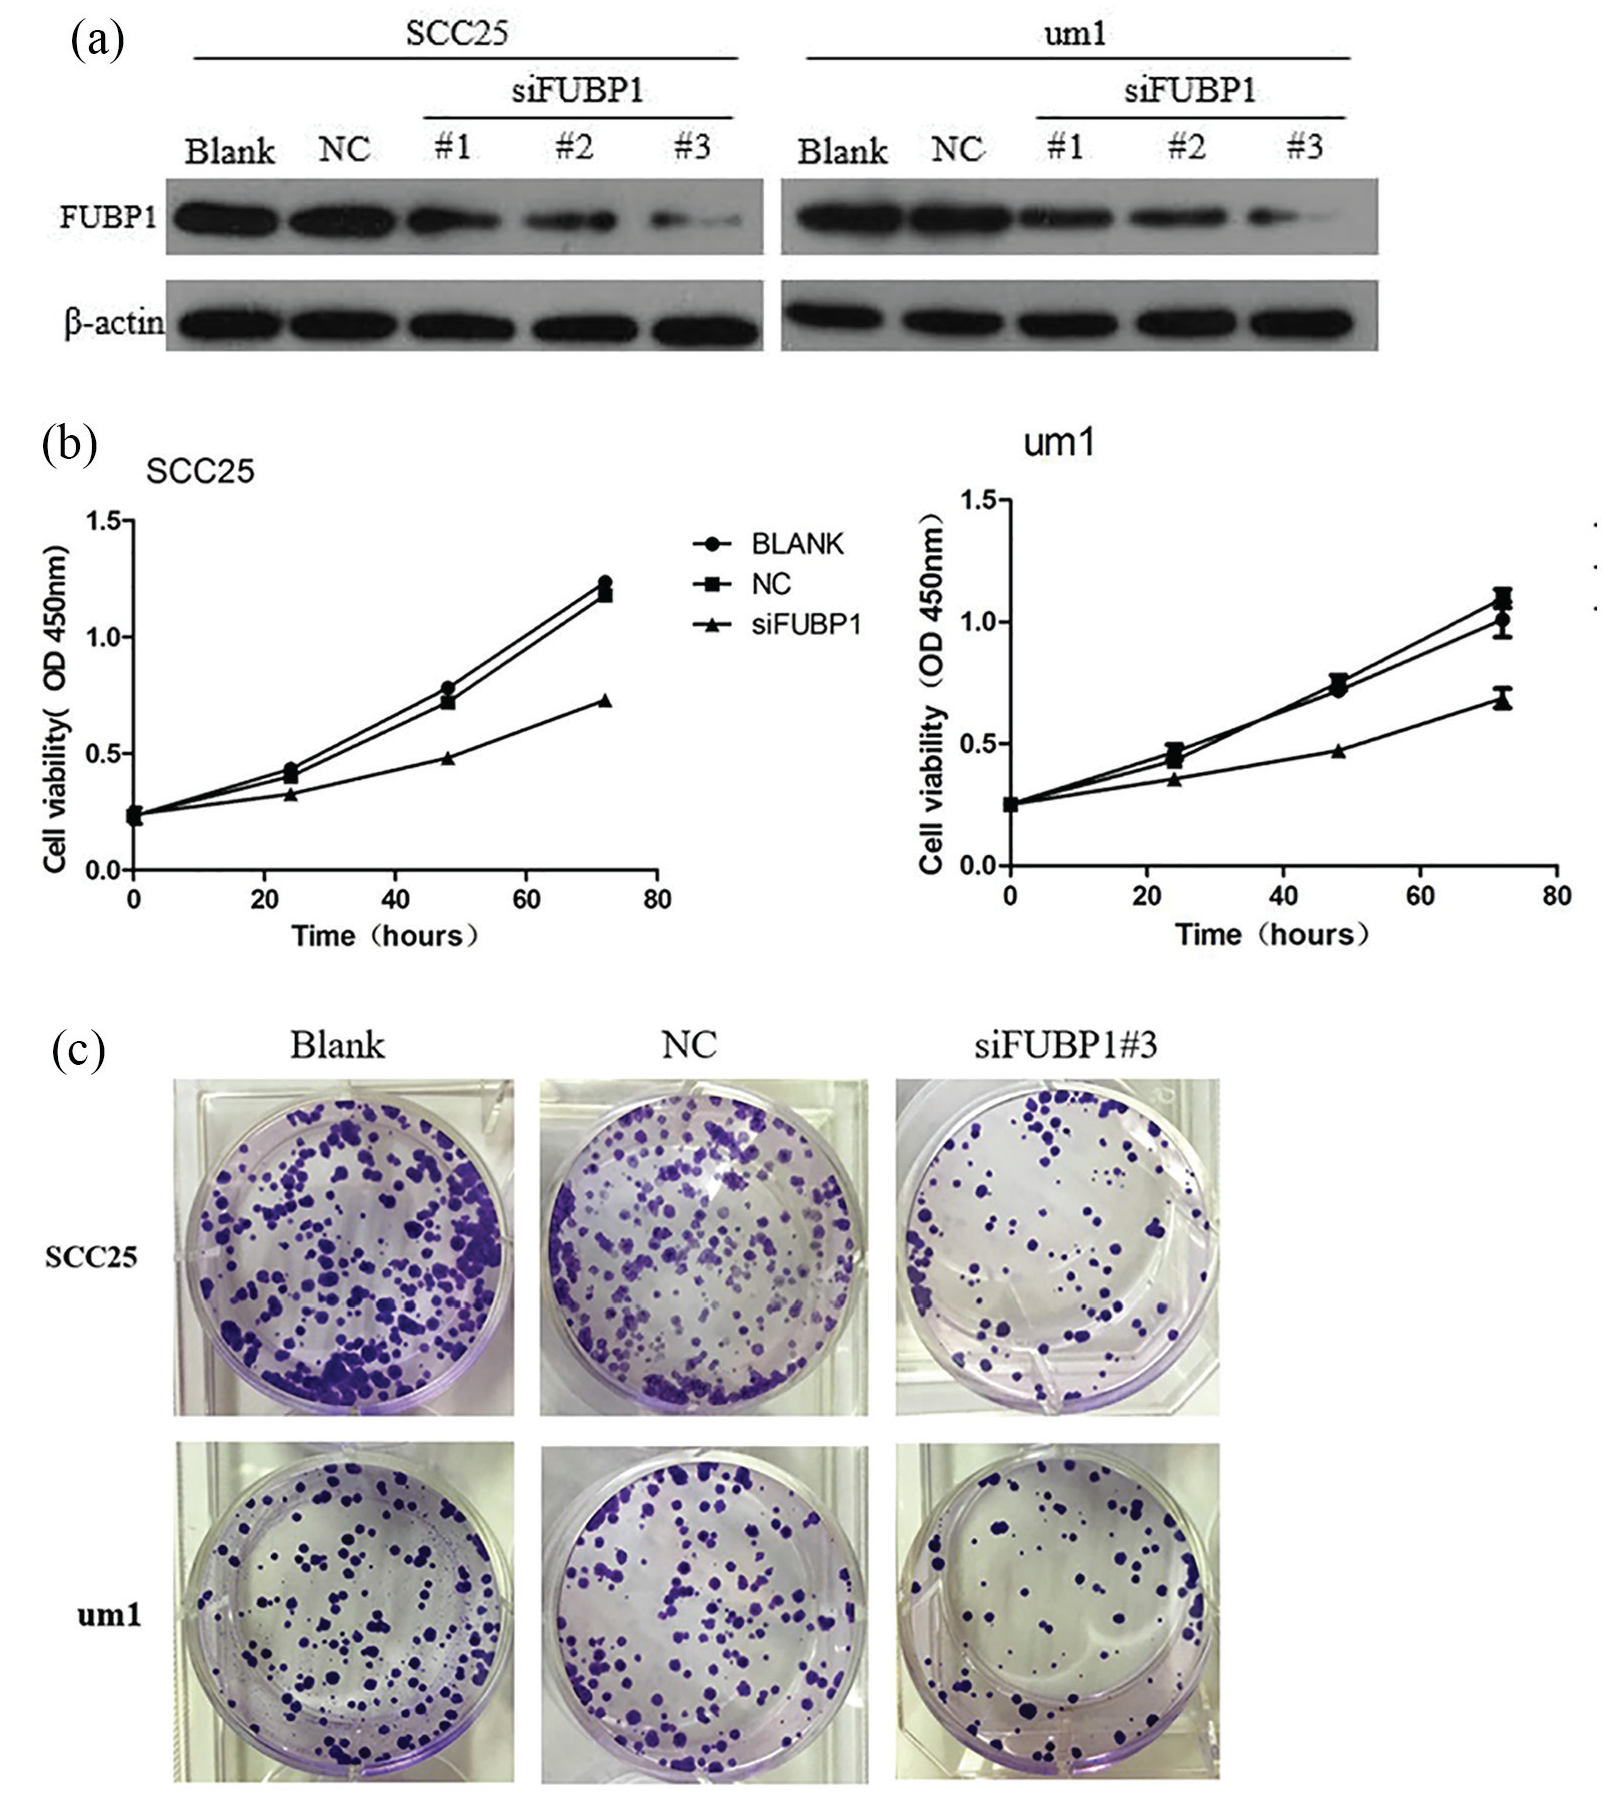
FUBP1 silencing decreases proliferation of SCC25 and UM1 cells. (a) FUBP1 knockdown efficiency was analyzed using Western blotting. Of the three siRNAs tested, siRNA3 showed maximum knockdown of FUBP1, and was therefore selected for subsequent experiments. (b) Assessment of SCC25 and UM1 cell proliferation by CCK8 assay. (c) Plate colony assay was performed to determine the proliferation of SCC25 siRNA cells, UM1 siRNA cells, and the corresponding control cells (SCC25-Blank/NC and UM1-Blank/NC). The area percentage occupied by SCC25 siRNA3 and UM1 siRNA3 cells was markedly lower than that occupied by SCC25-Blank/NC and UM1-Blank/NC.
FUBP1 silencing arrested SCC25 and UM cells in the G1 phase
In order to understand the mechanism by which FUBP1 enhanced TSCC cell proliferation, we performed flow cytometry to assess the distribution of siRNA-treated SCC25 and UM1 cells in the cell cycle. Compared with the untransfected and NC-siRNA groups, FUBP1 silencing increased the proportion of cells in the G0/G1 phase, and decreased the proportion of cells in the S phase. Thus, FUBP1 silencing appeared to arrest cells in the G1 phase and hinder their progression to the S+G2 phase. FUBP1 silencing also reduced cell proliferation, suggesting FUBP1 promotes the proliferation of SCC25 and UM1 cells by accelerating the cell cycle (Figures 4 (a) and (b)).
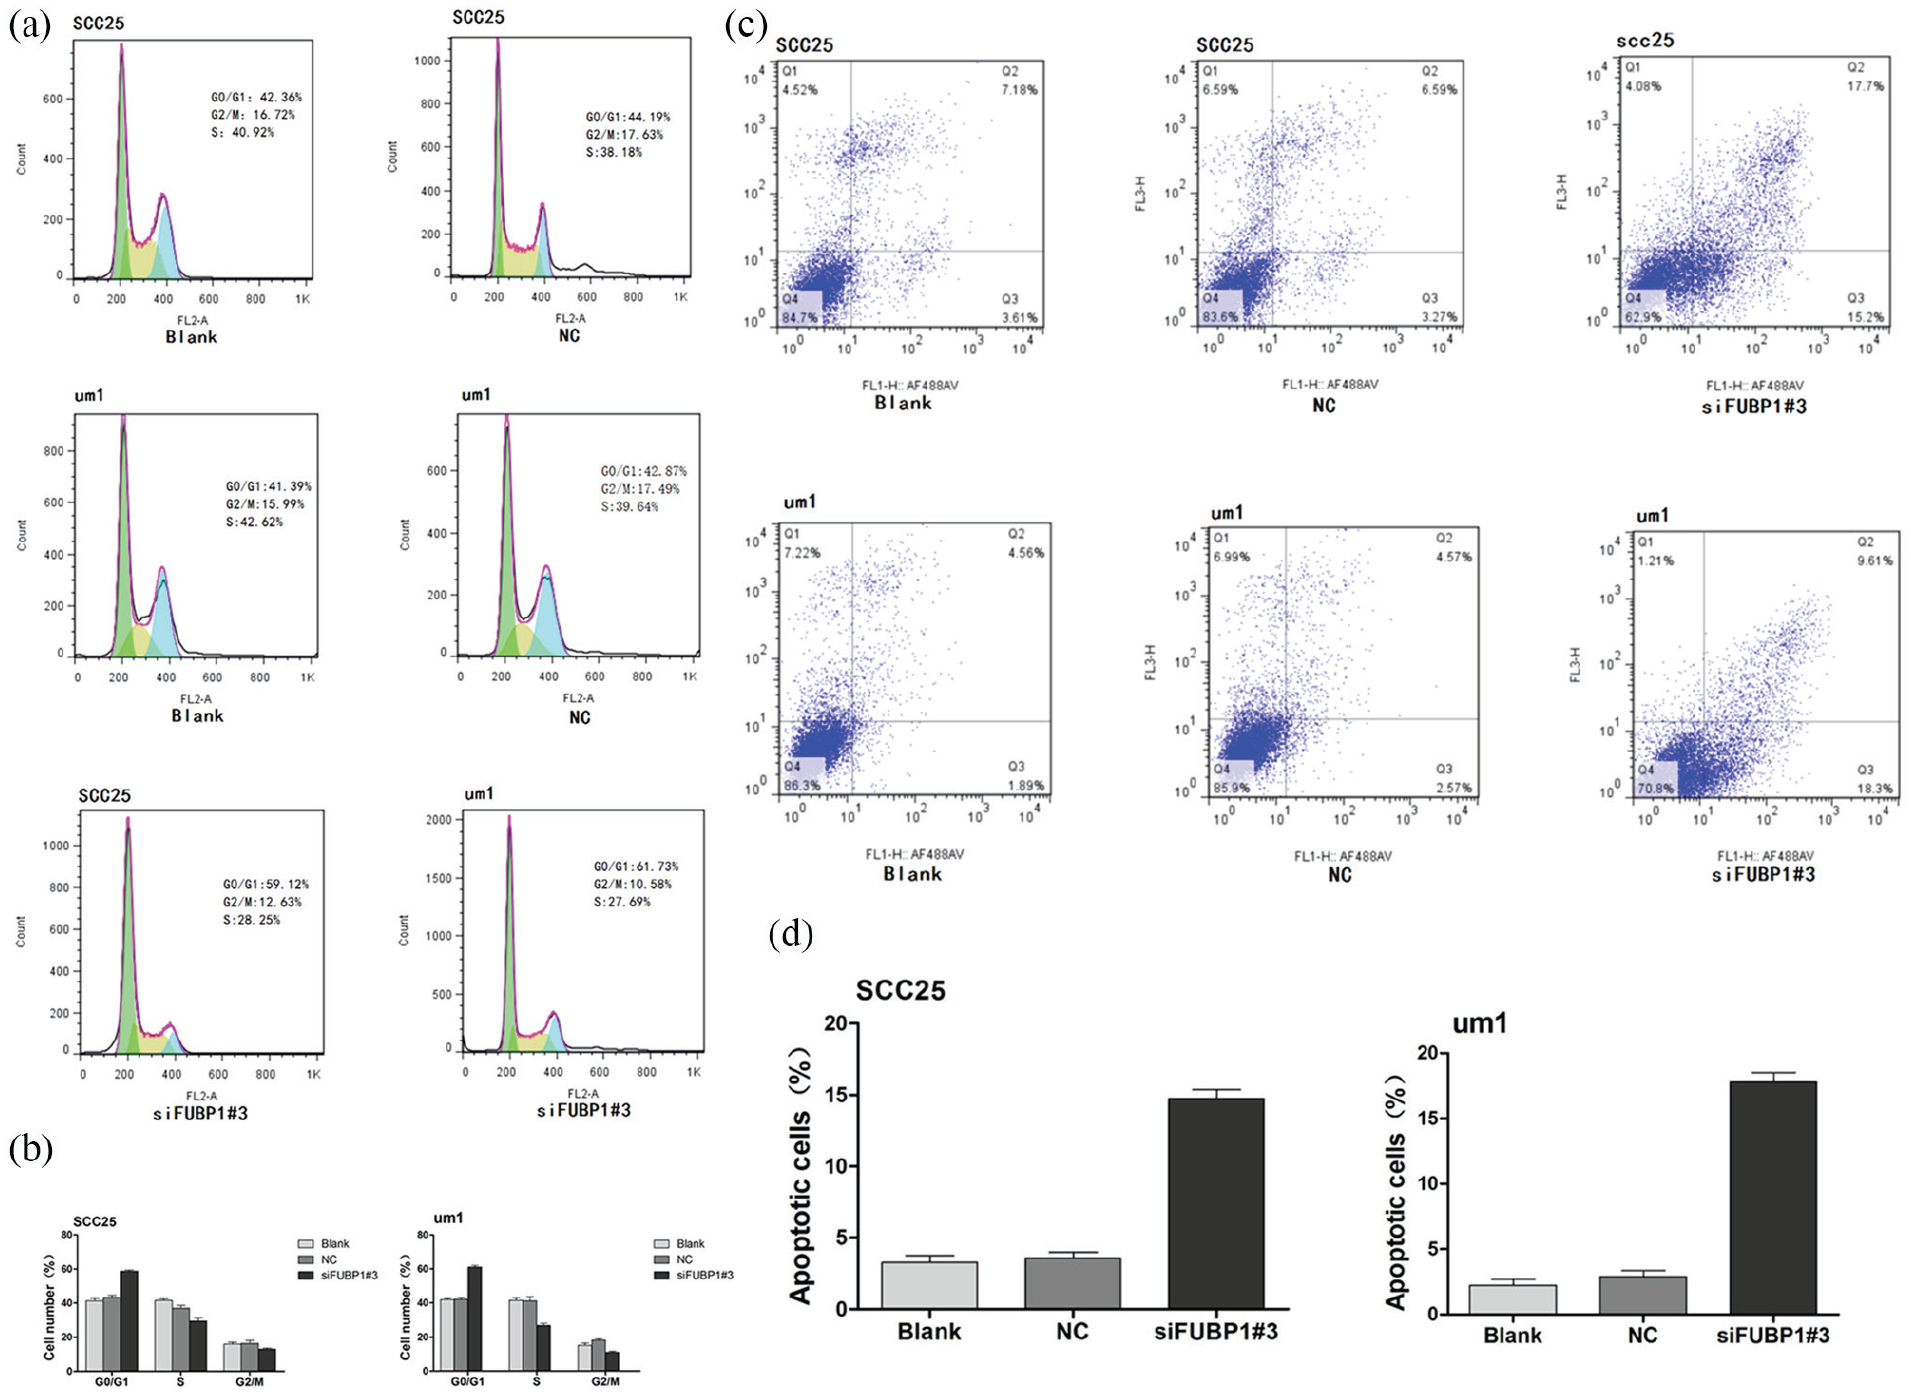
FUBP1 regulates cell proliferation possibly by G1/S transition and promotes cell apoptosis. (a) Representative data from flow cytometry analysis of the cell cycle distribution in SCC25-siRNA cells, UM1-siRNA cells, and the corresponding control cells (SCC25-Blank/NC and UM1-Blank/NC). (b) The percentage of cells in the G0/G1, S, and G2/M phases was quantified and plotted. (c) SCC25 and UM1 cells transfected with FUBP1 siRNA were stained with a combination of annexin V and PI, and analyzed with flow cytometry. Cells positive for annexin V staining were counted as apoptotic cells. (d) Percentage of apoptotic cells. *P<0.05, **P<0.01.
FUBP1 silencing enhanced apoptosis in SCC25 and UM1 cells
To investigate whether FUBP1 affects apoptosis in SCC25 and UM1 cells, annexin V-FITC/PI double staining was performed after transfection. Compared to the untransfected and NC-siRNA groups, the percentage of positively stained cells was significantly higher after FUBP1-siRNA transfection (P<0.05). Therefore, FUBP1 silencing increased apoptosis in TSCC cell lines (Figures 4 (c) and (d)) indicating FUBP1 could inhibit apoptosis during TSCC progression.
Discussion
TSCC is the most common malignancy seen in the oral and maxillofacial regions. 10 Although the diagnosis and therapy of TSCC have been researched for many years, its incidence and mortality rates remain high. Thus, finding new and useful biomarkers for the prediction and prognosis of patients with TSCC is an urgent objective in order to improve patients’ survival time. 11 The present study aimed to confirm the role of FUBP1 in TSCC, and is the first to preliminarily explore the underlying molecular mechanisms. In this study, we demonstrated FUBP1 may be an important biomarker in TSCC; finding FUBP1 expression was significantly higher in the tumor tissues compared with non-tumorous adjacent tissues, as ascertained by IHC, Western blot, and qRT-PCR. This suggests FUBP1 may be an oncogene in TSCC.
Previous studies have reported FUBP1 to be associated with various clinicopathological features and prognosis. FUBP1 overexpression has been closely related to poor prognosis in glioma patients, and is therefore a useful prognostic tool in that scenario. 12 Liu et al. 13 demonstrated elevated expression of both FUBP1 and c-Myc in nasopharyngeal carcinoma cell lines, in correlation with distant metastasis and poor prognosis in patients with nasopharyngeal carcinoma. Similarly, Yang et al. 14 confirmed that in most esophageal cancer tissues, expression levels of FUBP1 and c-Myc could be used as independent prognostic indicators of OS. Zhang et al. 15 concluded that FUBP1 expression was lower in gastritis tissues compared to gastric cancer tissues; therefore, its detection in gastric cancer patients could aid the prediction of survival and disease progression. Our study yielded similar results, with increased FUBP1 expression in TSCC tissues being associated with advanced tumor stages and cervical lymph node metastasis. Moreover, OS was significantly higher in patients with low FUBP1 expression. Univariate analysis showed TNM staging, lymph node metastasis, tumor size, and FUBP1 expression level were correlated with OS; while multivariate regression analysis confirmed these factors to be independent prognostic predictors. These results suggest that high levels of FUBP1 are associated with the advanced stage of TSCC, cervical lymph node metastasis, reduced survival rate, and poor prognosis—all of which indicate that FUBP1 plays an important role in the pathogenesis of TSCC.
To study the underlying mechanisms, we downregulated FUBP1 expression with siRNA in two TSCC cell lines: SCC25 and UM1. Cell cycle and apoptotic machinery are often dysregulated during tumor development, leading to uncontrolled growth.16,17 Thus, we analyzed proliferation rate, cell cycle profile, apoptosis rate, and colony forming capacity after silencing FUBP1. Downregulation of FUBP1 significantly inhibited their proliferation and colony forming ability, induced cell cycle arrest at the G1 phase, and increased cell apoptosis. This suggests that FUBP1 likely acts as an oncogenic protein, accelerating cell cycle progression, hindering apoptosis, and increasing cell proliferation, all of which promote TSCC tumor growth.
FUBP1 may exert different functions depending on its subcellular localization. It is primarily found within the nucleus, where it acts as a transcription regulator. 18 Studies have shown FUBP1 can bind to the FUSE domain of c-Myc and other genes, increasing their expression. 19 FUBP1 belongs to the family of single-stranded DNA binding proteins, and regulates the expression of proto-oncogene c-Myc, a transcription factor expressed in numerous human cancers, which can promote cell proliferation or induce apoptosis. 19 In addition, FUBP1 can also interact with TFII and FIR factors, which results in the unloading of RNA polymerase II from the c-Myc promoter and in the inhibition of c-Myc expression.20,21 Research has also shown that caspases in apoptotic cells reduce the levels of FUBP1, c-Myc, and its target proteins, therefore inhibiting the carcinogenic effects of c-Myc. 22 FUBP1 can also directly bind to RNA and regulate its processing, transport, and catabolism, owing to the complex intra-nuclear transport and specific structure of FUBP1. 23
In this study, we found FUBP1 was highly expressed in TSCC tissues and mainly localized in the nucleus, suggesting it has a regulatory role in transcription. Therefore, we hypothesize that FUBP1 may induce TSCC development and metastasis by regulating c-Myc expression. In turn, this will be the focus of our upcoming research. Due to the small sample size, c-Myc was not included in this study, and animal experiments were not included, which had certain limitations. Further in-depth data analysis is needed to provide a reliable basis for clinical application.
In conclusion, we found that FUBP1 plays a significant role in TSCC tumorigenesis and development, and may be a potential molecular target for therapy. In addition, the strong correlation of elevated FUBP1 expression with tumor staging and poor survival renders this molecule a suitable prognostic marker for TSCC. Future prospects are to identify FUBP1 functionality, also to evaluate the relationship with c-Myc and their synergic effects on TSCC development and progression. In addition, we will attempt to identify the specific mechanisms and pathways involved in FUBP1 functionality, thus providing more potential biomarkers for the early detection and treatment of TSCC.
Supplemental Material
table2 – Supplemental material for Upregulation of far upstream element-binding protein 1 (FUBP1) promotes tumor proliferation and unfavorable prognosis in tongue squamous cell carcinoma
Supplemental material, table2 for Upregulation of far upstream element-binding protein 1 (FUBP1) promotes tumor proliferation and unfavorable prognosis in tongue squamous cell carcinoma by Yang Chen, Jiameng Liu, Ningbo Geng and Chongjin Feng in The International Journal of Biological Markers
Footnotes
Author contributions
Yang Chen and Jiameng Liu contributed equally to this work.
Declaration of conflicting interests
The author(s) declared no potential conflicts of interest with respect to the research, authorship, and/or publication of this article.
Ethical approval
All procedures performed in studies involving human participants were in accordance with the ethical standards of the First Affiliated Hospital, Sun Yat-sen University and National Research Committee, and with the 1964 Helsinki Declaration and its later amendments or comparable ethical standards.
Funding
The author(s) disclosed receipt of the following financial support for the research, authorship, and/or publication of this article: This study was founded by the National Natural Science Foundation of China (grant number 81172564) and Clinical Medical Research Project 5010 of Sun Yat-sen University (grant number 2010018).
Informed consent
Informed consent was obtained from all individual participants included in the study.
Supplemental material
Supplemental material for this article is available online.
References
Supplementary Material
Please find the following supplemental material available below.
For Open Access articles published under a Creative Commons License, all supplemental material carries the same license as the article it is associated with.
For non-Open Access articles published, all supplemental material carries a non-exclusive license, and permission requests for re-use of supplemental material or any part of supplemental material shall be sent directly to the copyright owner as specified in the copyright notice associated with the article.