
Abstract
Background:
Long intergenic non-coding RNA, regulator of reprogramming (LINC-ROR) is a newly identified cytoplasmic long non-coding RNA (lncRNA), which has been found to be dysregulated in different cancers. The present work aimed to quantify LINC-ROR expression profile and assess the tumor proteins p53 and caspase 3 expressions in glioblastoma tissue specimens compared to non-cancer tissues, and to correlate these expression levels with the available clinicopathological and survival data.
Methods:
LINC-ROR relative expression in 57 glioblastoma cancer tissues and 10 non-cancer tissues was quantified by real-time polymerase chain reaction (qPCR). In addition, methylation-specific PCR of O-6-methylguanine-DNA methyltransferase (MGMT) promoter and immunohistochemical expression of apoptosis related proteins: p53 and caspase 3 were performed.
Results:
The up-regulation of LINC-ROR was encountered in 89.5% of patients. The higher expression of LINC-ROR was associated with poor disease progression-free and overall survival as well as a younger age of patients (P=0.036). p53 protein was expressed only in glioblastoma but not in non-cancer tissues while caspase 3 was weakly expressed in most non-cancer tissues and in varying degrees in glioblastoma (24% weak, 30% moderate, and 16% strong expression). The Kaplan–Meier survival plot illustrated poor survival in glioblastoma patients with over-expressed LINC-ROR (P=0.010) and down-regulated p53 (P=0.002). Multivariate analysis showed that glioblastoma patients were clustered into two distinct groups based on LINC-ROR expression profile, p53 staining levels and patients’ overall survival.
Conclusions:
LINC-ROR up-regulation may have a role in glioblastoma tumorigenesis and could be a potential prognostic marker for this fatal disease.
Introduction
Glioblastoma (GB) is the most common malignant adult brain tumor worldwide, and is considered the most aggressive subtype of glioma. 1 Even after surgical resection, radiotherapy, and chemotherapy, the mean survival time for GB patients is only 12 to 15 months. 2 Early detection-markers and novel therapeutic modalities are essential for the improved survival of GB patients.
In the past, long non-coding RNAs (lncRNAs) have been implicated in multiple cancers owing to their ability to act as oncogenes or tumor suppressor genes. 3 Those RNAs consist of poorly conserved sequences of more than 200 nucleotides in length. 4 Studies suggest a major role of lncRNAs in many cellular processes and biological pathways. For instance, they regulate chromatin remodeling, transcription, splicing, mRNA stability, translation, and protein structure/function. 5
In the brain, lncRNAs were found to affect brain development through regulating pluripotency, neuronal differentiation plus neuron and synapse formation. 6 Microarray studies have detected the up-regulation or down-regulation of several lncRNAs in GB.7,8 Some lncRNAs have been associated with the development, progression, or aggressiveness of glioma and GB, including MALAT1 (metastasis associated lung adenocarcinoma transcript 1), 9 H19, 10 HOTAIR (Hox transcript antisense RNA), 11 Growth arrest specific 5 (GAS5), 12 and CRNDE (colorectal neoplasia differentially expressed). 13
The long intergenic, non-protein coding, regulator of reprogramming (LINC-ROR) was discovered in 2010 as being able to reprogram differentiated cells into induced pluripotent stem cells (iPSC) through comprising a binding site for the transcription factors required for pluripotency. 14 The LINC-ROR gene is mapped to 18q21.3 and is 17.8 kb long, of which only 2.6 kb form its four exons (http://www.genecards.org/). Studies demonstrated that LINC-ROR depletion leads to increased apoptosis suggesting its pivotal role in p53 network.14,15 LINC-ROR was found to directly interact with the heterogeneous nuclear Ribonucleoprotein I (hnRNP) at the 5′-UTR of p53 mRNA, thus suppressing the tumor suppressor p53 translation after DNA damage. 16 On the other hand, p53 can bind LINC-ROR promoter and activate its transcription, generating a negative feedback regulatory loop between the two molecules. 15 The role of LINC-ROR in cancer has recently come to light, where its aberration was found to be associated with endometrial cancer, 17 pancreatic carcinoma, 18 breast cancer, 19 renal cell carcinoma (unpublished work from our lab), and nasopharyngeal carcinoma. 20
Interestingly, Feng et al. 21 have studied the role of LINC-ROR and found that it had a tumor suppressor function in glioma as opposed to its oncogenic role in all other tumor types. In the current study, we selected GB for being the most malignant form of glioma, and measured the expression profile of LINC-ROR in association with the survival of GB patients. Furthermore, we assessed the levels and prognostic implications of p53 together with one of its downstream molecules, caspase 3, which we selected for being a marker of apoptosis.
Materials and methods
Patients and tissue specimens
A total of 332 formalin-fixed paraffin embedded (FFPE) brain cancer tissue specimens were collected in the period between 2010 and 2014 from the archives of the Pathology Labs of Suez Canal University Hospital (SCUH) and Mansoura University Hospital (MUH), Egypt. Histo-pathological diagnosis of GB was established according to the World Health Organization (WHO) guidelines published in 2016. 22 Out of the total specimens collected, 57 primary glioblastoma FFPE tissues (grade IV) and 10 non-cancer brain tissue regions from the brain (which were proved to be non-cancer tissues as evidenced by the histopathological reports) were selected for further analysis according to the criteria shown in Supplementary Figure 1. The controls were age-, sex-, and location-matched to the GB patients. Characteristics of normal brain specimens are demonstrated in Supplementary Table 1. All patients enrolled in the study had IDH wild-type GB as documented in their medical reports. Data of all 57 GB patients was used in this study as depicted in Supplementary Table 2. The study was conducted following the ethical and legal standards adopted by the Declaration of Helsinki. Approval was obtained from the Medical Research Ethics Committee of Faculty of Medicine, Suez Canal University. Consent was obtained from patients by the hospital administration as a routine measure for specimen archiving. Relevant patients’ medical records and follow-up reports were screened and evaluated.
In this study, hematoxylin and eosin (H&E) sections were examined to confirm the diagnosis of GB. This was followed by immunohistochemical localization of p53 and caspase 3 (to assess apoptosis), gene expression analysis of LINC-ROR and methylation-specific PCR of MGMT (O-6-methylguanine-DNA methyltransferase) promoter.
Histopathological and immunohistochemistry assessment of the tissue specimens
Assessment using H&E stained sections was performed by two independent pathologists to confirm that the tumor tissues were of grade IV GB; the agreement between the two pathologists in the GB diagnosis was 97.4%. Paraffin sections (4–5 μm), mounted on positively charged slides (one from each of the 57 tumor and one from each of the 10 control specimens) were used for immunohistochemical (IHC) localization of caspase 3 and p53 proteins. Deparaffinization in xylene and alcohol, antigen retrieval in Tris-EDTA (pH 9.0) in a microwave oven at 800W for 20 min, rinsing, and blocking with peroxidase for 10 min were performed as described in our previous study. 23 In brief, rabbit polyclonal IgG antibodies to caspase 3 (GenTex, cat no GTX110543, diluted at 1:200) and mouse monoclonal antibody for p53 (Genemed, cat no 61-0050-2, clone BP53-12, Isotype IgG2a, diluted at 1:300, reacts with wild-type and mutant type p53 protein) were used, followed by overnight incubation at 4°C, and staining with 3,3-diaminobenzidine (DAB) (1:1 DAB chromogen and DAB buffer). Appropriate negative and positive controls were run. Phosphate-buffered saline was used in negative slides instead of the primary antibody, whereas positively stained brain tumor specimens were reused as positive controls.
Slide examination was carried out using an Olympus CX31 light microscope. Expression of caspase 3 in the cytoplasm and p53 in the nuclei of brain tissue cells was recorded in sections of normal and cancer brain tissues. Positive immune-stained cells were counted manually by two independent investigators, then discrepancies between them were discussed till a consensus was reached. IHC was done on the whole tissue specimen including all diagnostic areas, such as necrotic core and anaplastic cells. The following parameters were used for determining the degree of expression of immunostaining: if the reaction ⩽ 10%, the specimen was considered negative, while 10%–30%, 31%–70%, and 71%–100% were categorized as weak, moderate, and strong expression, respectively. 23 A cutoff value of 50% was applied independently by the two pathologists to classify the expression of the immunohistochemically detected proteins into over- or under expression.
Gene expression analysis of LINC-ROR
RNA was extracted from sections of FFPE specimens using the Qiagen miRNeasy FFPE Kit (Cat # 217504, Qiagen, Hilden, Germany) according to the manufacturer’s protocol. RNA concentration and purity were assessed with NanoDrop ND-1000 spectrophotometer (NanoDrop Tech., Inc. Wilmington, DE, USA). RNA integrity was evaluated in 0.8% TAE agarose gel at a low voltage. Reverse transcription was done using the High Capacity cDNA Reverse Transcription Kit (Part No 4368814, Applied Biosystems, Thermo Fisher Scientific, Waltham, MA, USA) to form complementary DNA (cDNA) as described previously. 9 Mastercycler Gradient Thermocycler (Eppendorf, Hamburg, Germany) was used at the following cycling conditions: 25°C for 10 min, 37°C for 120 min, and 85°C for 5 min.
The real-time polymerase chain reaction (PCR) analysis was carried out following the Minimum Information for Publication of Quantitative Real-Time PCR Experiments (MIQE) guidelines. LINC-ROR gene expression was implemented with the following primer sequence (forward: GCCTGAGAGTTGGCATGAAT, and reverse: AAAAC-CTCACTCCCATGTGC) and Syber green master mix. The thermal cycle conditions were as follows: 95°C for 5 min, followed by 15 s at 95°C, 60 s at 60°C, and 1 min at 72°C for 50 cycles. 9 A panel of three endogenous controls was tested in each run (TATA box binding protein (TBP; Hs00427620_m1), beta actin (ACTB; Hs02758991_g1), and glyceraldehyde-3-phosphate dehydrogenase (GAPDH; Hs99999903_m1)24,25 as follows: 95°C for 10 min followed by 40 cycles of 92°C for 15 s and 60°C for 1 min. 26 PCR was carried out in an AB 7500HT instrument (Applied Biosystems). Fold change values of LINC-ROR in cancer compared to non-cancer brain tissues were estimated using Livak equation 2-ΔΔCt. 27 Based on the expression level at a threshold of 2.0-fold change, patients were categorized into high and low expressors.
Methylation-specific PCR of MGMT promoter
Extracted DNA by QIAamp DNA FFPE tissue kit (Cat No. 56404, Qiagen) was subjected to bisulfite treatment using EpiTect Fast DNA Bisulfite Conversion Kit (Cat No. 59824, Qiagen) according to the manufacturer’s instructions with three consecutive steps as follows: denaturations for 5 min at 95°C, incubation for 25 min, 85 min, and 175 min at 60°C. Next, after the cleanup of bisulfite-converted DNA, methylation specific PCR (MSP) was executed via HotStarTaq d-Tect Polymerase (Qiagen, Hilden, Germany) using the following PCR program: activation at 95°C for 10 min, denaturation at 94°C for 15 s, annealing at 59°C for 30 s, extension at 72°C for 30 s for 30–40 cycles and extension at 72°C for 10 min. Identification of the methylation status of the MGMT promoter was determined using 3% agarose gel electrophoresis. 21
Statistical analysis
R software version 3.3.2, GraphPad prism 7, PC-ORD ver. 5, and SPSS ver. 22 were employed for analysis and presentation. Data profiling was tested for outliers and no Log transformation was performed. Two-way agglomerative hierarchical clustering was executed for data exploration. Chi-square (χ2) and Fisher’s exact tests were used for comparison. Correlation analysis by Spearman’s rank test was done. A two-tailed P < 0.05 was considered statistically significant. The area under the curve (AUC) of receiver operating characteristic (ROC) was plotted to the quantified markers (LINC-ROR, caspase 3, and p53). The Kaplan–Meier curve was performed for survival analysis, and Log rank, Breslow, and Tarone-Ware tests were used for factor comparison.
Results
Clinico-pathological characteristics of the study participants
Approximately 75% of patients were males, with a mean age of 52.5±10.1, while 24.6% were females with mean age of 50.57±4.65 (P = 0.489). Supplementary Table 3 demonstrates the baseline characteristics of GB patients according to their overall survival (OS). Female patients displayed better overall survival than males (P = 0.012). The most frequent tumor site was the frontal lobe (n = 27 patients, 47.4%) followed by the temporoparietal region (n = 22 patients, 38.6%). There was no significant difference in survival regarding the MGMT methylation status of specimens (P = 1.00) (Supplementary Table 3).
Correlation analysis between different clinical and pathological variables revealed negative correlations of male sex with tumor site (r = −0.498, P < 0.001), disease progression-free survival (DPS) (r = −0.398, P = 0.002), and OS (r = −0.385, P = 0.003) (Supplementary Table 4).
Stratified analysis by gender and tumor site is depicted in Supplementary Figure 2. Higher frequency of temporo-parietal site was observed in female specimens (P = 0.001). Poor survival was common in males (P = 0.012) and in patients with frontal tumor lesions (P < 0.05) (Supplementary Figure 2). However, caution should be exercised due to the small sample size.
Immunohistochemistry analysis of caspase 3 and p53
Figures 1 and 2 show immunohistochemical expression of cytoplasmic caspase 3 and nuclear p53 proteins in normal and cancer brain tissues. Caspase 3 protein was weakly expressed in 60% of sections of the normal specimens and was not detected in the rest of the sections. In contrast, GB sections showed varying degrees of expression of caspase 3 protein with 24%, 30%, and 16% of cancer sections showing weak, moderate, and strong expression, respectively (P = 0.028); the rest were negative (Figure 1(a)).
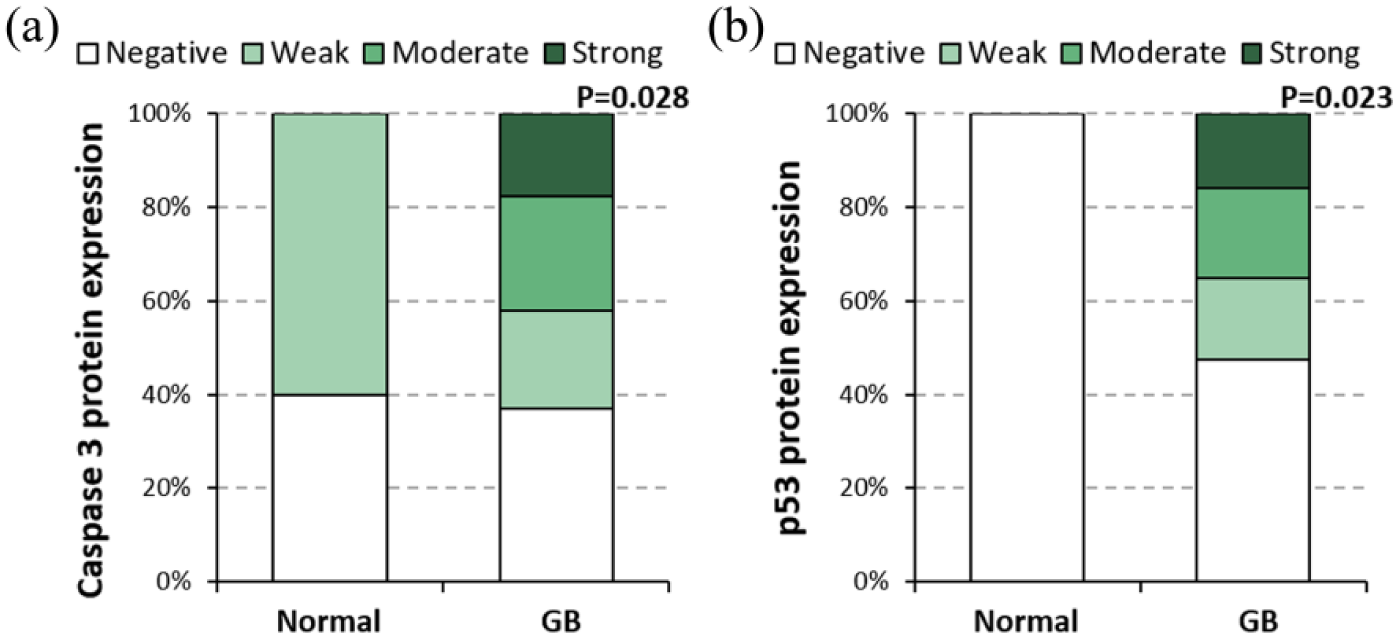
Caspase 3 and p53 protein expression levels in the study samples. Expression levels of caspase 3 (a) and p53 (b) proteins in normal brain and GB samples. Chi-square test was used for comparison between GB and non-cancer tissues (P < 0.05 was considered statistically significant).
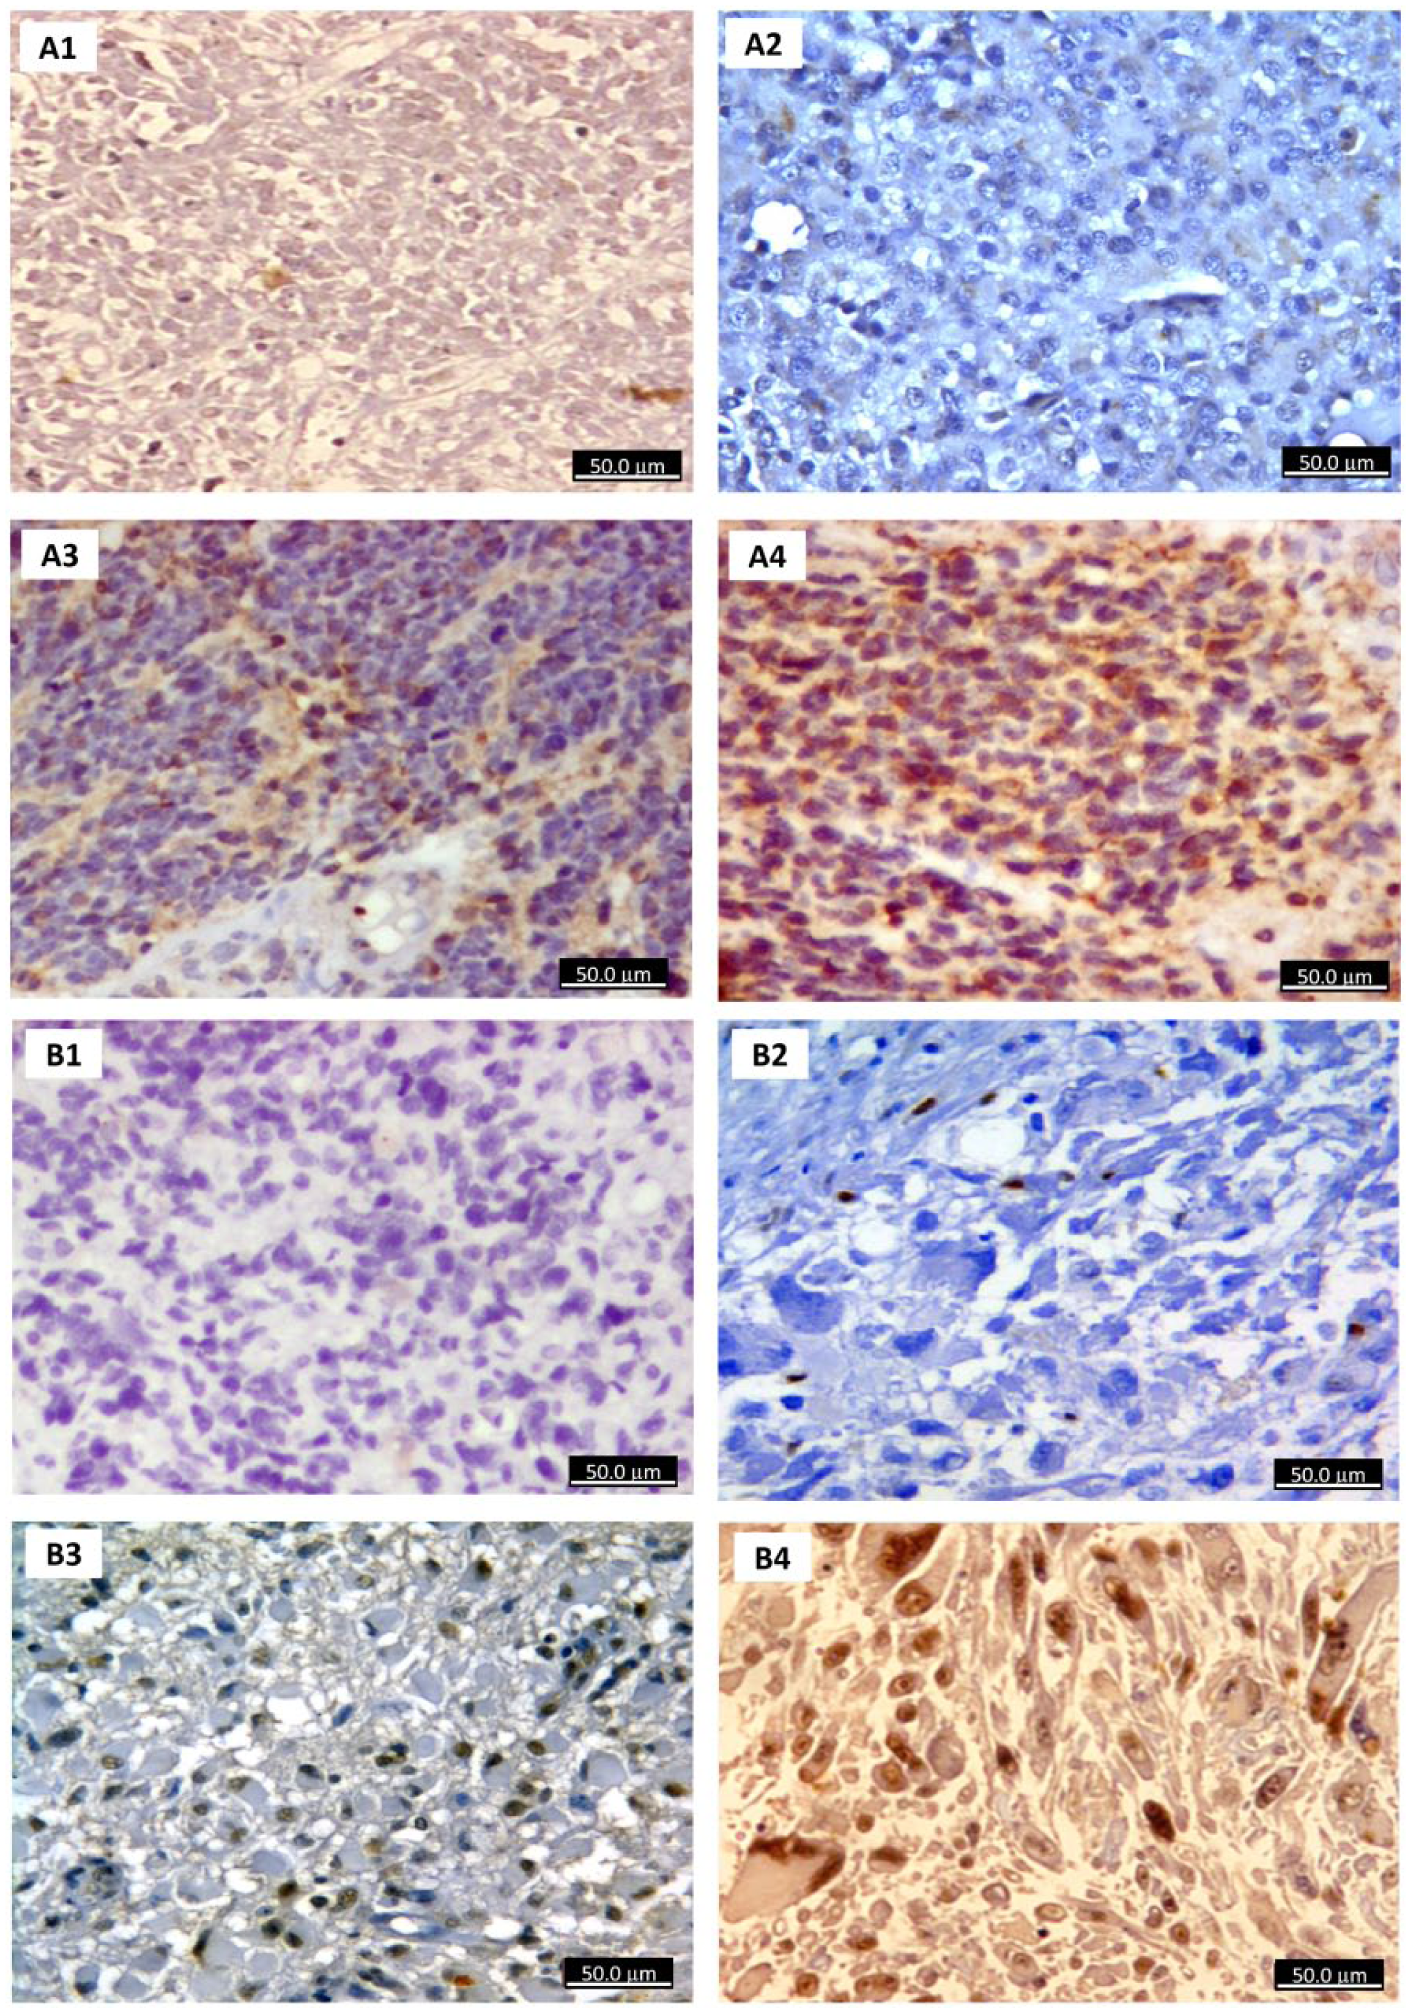
Immunohistochemistry analysis of glioblastoma specimens. (a) IHC staining of GB for caspase 3 antibody revealed negative staining (×400) (photo A1; patient No. 12), scattered weak positive cytoplasmic staining (×400) (photo A2; patient No. 36), focal moderate staining (×400) (photo A3; patient No. 28), and diffuse moderate to strong staining (×400) (photo A4; patient No. 34). (b) IHC staining of GB tissues using p53 antibody showed negative staining for p53 (×400) (photo B1; patient No. 13), negative staining (×400) (photo B2; patient No. 11), moderate positive staining (×400) (photo B3; patient no 27), and strong diffuse positive staining (×400) (photo B4; patient No. 31). Note: In Figure 2, the following parameters were used for determining the degree of immunostaining; if the reaction ⩽ 10%, the specimen was considered negative, while 10%–30%, 31%–70%, and 71%–100% were categorized as weak, moderate, and strong expression, respectively.
In contrast, the nuclear p53 protein was negative in all normal tissues, whereas in GB sections, the expression of p53 was weak in 23%, moderate in 23%, and strong in 21% of the sections (P = 0.023) and the rest were negative (Figure 1(b)).
The high expression of caspase 3 was associated with a younger age of operative resection (P = 0.039) and with MGMT methylation (P = 0.013), while the expression intensity of p53 was significantly associated with higher OS (P = 0.003) (Supplementary Table 5).
Gene expression analysis of LINC-ROR
The TBP gene showed consistent expression levels in both normal and cancer specimens; thus it was used for estimating the fold change of LINC-ROR. The up-regulation of LINC-ROR was encountered in 89.5% of patients, and more than half of them showed marked levels at fold change of > 45.0 (P < 0.001) (Figure 3(a)). Higher expression of LINC-ROR was associated with poor DPS and OS (P = 0.020 and 0.049, respectively), as well as a younger age of patients (P = 0.036) (Figure 3 (b–h)).
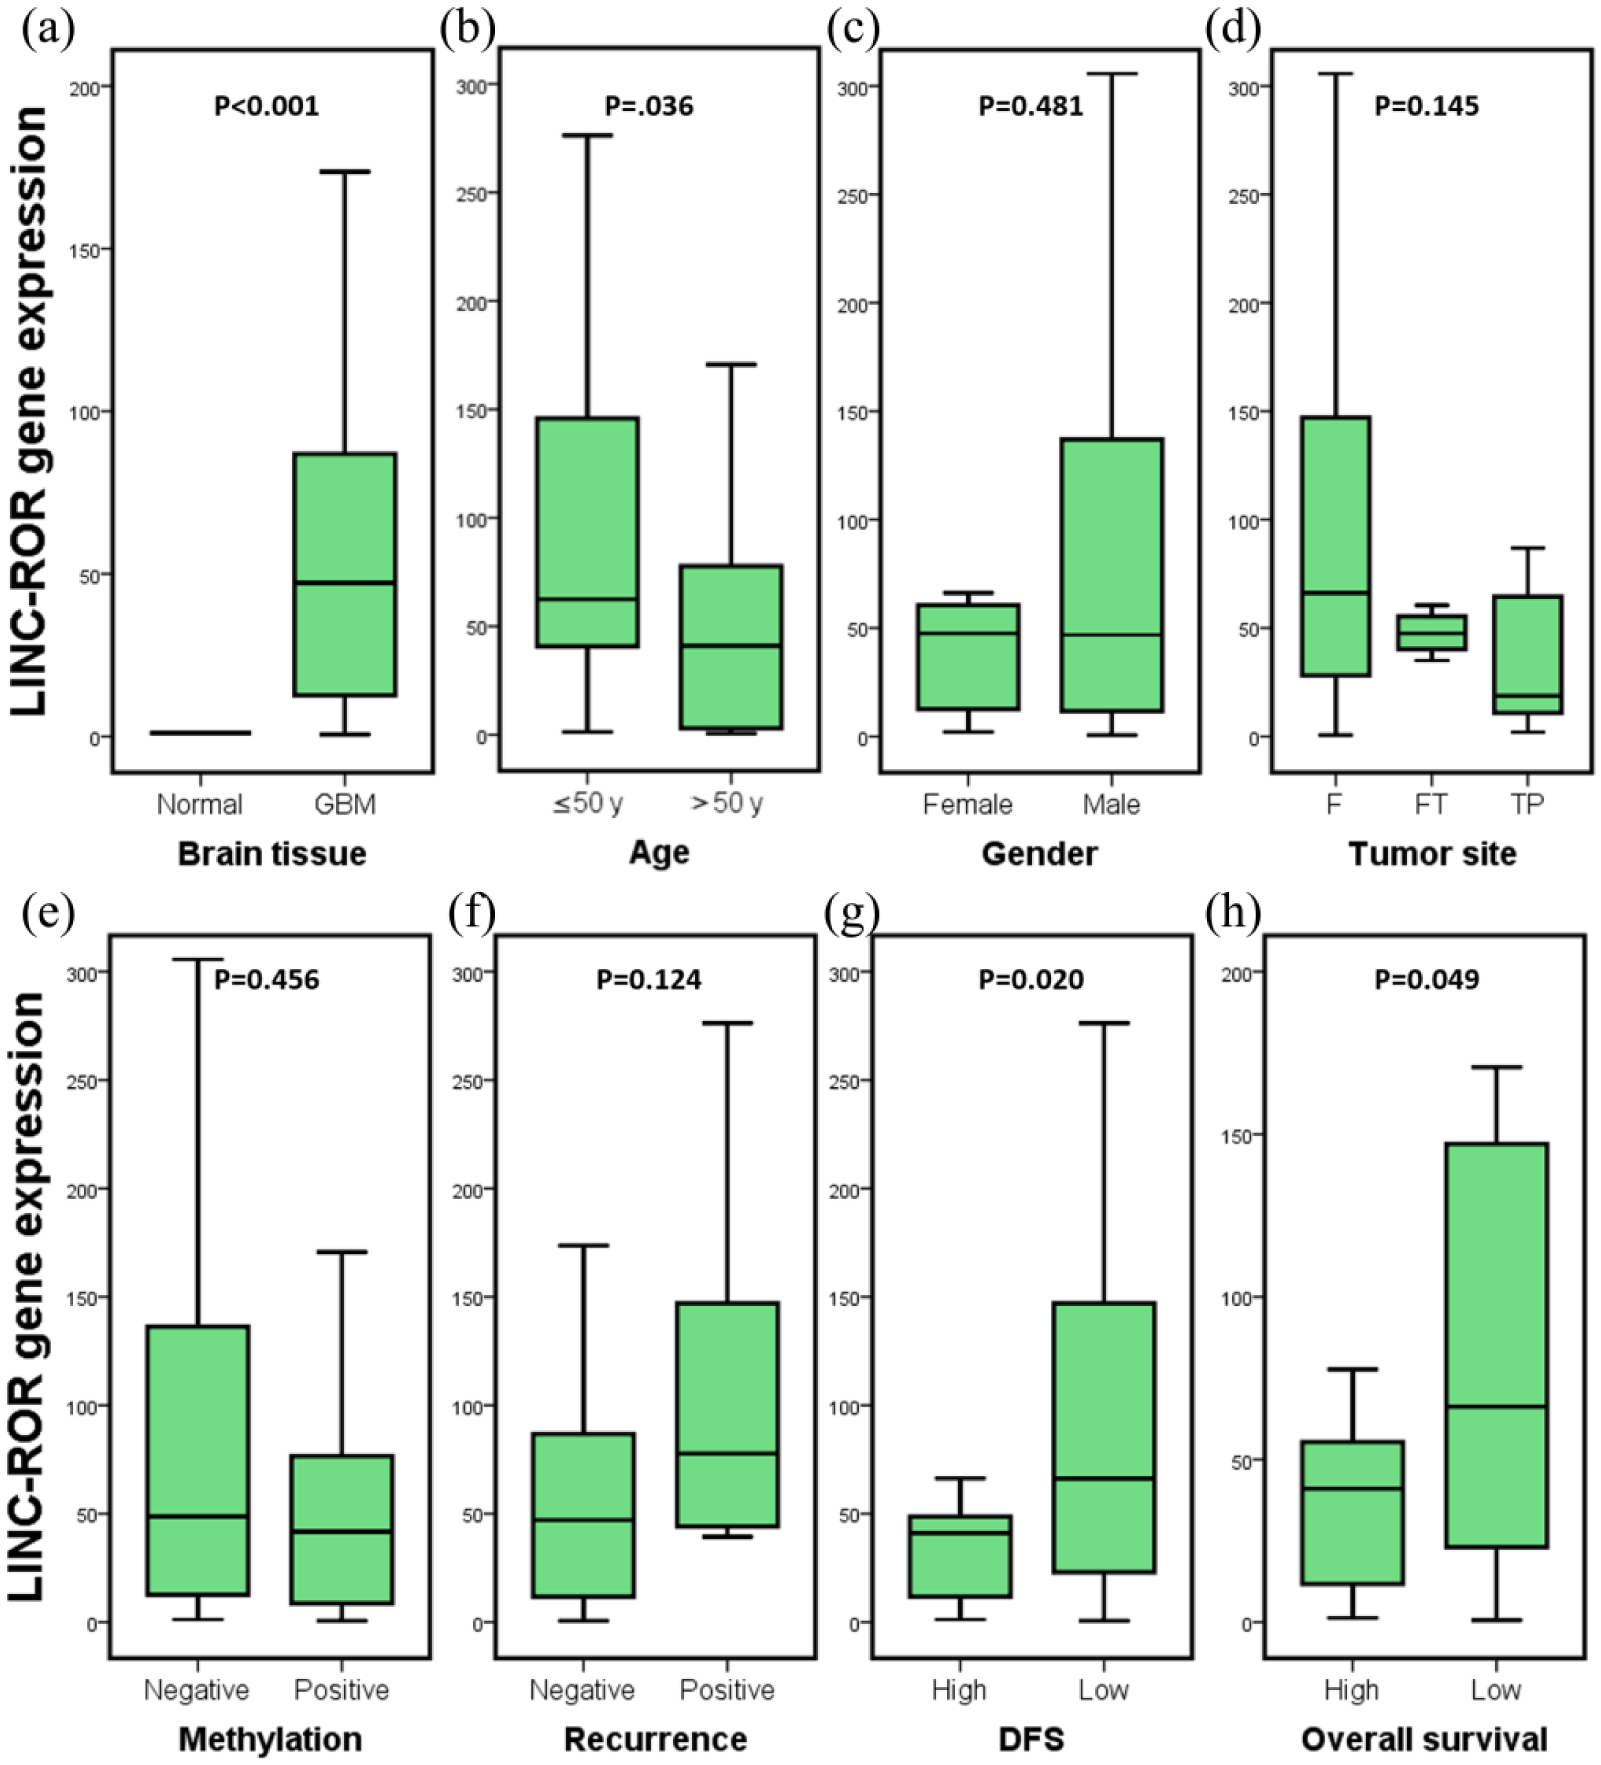
LINC-ROR expression profile.
No correlation was found between the expression levels of LINC-ROR gene expression with caspase 3 (r = 0.121, P = 0.370) nor p53 proteins (r = −0.172, P = 0.200) (data not shown).
Survival analysis
To assess the prognostic value of LINC-ROR signature for predicting lower survival in GB patients, a ROC curve was plotted (Figure 4(a)). LINC-ROR showed the highest significant accuracy (P = 0.049) with AUC = 0.653 and 95% confidence interval 0.501, 0.804 (at a cutoff value of 44.1).
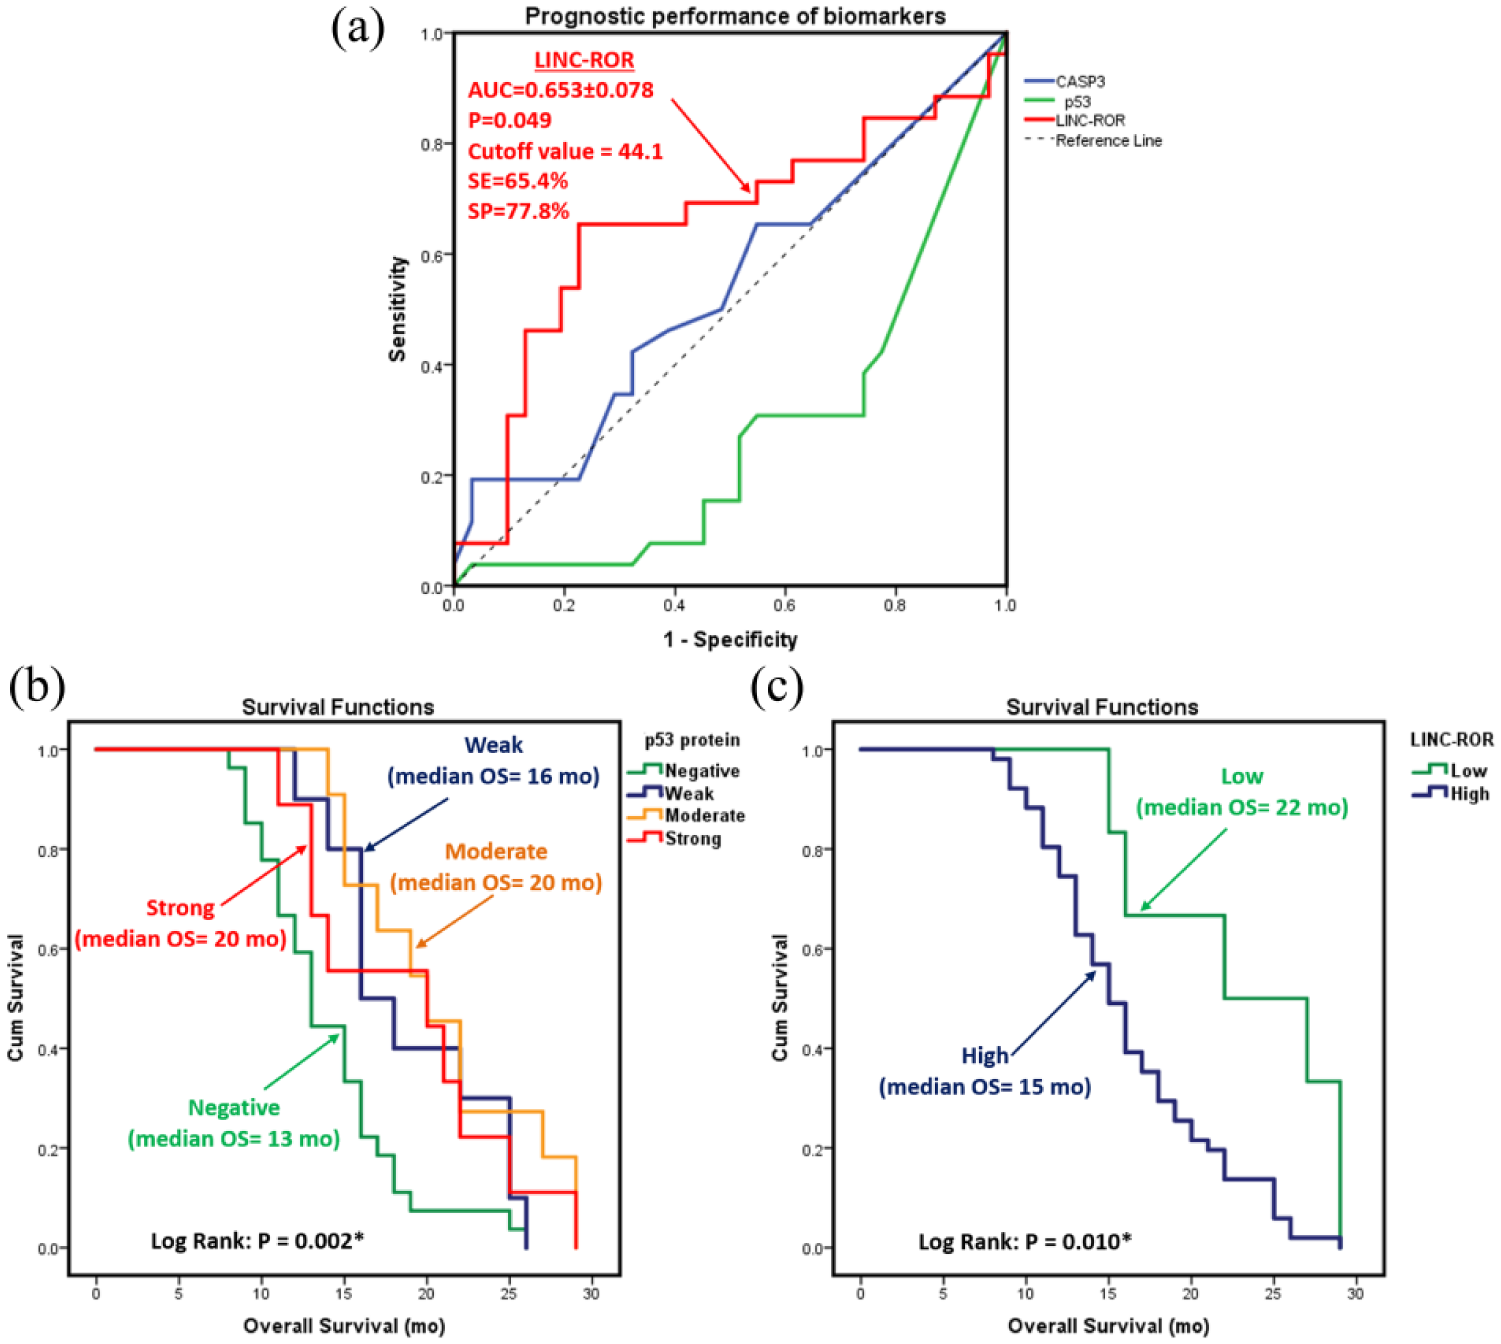
Survival analysis. (a) Prognostic performance of LINC-ROR expression in GB patients. Kaplan-Meier analyses of estimated overall survival (OS) in relation to p53 protein (b) and LINC-ROR gene expression (c) in glioblastoma brain tumors. Values of OS are represented as medians. The logRank test was used for comparison. P53 intensity was classified as negative (⩽ 10%), weak (10%–30%), moderate (31%–70%), and strong (71%–100%). LINC-ROR expression was categorized at a threshold of 2.0 fold change into high and low expressors. AUC, area under the curve of receiver operating characteristic represented as mean and standard error of mean; OS, overall survival; SE, sensitivity; Sp, specificity.
The Kaplan–Meier survival plot illustrated poor survival of GB patients with low p53 (P = 0.002) and high LINC-ROR (P = 0.010) (Figure 4(b) and (c), respectively). Survival analysis also revealed shorter life span in males (P = 0.032) and frontal lobe tumor patients (P=0.024), Table 1.
Survival analysis of glioblastoma patients.
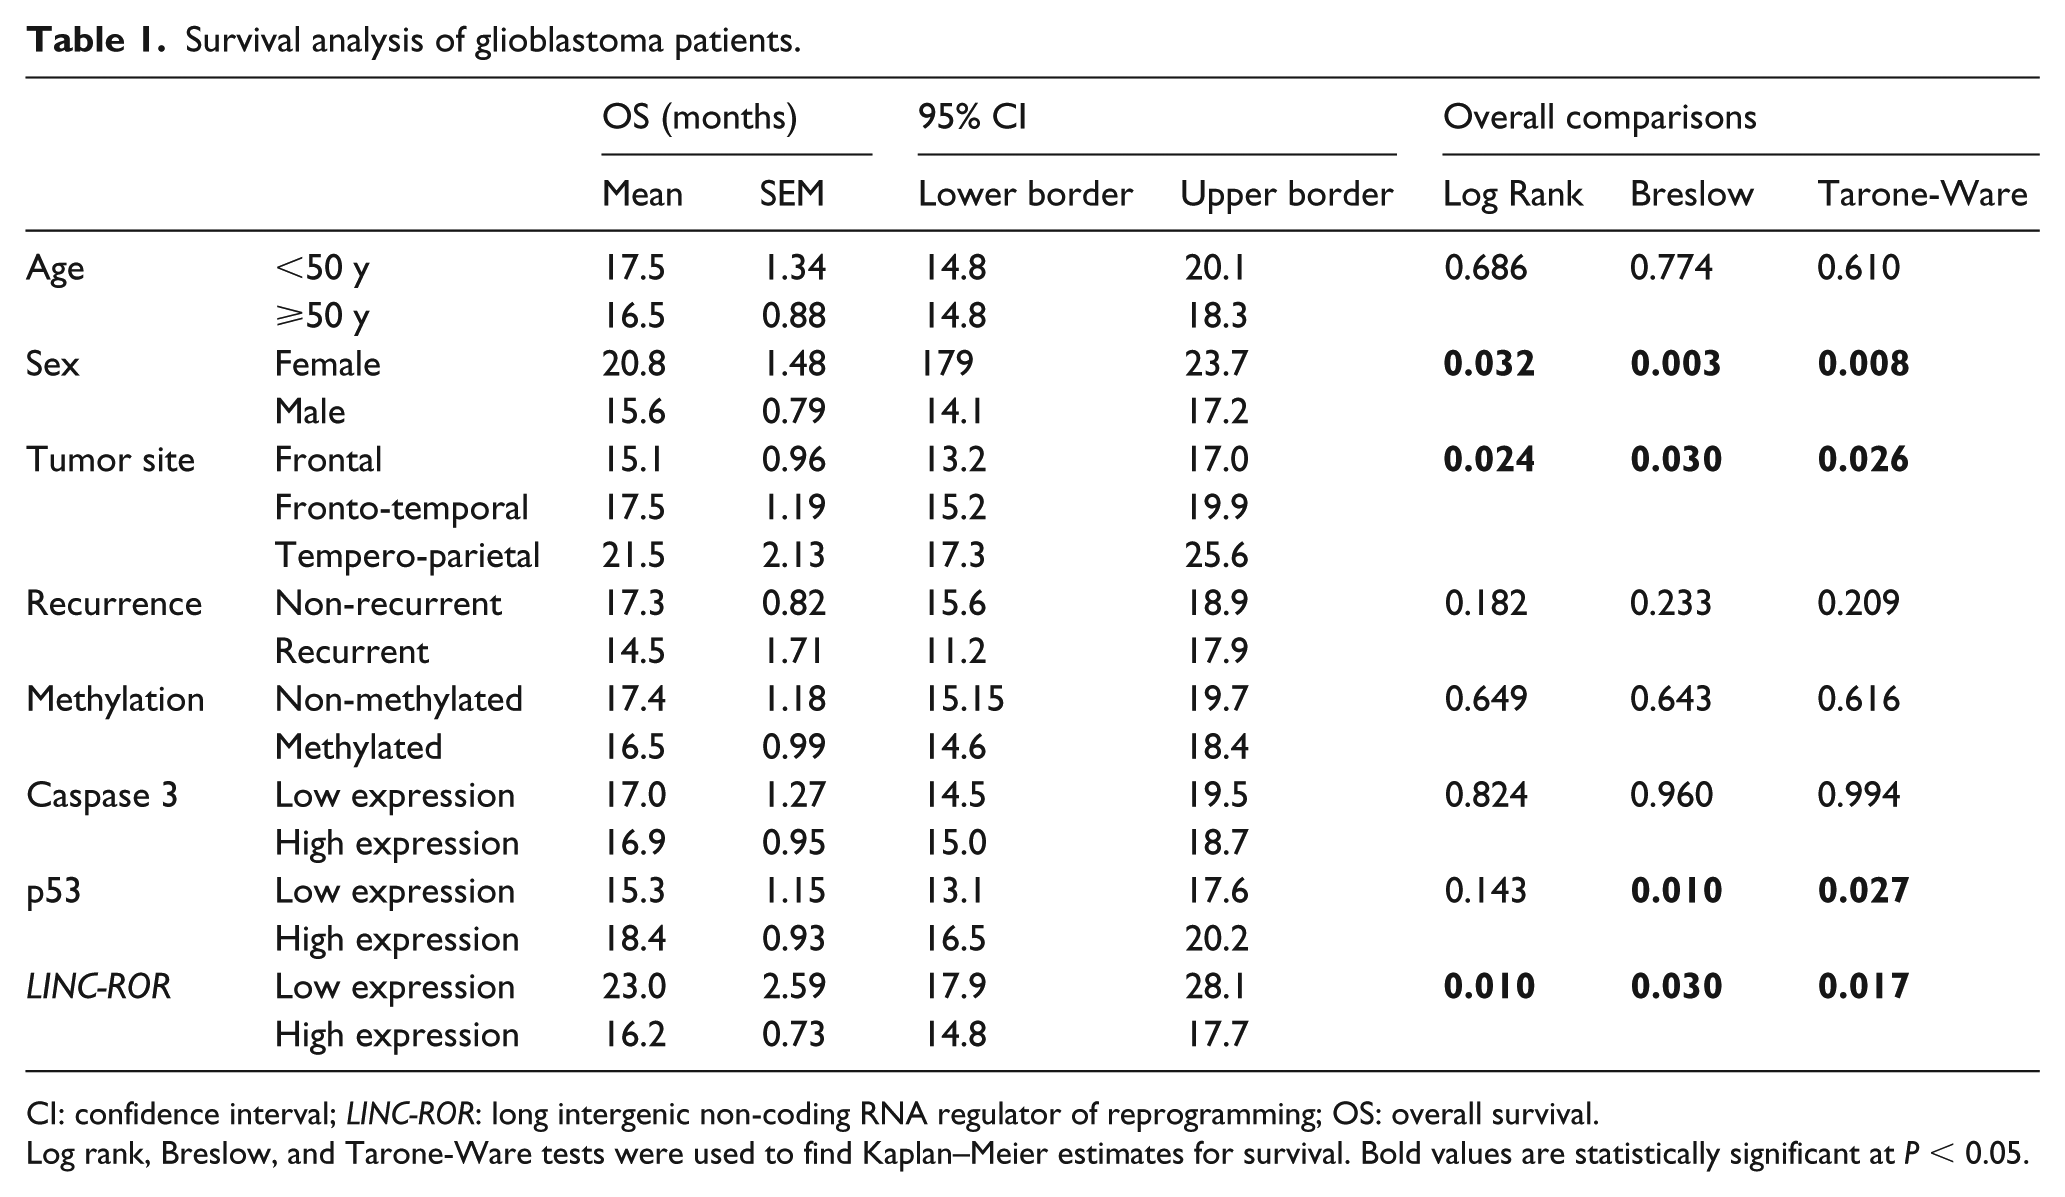
CI: confidence interval; LINC-ROR: long intergenic non-coding RNA regulator of reprogramming; OS: overall survival.
Log rank, Breslow, and Tarone-Ware tests were used to find Kaplan–Meier estimates for survival. Bold values are statistically significant at P < 0.05.
Multivariate analysis
Data exploration by principal component analysis (PCA) revealed two opposing roles of LINC-ROR and p53 where GB patients were clustered into two distinct groups; group one with OS less than 15 months exhibited over-expression of LINC-ROR, whereas group two, with prolonged OS, showed higher levels of p53 staining (Figure 5).
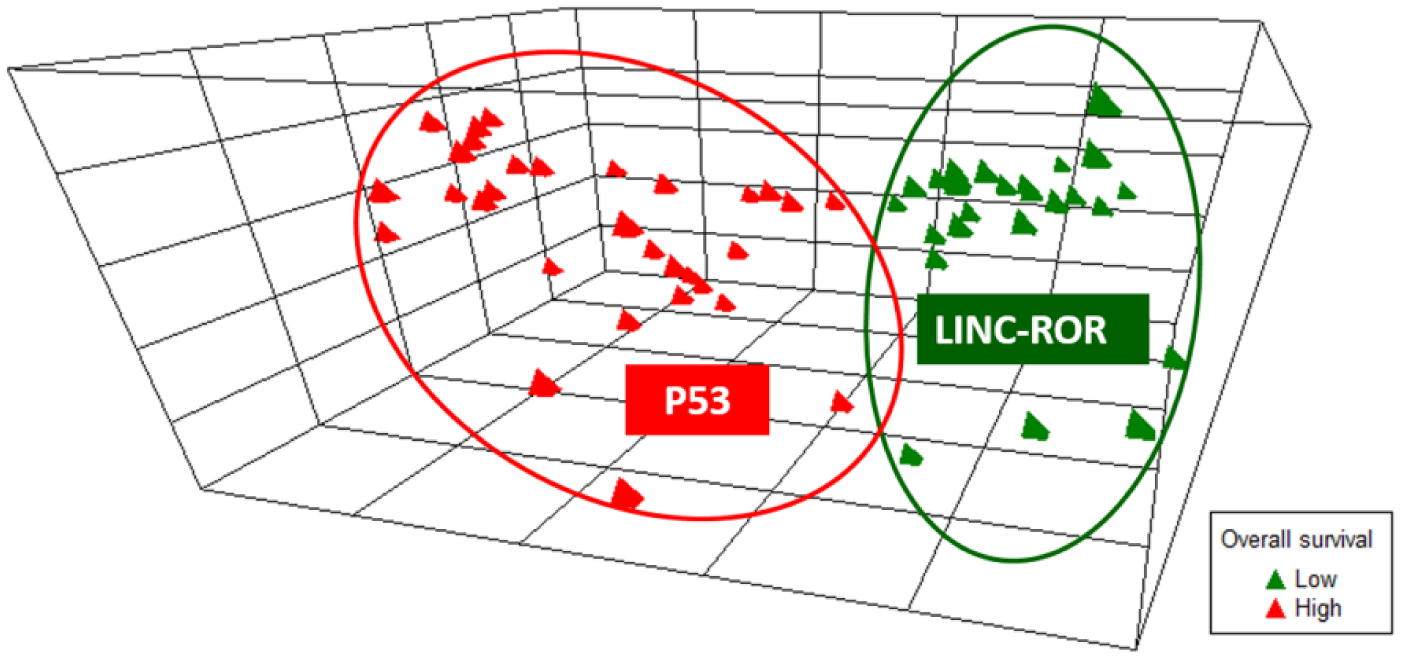
Principal component analysis classifies GB patients according to their expression signature. Multivariate analysis via principal component analysis using nine factors and 57 strands was employed. Axis 1, 2, and 3 explored 35.5%, 14.4%, and 13.4% of the variance, respectively. GB patients were clustered into two distinct groups. One group (green) with a shorter life span was influenced by the elevated expression of LINC-ROR gene expression. In contrast, another group (red) with prolonged overall survival exhibited a high level of p53.
Discussion
lncRNAs are now emerging as potential biomarkers in cancer. LINC-ROR is a newly identified lncRNA that is able to affect the malignant phenotypic features of tumor cells, through affecting many tumorigenic pathways as well as through reprogramming the cells into their undifferentiated state. One pathway regulated by LINC-ROR is p53, which is recognized as a key pathway involved in the pathogenesis of many cancers. 28 The mutation of p53 has been highlighted in GB, but its relation to LINC-ROR in GB has not been previously studied. In this study, we investigated levels of LINC-ROR, and p53, as well as the apoptotic marker caspase 3, and examined their correlation with survival in patients with GB.
Our results showed that LINC-ROR was highly expressed in GB, and was associated with poor survival. In accordance with our results, LINC-ROR levels were overexpressed in cancer tissues of the breast, nasopharynx, pancreas, colon/rectum, gall bladder, and oral tumors compared to their adjacent cancer free tissues.17–19, 29–31 All the aforementioned studies showed a worse prognosis with higher LINC-ROR levels owing to increased proliferation, invasion, and metastasis as well as decreased apoptosis.
Intriguingly, the study by Feng et al., investigating the role of LINC-ROR in gliomas, showed that it was down-regulated in glioma tissues compared to normal adjacent tissue, and the knockdown of LINC-ROR caused an increased proliferation and enhanced glioma stem-cell-forming ability through up-regulating Kruppel-like factor 4 (KLF4). 21 This peculiar contradiction with our study could be primarily attributed to the type of glioma. The Feng et al. study measured LINC-ROR in patients with glioma, as opposed to the current study targeting GB. Glioma encompasses several entities, which are classified according to the cell of origin into astrocytoma, oligodendroglioma, and ependymoma. 32 GB is the most severe entity of gliomas, being a grade IV astrocytoma, which is characterized by the presence of highly undifferentiated cells as well as abundant glioblastoma stem cells (GSCs). 22 (These GSCs represent the main cause of resistance to treatment in GB. 33 ) In addition, the cells that are differentiated in GB have the ability to de-differentiate into GSCs by epigenetic or environmental factors. 34
Since LINC-ROR functions to induce and maintain pluripotency, it is expected that it should be higher in the less differentiated and treatment-resistant form of glioma; that is, GB. Further in support of this postulation is a study that found a marked decrease in LINC-ROR in differentiated embryonic stem cells (ESCs) and a positive correlation of its expression level with the status of ESC undifferentiation.35,36 This indicates that over-expression of LINC-ROR might be one cause of the undifferentiated nature and aggressiveness of GB. 37
Another mechanism of LINC-ROR in tumorigenesis is via the p53 pathway, where Zhang et al. 16 speculated that LINC-ROR could suppress p53 through binding to hnRNP preventing its stimulatory effect on p53 translation. Despite this, IHC expression of p53 in the current study was high in sections of GB compared to none in normal tissues. Multiple studies in various cancers have detected a high p53 protein expression in tumor tissues, owing to p53 mutations that cause the accumulation of a non-functional or even an oncogenic form of the protein.38,39 This was particularly pronounced in GB, where several studies found it to be overexpressed in GB and gliomas,40–44 supporting the over-expression of p53 in the current work.
However, researchers disagree regarding the prognostic significance of p53 in glioma. In our study, we identified a significant association of p53 with patient survival, meaning that higher p53 indicates a better prognosis. Similarly, other studies observed a better survival with p53 over-expression in gliomas and GB.40,41,43,45 Another study demonstrated that p53 mutations are a prognostic indicator in GB. 46 In contrast, several studies found no association between p53 and OS.44,47 The inconsistent results attracted a couple of meta-analyses,42,48 the most recent of which concluded that the p53 IHC expression was associated with OS in glioma patients, 42 the result of which is in line with ours. The basis of the improved survival with elevated p53 is that the non-mutant form (wild type) of p53 can repair the damaged DNA or cause cell apoptosis with irreparable DNA damage, thus preventing more cells from malignant transformation. 49
The final step of the p53-mediated cell death is the release of caspase 3, which is necessary for the apoptotic process in brain cells. 50 In the present study, caspase 3 was expressed in both normal cells and GB cells, but was significantly higher in the latter. While this may seem odd, since it is expected that apoptosis would be reduced in cancer tissue, other studies observed matching results. For example, Bodey et al. 51 detected caspase 3 expression by immunocytochemistry in more than half of GB tumor cells. Also, higher CASP3 gene expression by quantitative reverse transcriptase-PCR and caspase 3 protein by Western blot analysis in GB tissues of untreated patients were reported. 52 Zarnescu et al., 53 who found similar results, suggested that the increased caspase 3 in GB is not adequate to cause apoptosis but instead enhances the motility of GB cells, further increasing cellular migration. A more recent study by Tirapelli et al. 54 demonstrated that caspase 3 levels in GB were lower than BCL2 levels, proposing that anti-apoptotic influences in GB are greater than pro-apoptotic ones. Interestingly, LINC-ROR over-expression was found to increase the activated caspase 3 levels in the bladder cancer cell line, UMUC3; however, apoptosis was inhibited. 55 These findings could further support the assumptions of Zarunescu et al. 53 as well as Tirapelli et al., 54 and could rationalize the high caspase 3 and LINC-ROR levels in the current study.
This study showed that both LINC-ROR and p53 were overexpressed in GB. In this context, it is worthy to note that while LINC-ROR over-expression reduces the p53 level, 14 the increased p53 causes up-regulation of LINC-ROR through inhibiting nuclear factor-erythroid 2-related factor (NRF2). This factor enhances cell survival through its antioxidant function; however, when cells are exposed to stress, the increased p53 inhibits NRF2, favoring apoptosis. NRF2 happens to be a direct repressor of LINC-ROR; thus NRF2 inhibition causes LINC-ROR up-regulation. 56 Therefore, the increased p53 might be a cause of increased LINC-ROR in GB. In contrast, increased caspase 3 is probably a result of the increased LINC-ROR. Despite the high expression of LINC-ROR and p53 in our study, there was no correlation between the two, which may be secondary to the limited sample size. Therefore, further studies with larger sample sizes are required to uncover the exact pathological roles and interactions of LINC-ROR and p53 in GB.
Conclusion
Taken together, the current findings showed an up-regulation of LINC-ROR, p53, and caspase 3 in GB patients. Targeting LINC-ROR pathways can provide a future therapeutic option for patients with GB.
Supplemental Material
Supplementary_Figures – Supplemental material for Expression of long intergenic non-coding RNA, regulator of reprogramming, and its prognostic value in patients with glioblastoma
Supplemental material, Supplementary_Figures for Expression of long intergenic non-coding RNA, regulator of reprogramming, and its prognostic value in patients with glioblastoma by Eman A. Toraih, Aya El-Wazir, Mohammad H. Hussein, Moataz S. Khashana, Amgad Matter, Manal S. Fawzy and Somaya Hosny in The International Journal of Biological Markers
Supplemental Material
Supplementary_Tables – Supplemental material for Expression of long intergenic non-coding RNA, regulator of reprogramming, and its prognostic value in patients with glioblastoma
Supplemental material, Supplementary_Tables for Expression of long intergenic non-coding RNA, regulator of reprogramming, and its prognostic value in patients with glioblastoma by Eman A. Toraih, Aya El-Wazir, Mohammad H. Hussein, Moataz S. Khashana, Amgad Matter, Manal S. Fawzy and Somaya Hosny in The International Journal of Biological Markers
Footnotes
Acknowledgements
The authors thank the Center of Excellence in Molecular and Cellular Medicine and the Oncology Diagnostic Unit, Suez Canal University, Ismailia, Egypt for providing the facilities for performing the research work. The authors acknowledge Dr. Afaf T. Ibrahiem, Lecturer of Pathology, Faculty of Medicine, Mansoura University, Egypt, for help in photomicrography and histopathological examination.
Declaration of conflicting interest
The author(s) declared no potential conflicts of interest with respect to the research, authorship, and/or publication of this article.
Funding
The author(s) received no financial support for the research, authorship, and/or publication of this article.
Supplemental material
The manuscript contains online only supplementary materials.
References
Supplementary Material
Please find the following supplemental material available below.
For Open Access articles published under a Creative Commons License, all supplemental material carries the same license as the article it is associated with.
For non-Open Access articles published, all supplemental material carries a non-exclusive license, and permission requests for re-use of supplemental material or any part of supplemental material shall be sent directly to the copyright owner as specified in the copyright notice associated with the article.