
Abstract
Background:
Thyroid carcinomas have comprised the fastest rising incidence of cancer in the past decade. Currently, the diagnosis of thyroid tumors is performed by the fine-needle aspiration biopsy (FNAB) method, which still holds some challenges and limitations, mostly in discriminating malignant and benign lesions. Therefore, the development of molecular markers to distinguish between these lesion types are in progress.
Methods:
A 2D-PAGE separation of proteins was performed followed by tandem mass spectrometry with the aim of discovering potential serum protein markers for papillary thyroid carcinoma and multinodular goiter. Protein–protein interaction network analysis revealed the most important pathways involved in the progression of papillary thyroid cancer. The enzyme-linked immunosorbent assay method was used to confirm a part of the results.
Results:
The significantly altered proteins included C3, C4A, GC, HP, TTR, APOA4, APOH, ORM2, KRT10, AHSG, IGKV3-20, and IGKC. We also confirmed that increased complement component 3 and decreased apolipoprotein A4 occurred in papillary thyroid cancer. Network investigations demonstrated that complement activation cascades and PPAR signaling might play a role in the pathogenesis of thyroid cancer.
Conclusion:
The results demonstrated that serum proteomics could serve as a viable method for proposing novel potential markers for thyroid tumors. Surely, further research must be performed in larger cohorts to validate the results.
Introduction
Thyroid carcinomas (TCs) are the most common malignancy of the endocrine system with increasing incidence worldwide. 1 In 2017, approximately 56,870 new TC cases were diagnosed and it was the fifth most prevalent cancer in women in the United States. 2 Papillary thyroid carcinoma (PTC) accounts for more than 80% of TC cases. Current diagnostic tools include ultrasonography and fine-needle aspiration biopsy (FNAB), which is the gold standard for the diagnosis of thyroid nodules, followed by thyroidectomy surgery to pathologically confirm the results. 3 However, FNA may lead to indeterminate results in about 30% of the cases, or may provide insufficient samples for diagnosis. Also, it may be needed to be performed repeatedly, 4 which is annoying for some patients besides the fact that many of the benign cases may undergo unnecessary surgeries. For these reasons, the development of molecular markers—especially those found in biological fluids—could be very helpful for the diagnosis of malignant and benign thyroid nodules. 5 Recently, several studies were conducted to find biomarkers for PTC through systemic studies and many genomics, proteomics, or metabolomics investigations were performed leading to the introduction of various potential markers for the disease.6,7 For instance, BRAF, RAS, cytokeratin 19, RET/PTC, NTRK1, DORA1, MET, FN1, ITPR1, and CDH16 were from the identified putative markers for TC. 8 However, there is still a long way to go to find more specific and sensitive markers for TC, besides the fact that the exact mechanisms of the disease are still not well understood. Therefore, in the current study, we investigated the global expression of proteins through a serum proteomic study using two-dimensional polyacrylamide gel electrophoresis (2D-PAGE) followed by identification of the significantly altered proteins by liquid chromatography-tandem mass spectrometry (LC-MS/MS) in PTC as malignant, multinodular goiter (MNG), as a benign thyroid lesion, and healthy controls. We then constructed an interaction network for PTC to more understand the underlying mechanisms in the progression of thyroid cancer. We also confirmed two potential protein markers using the enzyme-linked immunosorbent assay.
Materials and methods
Participants and sample collection
A total of 17 patients newly diagnosed with PTC, 17 patients with MNG, and 20 age- and gender-matched healthy controls participated in the study. Demographic characteristics of the study participants are shown in Supplementary Table 1. This study was approved by the clinical ethics committee of the Shahid Beheshti University of Medical Sciences. All the participants provided written informed consent to enter the study. Patients were from stages I and II of thyroid cancer according to the tumor node metastasis (TNM) staging system. Malignant and benign lesions were confirmed histopathologically after thyroidectomy surgery following the initial FNA and ultrasonography results. The exclusion criteria were: (a) smokers; (b) patients suffering from diabetes; (c) patients who’ve had acute infections in the last 2 months; and (d) patients with a history of any other type of cancer. Fasting blood samples were collected early in the morning using vacutainer tubes in the Department of Surgery, Shariati Hospital. Blood samples remained 1h in the refrigerator and were then centrifuged at 3000 g for 10 min at 4°C. The supernatant serum was aliquoted and kept at −80°C until it was used.
Two-dimensional gel electrophoresis
For two-dimensional gel electrophoresis (2-DE) analysis, frozen serum samples were gradually thawed on ice and vortexed. The protein content of the samples was assayed using the 2-D Quant kit (according to the manufacturer’s manual) and was repeated three times for each sample. For 2-DE analysis, the samples were pooled in each study group and each analysis was performed in three replicates. Serum volumes corresponding to 1200 μg proteins were used to run the isoelectric focusing (IEF) step. The samples were diluted by the rehydration buffer containing 7 M urea, 2 M thiourea, 2% (v/v) CHAPS, 0.5% (v/v) ampholyte, 40 mM DTT, and 0.002% bromophenol blue. The diluted serum samples were loaded on 11 cm, 4-7 pH gradient IPG strips and remained 30 minutes to completely absorb the buffer. The samples were then placed in the SERVA IPGphore overnight with the following settings: overnight temperature 20°C, step1: step 150v 3h, step2: step 300v 3h, step3: gradient 1000v 6h, step4: gradient 1000v 1h, step5: step 12,000v 1h. After the IEF was finished, immobilized pH gradient (IPG) strips were put in the tray and 2.5 mL equilibrium buffer was added to each strip. The equilibrium buffer contained DTT and urea, which was left for 15 min on IPG strips. In the next step, 2.5 mL of another buffer containing urea and iodoacetamide was added to each IPG strip and left again for 15 min. The second 2-DE (SDS-PAGE) was performed using the FlatTop Tower instrument (SERVA). Afterwards, 1.5 mL of the cooling fluid was applied to the ceramic cooling plates, and 25 mL of the anode and cathode buffers were added. The IPG strips were placed on the gels and 5 mL of the ladder (E3210-01 EURx, Poland) was applied. After the SDS-PAGE was finished, the gels were placed in a container of the Coomassie blue dye (3L including 0.3 g Coomassie R250, 18 mL orthophosphoric acid, 90 mL acetic acid) and were heated for 2 h at 40°C. Acetic acid 10% was used to remove the dye overnight. The gels were then scanned by the Biorad scanner using Quantity One software. The obtained 2-D gel images are shown in Figure 1. The images were analyzed by the Progenesis SameSpots software. This process included quality control of the images, selecting a reference image to be aligned with other images, log normalization of the gels due to the large dynamic range of proteins, spot detection, and statistical analyses. The normalized spot volumes are shown in Supplementary Figure 1. Student t-test and fold changes were used to specify the significantly altered protein spots between groups. P-values less than 0.05 and fold changes more than two were assumed to be significant. These spots were then excised and sent for the identification by tandem mass spectrometry (LC-MS/MS).
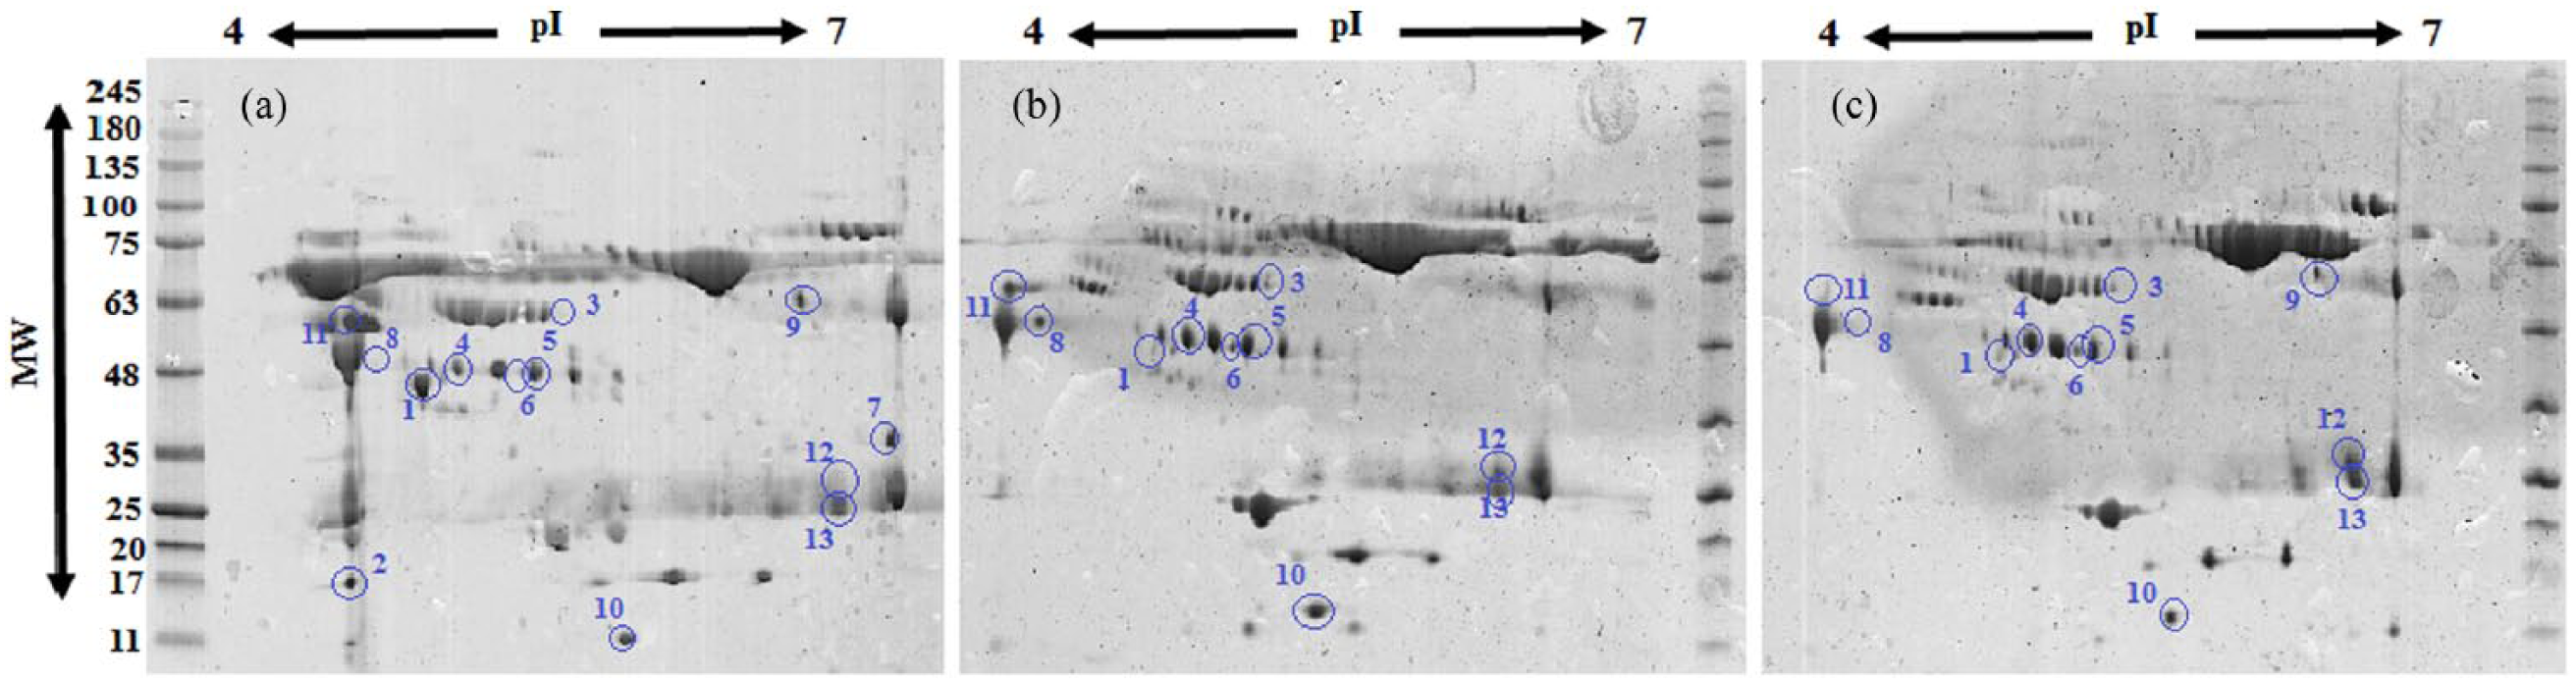
Representative 2D-PAGE analysis results for (a) PTC, (b) normal, and (c) MNG groups.
MALDI-TOF-TOF mass spectrometry
The significant protein spots were identified by mass spectrometry. LC-MS/MS analysis was performed at York University, UK, using the MALDI-TOF-TOF Ultraflex instrument. The spots were destained using ammonium carbonate in acetonitrile solution. The proteins were digested using trypsin and were carbamidomethylated at cysteine residues. The peptides from the tandem mass spectra were then blasted against the National Center for Biotechnology Information database using the Mascot online server at http://www.matrixscience.com/. Mascot search features were: enzyme = trypsin, fixed modifications = carbamidomethyl(C), variable modifications = deamidated(NQ), oxidation(M), max missed cleavages = 1, fragment mass tolerance = ±0.5 Da, peptide mass tolerance = ±50 ppm, mass value= monoisotopic.
Enzyme-linked immunosorbent assay
From the significantly altered proteins, increased levels of complement component 3 and decreased levels of apolipoprotein A4 were confirmed using an enzyme-linked immunosorbent assay (ELISA). Sandwich ELISA kits with the catalog number of MBS2021588 for C3 and MBS931130 for APOA4 were purchased from MyBioSource, USA. The analysis was performed according to the manufacturer’s instructions. Briefly, the protocol was: after dilution of the serum samples with sample diluent, the standards and the samples were incubated in each plate well for 1 h at 37°C, the repeated wash process was performed, then HRP conjugate was added followed by another 1 h incubation and TMB substrate addition with another 20 min incubation. Then a stop solution was added and the plates were immediately read at 540 and 570 nm for APOA4, and at 450 nm for complement C3, using BioTek EL-X800 plate reader and gen5 software. The analysis was performed in duplicate. The absorbance was plotted against concentrations and the standard curves were created. The concentrations of C3 and APOA4 were evaluated using the standard curve equation.
Pathway analysis
A protein–protein interaction network was constructed for PTC using the differentially expressed proteins, by the STRING server. 9 The resulting network was displayed in Cytoscape software. The network was clustered by MCODE application, and the pathway analysis was performed for both the whole network and each subnetwork by the ClueGO application using Kyoto Encyclopedia of Genes and Genomes (KEGG) as the reference database.
Results
The differentially expressed proteins, which were identified by MALDI-TOF-TOF mass spectrometry, included 12 proteins (detailed in Table 1 and Figure 2) as follows: complement component 3 (C3), complement component C4a (C4A), cytokeratin 10 (KRT10), beta-2-glycoprotein 1 (APOH), vitamin D-binding protein (GC), haptoglobin (HP), transthyretin (TTR), apolipoprotein A4 (APOA4), alpha-1-acidglycoprotein2 (ORM2), alpha-2-HS-glycoprotein (AHSG), Immunoglobulin kappa variable 3-20 (IGKV3-20), and immunoglobulin kappa constant (IGKC). We compared these proteins in each sample set, including PTC versus MNG, PTC versus healthy subjects, and MNG versus healthy subjects. The results are shown in Table 2. According to the results, in PTC versus healthy subjects, the up-regulation of C3, KRT10, C4A, and APOH, and the down-regulation of GC, HP, APOH, ORM2, and TTR were observed. In the PTC versus MNG group, increased C3, KRT10, C4A, and AHSG, and decreased GC, HP, APOA4, IGKV3-20, and IGKC were found. A comparison of MNG and normal groups also yielded the up-regulation of APOH, IGKV3-20, and IGKC, and the decrement of AHSG, TTR, and ORM2. The protein–protein interaction network was then constructed to seek the most significant pathways involved in the pathogenesis of PTC (see Supplementary Figure 2). According to the KEGG pathway enrichment results, the complement and coagulation cascades (P-value=8.2E-41), PPAR signaling pathway (P-value=0.0023), vitamin digestion and absorption (P-value=0.00092), and the complement activation (P-value=8.5E-18) were the most important pathways involved in the pathogenesis of PTC. The sub-networks also played important roles in the complement activation cascades. The ELISA results (Figure 3), also showed that the C3 level was significantly higher in the PTC samples compared to the MNG and normal groups, with a two-fold increase. APOA4 also had a significant decrease in PTC compared to MNG and healthy controls.
The differentially expressed proteins identified by MALDI-TOF-TOF.
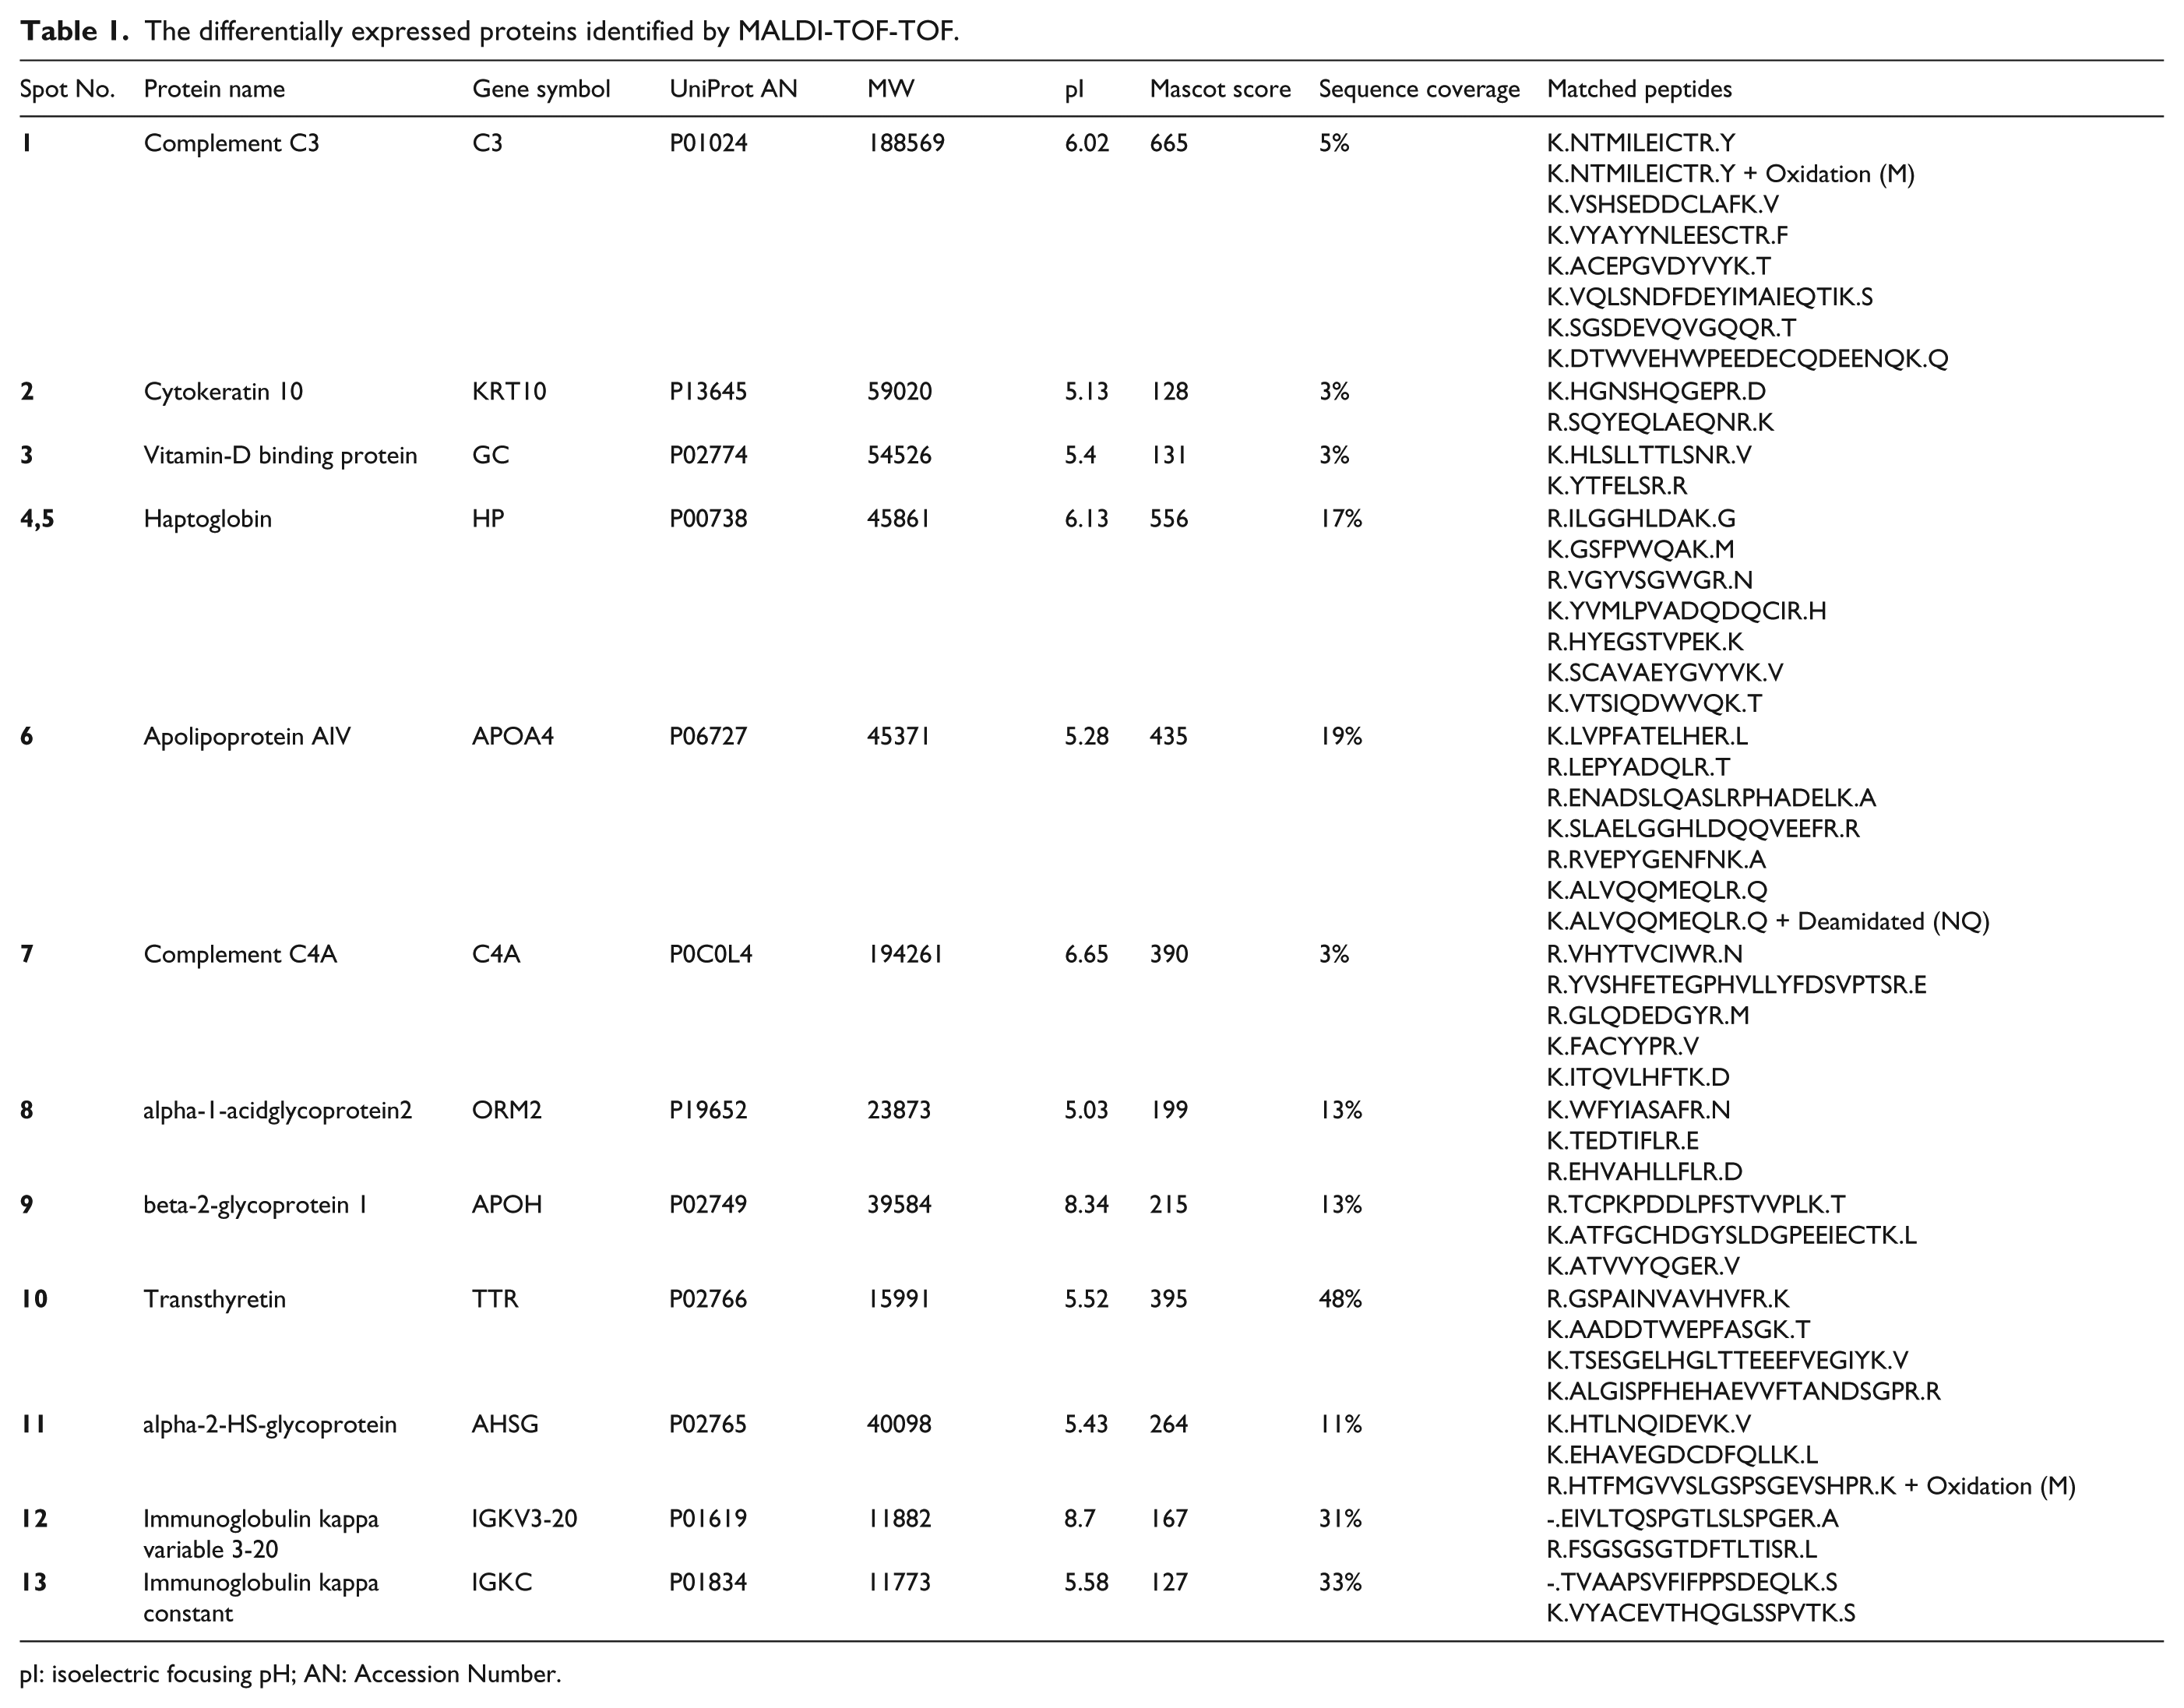
pI: isoelectric focusing pH; AN: Accession Number.
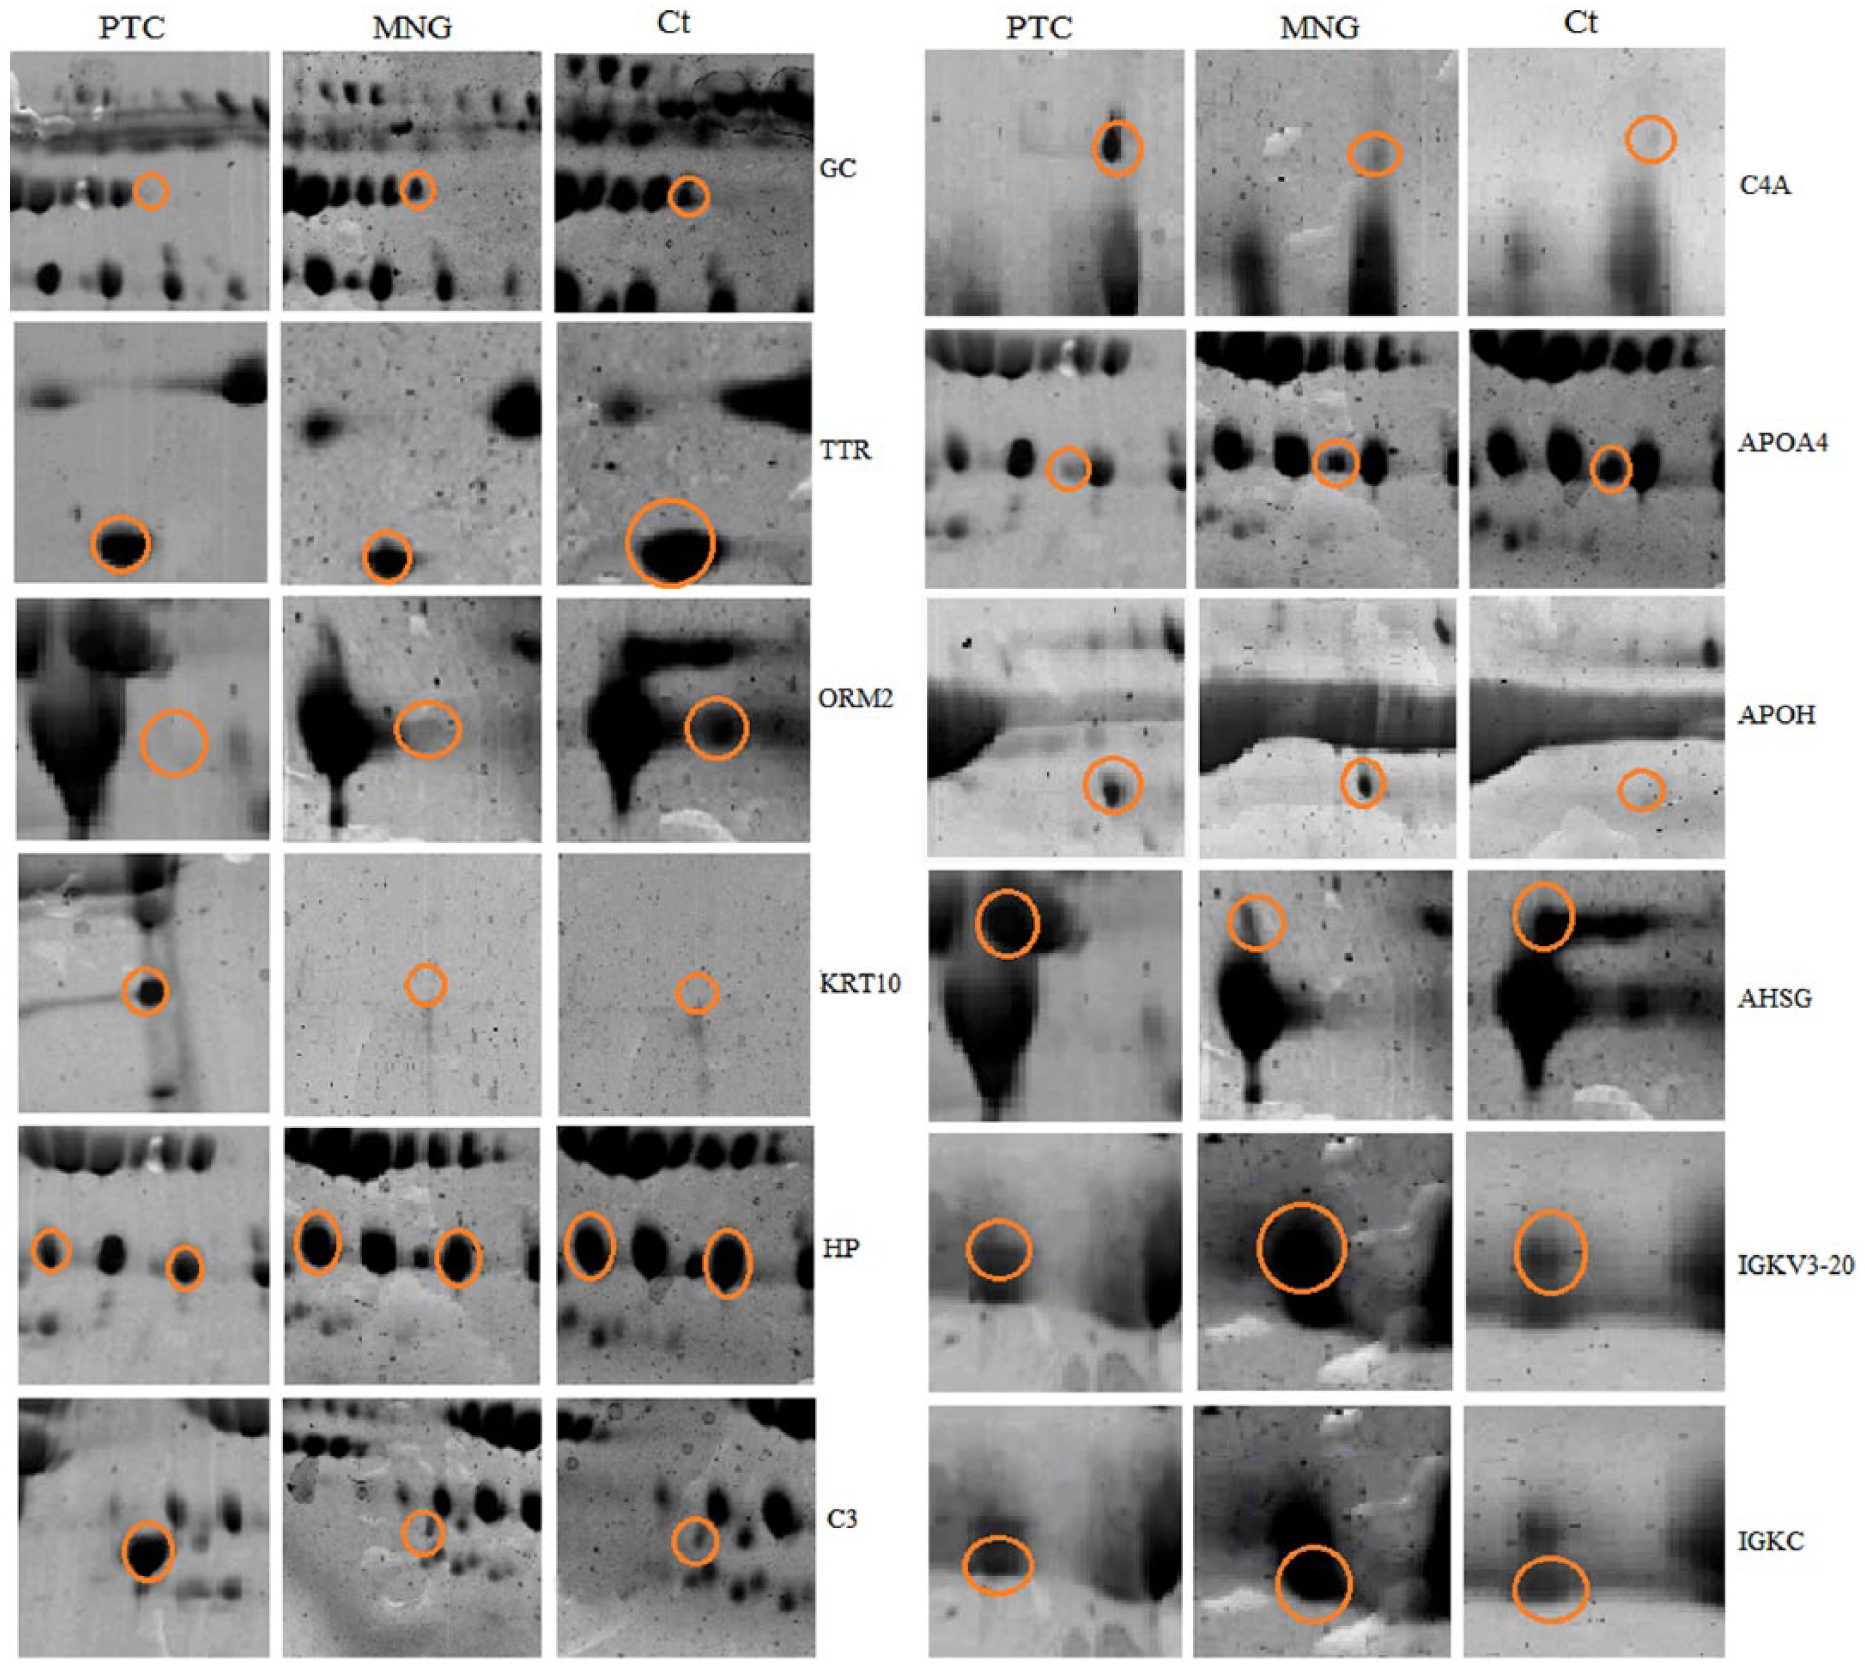
Differentially expressed protein spots between PTC, MNG, and healthy controls revealed by two-dimensional polyacrylamide gel electrophoresis stained with Coomassie dye.
Comparison of the differentially expressed proteins between the study groups.
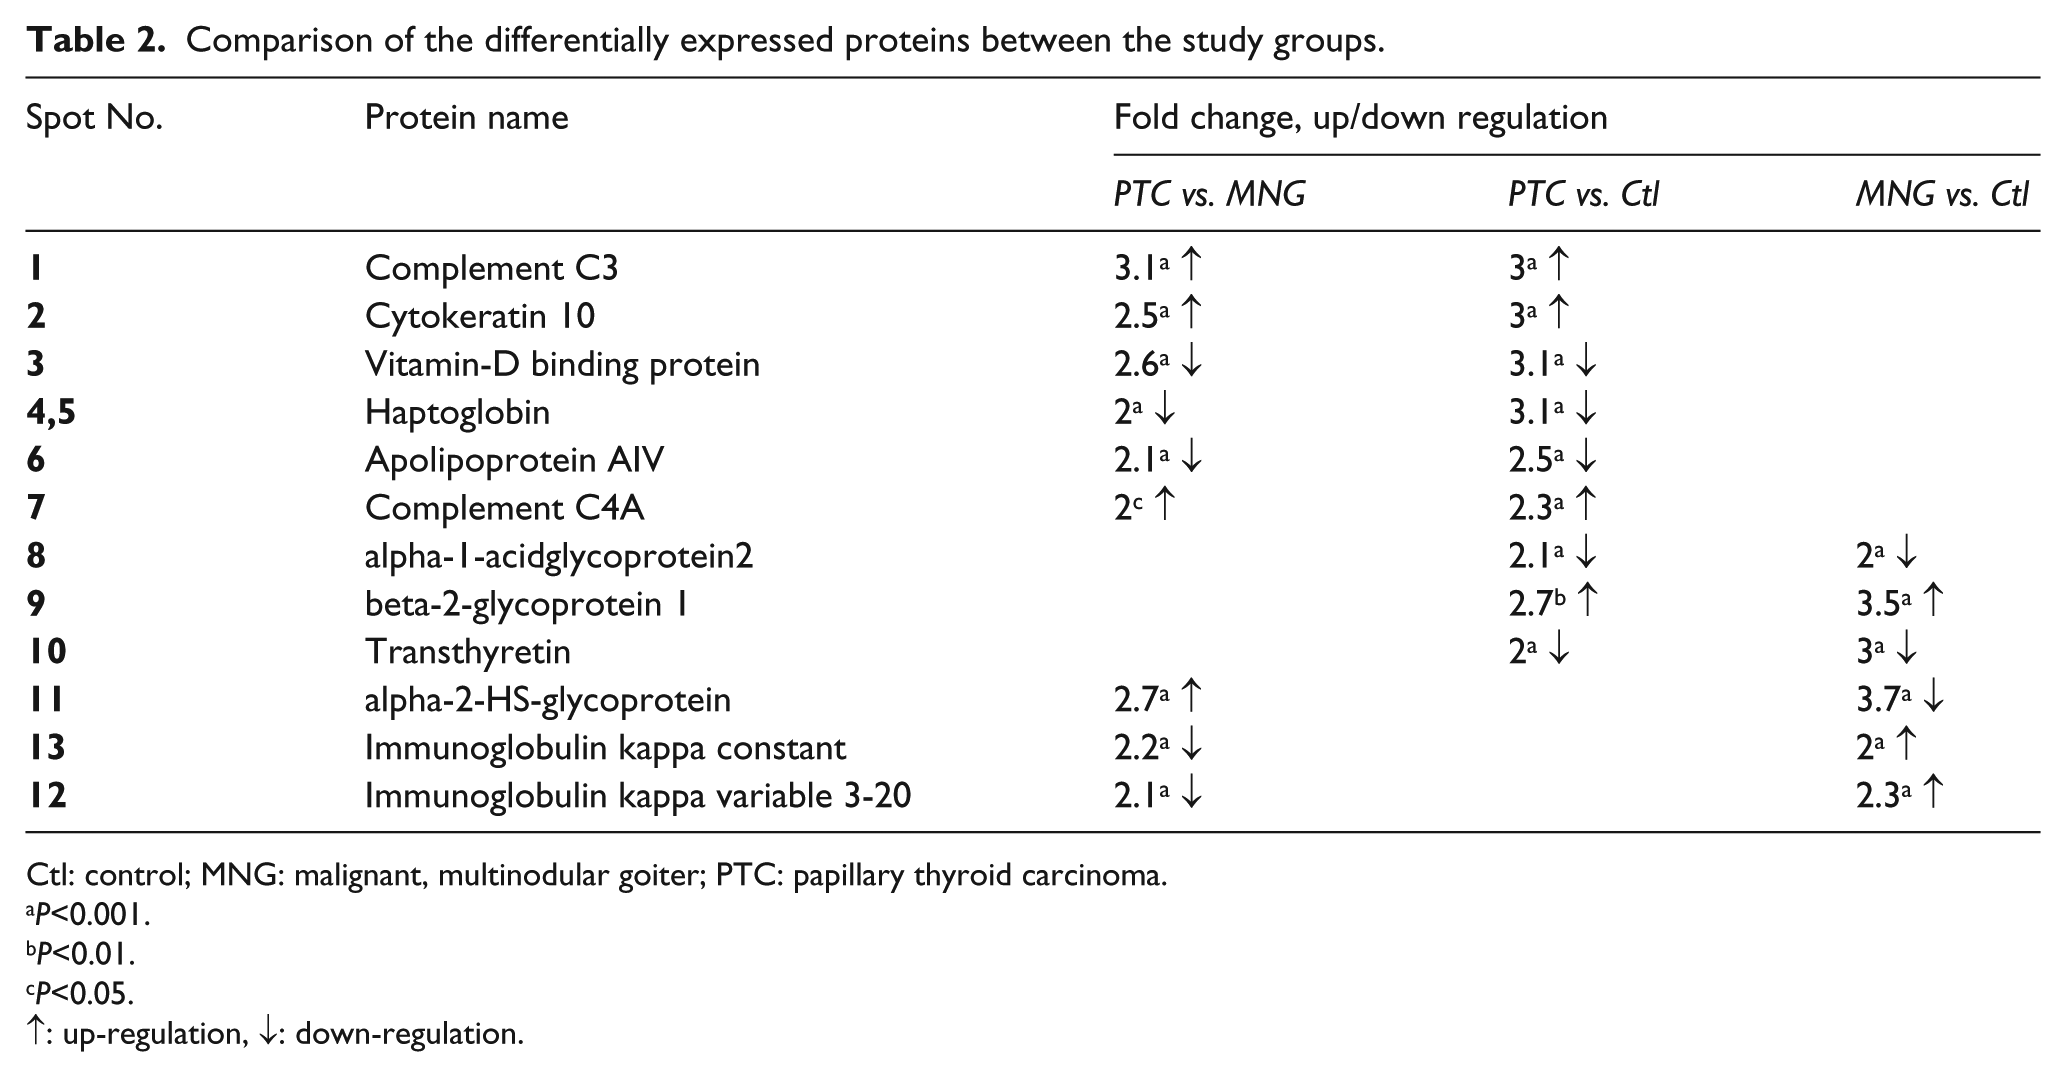
Ctl: control; MNG: malignant, multinodular goiter; PTC: papillary thyroid carcinoma.
P<0.001.
P<0.01.
P<0.05.
↑: up-regulation, ↓: down-regulation.
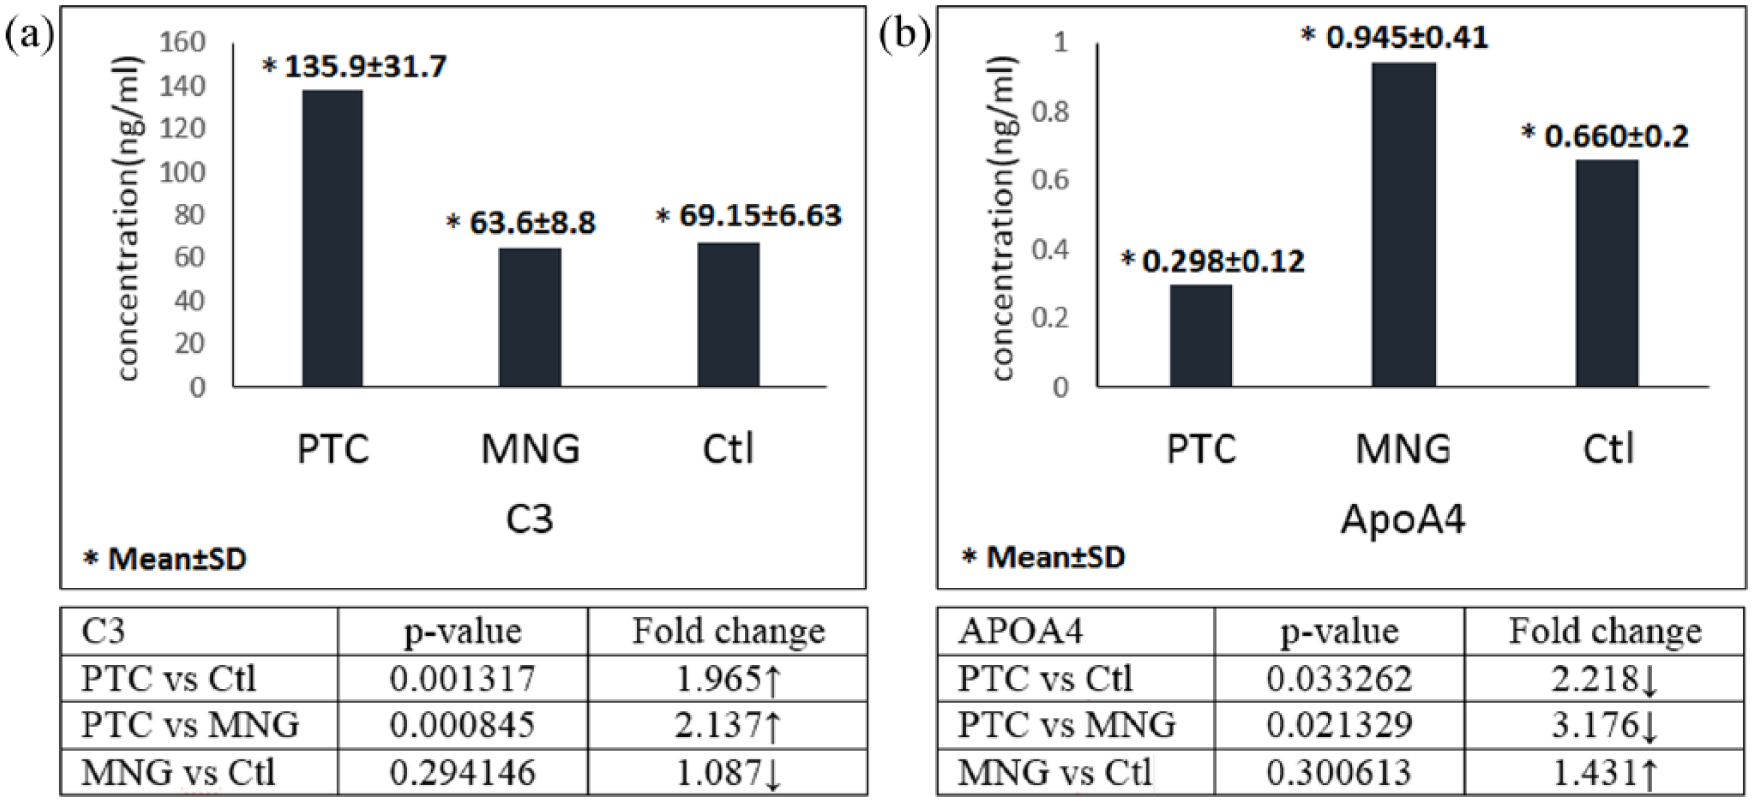
ELISA results for the confirmation of (a) complement C3, and (b) apolipoprotein A4, in serum samples of PTC, MNG, and healthy subjects.
Discussion
Proteomics, the comprehensive analysis of the protein content of biological samples, including tissues and biofluids, along with the development of bioinformatics analyses, have improved the opportunities for the study of disease pathology and for proposing novel biomarkers. In this study, we performed a 2-DE analysis followed by MALDI-TOF-TOF mass spectrometry in PTC, MNG, and healthy control serum samples; 12 differentially expressed proteins were identified. Complements C3 and C4A were among the proteins that were overexpressed in PTC samples compared to both MNG and healthy subjects. The complement immune system is suggested to be activated in cancers and in response to tumor associated antigens expression. 10 Complement proteins secreted from tumor cells stimulate the growth of cancer cells via activating autocrine pathways such as PI3K/Akt signaling. They also participate in angiogenesis, cell–cell communications, cell migration, and epithelial–mesenchymal transition. 11 The study by Yamakawa et al. 12 demonstrated higher amounts of C3d and C5b-9 complexes in thyroid cancers. Lucas et al. 13 also found elevations of complement factors C3d, C4d, and C5 in about 80% of PTC cases compared to normal controls. Galli et al. 14 identified the complement C4 protein as one of the highest importance variables discriminating between malignant and benign thyroid tumors with overexpression in malignant lesions. The pathway analysis results also showed that the complement activation cascade is one of the most important pathways in the progression of thyroid cancer. We observed the altered levels of two apolipoproteins including APOA4 and APOH. APOA4 was decreased in PTC patients compared to benign and healthy controls, but APOH was increased in both PTC and MNG samples. Alterations of various lipoproteins have been reported in thyroid tumors.15,16 The plasma lipoprotein APOA4 is involved in various biological pathways such as glucose and lipid metabolism. 17 In a recent study, lower levels of APOA4 in the benign class compared to PTC were observed, which contrasts with our results. 18 However, in line with our findings, in many cancers, decreased levels of APOA4 was observed. For example, Jeong et al. 19 found lower APOA4 as a marker for squamous cell carcinoma of uterine cervix. The other protein with altered expression was the vitamin D binding protein (GC), which had decreased amounts in PTC patients. GC plays a key role in vitamin D metabolism. The anti-proliferative, anti-angiogenesis, and anti-metastatic effects of vitamin D are widely investigated in various cancers, and polymorphisms of GC protein are associated with increased cancer risk. 20 Vitamin D is shown to have indirect effects in regulating the cell cycle through some signaling pathways such as EGF, TGF-β, p38, MAPK, and PI3K. 21 Various studies found significantly lower amounts of 25(OH)D and 1,25(OH)2D—the active forms of vitamin D—in PTC patients compared to healthy controls. 22 The other protein up-regulated in the PTC class was cytokeratin 10. Cytokeratins comprise one of the most common markers for identification of circulating tumor cells. 23 It has been reported that KRT10 expression is correlated with the aggressiveness of epithelial cell-derived tumors. 24 In agreement with our results, Lucas et al. 25 demonstrated larger amounts of cytokeratin 10 in the serum and tissue of PTC patients compared to the control group by western blot analysis and immunohistochemistry. Haptoglobin was the other protein with decreased amounts in PTC patients. The role of the HP protein is not well understood in the progression of thyroid cancers. 16 The main functions of HP include anti-inflammatory and anti-oxidant properties in addition to the roles it has in autoimmune diseases and tumor angiogenesis. Alterations in the thyroid tissue HP precursor was found by Krause et al. 26 in PTC patients. HP usually increases in inflammations and cancers; however, decreased serum haptoglobin has been observed. For instance, there was an investigation on hepatocellular carcinoma that reported lower amounts of HP in tumor tissues compared to non-tumorous tissues, and demonstrated a strong correlation between lower HP levels and poor 5-year overall survival in hepatocellular carcinoma patients. 27 Transthyretin levels showed down-regulation in PTC and MNG patients compared to healthy controls. TTR is mainly involved in thyroid cancer cell function and in the production of thyroid hormones. 28 The results of the pathway analysis revealed that the PPAR signaling pathway plays a role in the pathogenesis of PTC. The expression of PPARγ has been reported in various thyroid cancer types, which showed that PPARγ ligands have inhibitory effects on the growth of thyroid cancer cells. 29 In conclusion, the results showed that proteomic studies can serve as a powerful tool in identifying serum biomarkers from different sources, including serum and plasma, tissues, cell cultures, and other biological fluids. We found 12 differentially expressed proteins and confirmed the altered expression of C3 and APOA4 by the ELISA method. However, further validation of all these potential biomarkers in large cohorts must be performed. A panel of all these proteins after validation may act as a useful marker for the diagnosis of early-stage papillary thyroid cancer.
Supplemental Material
suppl._Figure_1 – Supplemental material for Decreased apolipoprotein A4 and increased complement component 3 as potential markers for papillary thyroid carcinoma: A proteomic study
Supplemental material, suppl._Figure_1 for Decreased apolipoprotein A4 and increased complement component 3 as potential markers for papillary thyroid carcinoma: A proteomic study by Reyhaneh Farrokhi Yekta, Afsaneh Arefi Oskouie, Mostafa Rezaei Tavirani, Mohammad R. Mohajeri-Tehrani and Ahmad R. Soroush in The International Journal of Biological Markers
Supplemental Material
suppl._Figure_2 – Supplemental material for Decreased apolipoprotein A4 and increased complement component 3 as potential markers for papillary thyroid carcinoma: A proteomic study
Supplemental material, suppl._Figure_2 for Decreased apolipoprotein A4 and increased complement component 3 as potential markers for papillary thyroid carcinoma: A proteomic study by Reyhaneh Farrokhi Yekta, Afsaneh Arefi Oskouie, Mostafa Rezaei Tavirani, Mohammad R. Mohajeri-Tehrani and Ahmad R. Soroush in The International Journal of Biological Markers
Supplemental Material
suppl._Table_1 – Supplemental material for Decreased apolipoprotein A4 and increased complement component 3 as potential markers for papillary thyroid carcinoma: A proteomic study
Supplemental material, suppl._Table_1 for Decreased apolipoprotein A4 and increased complement component 3 as potential markers for papillary thyroid carcinoma: A proteomic study by Reyhaneh Farrokhi Yekta, Afsaneh Arefi Oskouie, Mostafa Rezaei Tavirani, Mohammad R. Mohajeri-Tehrani and Ahmad R. Soroush in The International Journal of Biological Markers
Footnotes
Acknowledgements
We gratefully acknowledge the Proteomics Research Center and Dr. Nejadi for the assistance with 2-DE analysis. We also extend our thanks to the Department of Basic Sciences, Shahid Beheshti University of Medical Sciences, Tehran, Iran, for their support.
Declaration of conflicting interest
The authors declare that there is no conflict of interest. The authors alone are responsible for the content and writing of this article.
Funding
The author(s) disclosed receipt of the following financial support for the research, authorship, and/or publication of this article: This study was supported by a grant from Department of Basic Sciences, Shahid Beheshti University of Medical Sciences, Tehran, Iran.
Supplemental Material
Supplemental material for this article is available online.
References
Supplementary Material
Please find the following supplemental material available below.
For Open Access articles published under a Creative Commons License, all supplemental material carries the same license as the article it is associated with.
For non-Open Access articles published, all supplemental material carries a non-exclusive license, and permission requests for re-use of supplemental material or any part of supplemental material shall be sent directly to the copyright owner as specified in the copyright notice associated with the article.