
Abstract
Keywords
Core tip
This study investigates fecal calprotectin (FC) as a potential marker for gastrointestinal (GI) involvement in systemic sclerosis (SSc) patients. Although no significant correlations were found between FC levels and clinical or laboratory findings such as age, disease type, GI symptoms, or serum tests, increased FC levels were observed in patients with intestinal wall thickening. These findings suggest that FC may serve as a specific indicator for certain GI abnormalities, highlighting the need for further research with larger sample sizes to confirm these preliminary results
Introduction
Systemic sclerosis (SSc), also referred to as scleroderma, is a complex and diverse inflammatory disease that affects various internal organs and the skin. 1 It is characterized by the development of fibrosis and impairment of motor activity in the gastrointestinal (GI) tract. It also leads to vascular dysfunction and autoimmunity.2–4
The GI system is heavily affected in patients with SSc, with more than 90% experiencing GI issues. While not the primary cause of death, these complications significantly impact patients’ quality of life. The progressive fibrosis of smooth muscle in the muscular propria layer impairs normal motor function, leading to transit and nutrient absorption issues. Fibrosis is a common feature of gastrointestinal (GI) involvement in systemic sclerosis (SSc); however, it is not always the most dominant manifestation. Other features, such as motility disorders and microvascular changes, are also commonly observed. Inflammation is also a significant contributor to GI disorders in SSc patients.
Calprotectin is a protein that binds to calcium and zinc and weighs 36-kDa. It makes up a considerable amount (40 to 60%) of the cytosolic proteins in neutrophils and is also present in other myeloid cells. Its composition comprises a heavy chain of 14 kDa and a light chain of 8 kDa.
When there’s inflammation in the body and neutrophils are present, the levels of calprotectin elevate in the plasma, urine, saliva, and stool.5,6 As a result, FC is a reliable indicator for detecting intestinal inflammation. 7 The FC level stands out from other inflammatory markers such as the Erythrocyte sedimentation rate (ESR) and C-reactive protein (CRP) because it is solely influenced by inflammation in the intestines and not affected by other sources of inflammation. 8
In recent research, it has been found that SSc patients often exhibit high levels of FC.3,9 While fecal calprotectin (FC) has shown promise as a biomarker for gastrointestinal involvement in SSc, further validation is needed before it can be widely considered a clinical tool. We faced a challenging issue, which led us to conduct a study aimed at exploring the correlation between fecal calprotectin levels and clinical as well as laboratory findings in patients with systemic sclerosis, to determine its potential as a marker for gastrointestinal involvement.
Materials and methods
Patients
This study is a cross-sectional study, with patients consecutively recruited from rheumatology department of Sayyad Shirazi Hospital in Gorgan, Golestan Province, Iran. Clinical data, including imaging studies, were collected at the time of patient enrollment, and blood samples were drawn following imaging and clinical assessments to ensure consistency in data collection timing.
The research was carried out at the rheumatology department of Sayyad Shirazi Hospital in Gorgan, Golestan Province, Iran. Prior to the study, it was approved by the regional ethical board at Golestan University of Medical Sciences under approval number IR.GOUMS.REC.1396.84, and all patients provided written informed consent.
To be included, patients had to meet the American College of Rheumatology (ACR) criteria for SSc, while exclusion criteria involved having other connective tissue diseases or vasculitis, a history of hepatic or GI diseases, diabetes or being alcoholic, a history of GI surgery or vagotomy, and a history of taking nonsteroidal anti-inflammatory drugs (NSAIDs).
Clinical assessment
We gathered various patient data, including age, gender, disease type, skin and GI symptom scores, the small bowel wall thickness in CT-Enterography, esophageal dilation in barium swallow examination, and their blood serum test results. The patients were classified according to whether they had diffused or limited cutaneous SSc, 10 and their skin involvement was measured using the modified Rodnan skin score (mRSS). 11 Based on the European Scleroderma Trials and Research Group (EUSTAR) SSc activity score, a skin scores above 14 was considered a sign of active skin involvement, and a score of less than 14 was considered as a sign of inactive skin involvement. 12
To assess esophageal function, we utilized a barium swallow test, a standard radiographic procedure where patients ingest a barium solution, allowing visualization of the esophagus. Esophageal motility dysfunction was defined based on findings from barium swallow tests indicating impaired esophageal peristalsis, as per established criteria. Small intestine wall thickening was identified via CT-enterography and defined as a wall thickness exceeding 3 mm, consistent with prior radiological studies. 13 Imaging results were interpreted by a team of radiologists to ensure accuracy and consistency. It is important to note that we did not measure small intestinal bacterial overgrowth (SIBO) in this study. Also, patients were divided into two groups, young and middle-aged, with a median age of 42 years.
Assessment of medical records
Medical records were studied carefully and patients with any of the exclusion criteria did not enter the study.
Questionnaire
Patients were asked to complete the UCLA SCTC 2.0 (University of California Los Angeles Scleroderma Clinical Trial Consortium Gastrointestinal Tract 2.0). 14 The questionnaire was administered in Persian language, and it has been previously validated in this language for use in assessing gastrointestinal symptoms. This questionnaire consists of seven parts, including Reflux, bloating/abdominal distension, fecal spoilage, diarrhea, social function, emotional well-being, and constipation, each with specific questions. The score for each question was calculated individually, and at the end, the total was divided into six parts (excluding the constipation score), which was considered as the final score. Each patient received a score between zero and 2.83.
Laboratory examinations
To determine the FC level in patients, we used the BÜHLMANN CAL® EK-CAL (96 test) kit and the ELISA method. ELISA plates included controls from healthy controls to determine the optimal cutoff, defined as 2-3 standard deviations above the mean value of healthy controls. According to established classifications, FC levels above 50 μg/g were deemed elevated,8,15 and levels above 200 μg/g were classified as significantly elevated. 16 Since none of the patients had negative FC levels (less than 50 μg/g), we divided them into two groups based on their levels: elevated (greater than 50 μg/g and less than 200 μg/g) and significantly elevated (greater than 200 μg/g). We considered the first group a positive result and the second group a negative result. Additionally, we conducted laboratory tests for Albumin, Magnesium, Zinc, ESR, CRP, Folic Acid, Vitamin B12, and Ferritin in all patients.
Statistical analyses
We analyzed the collected data using SPSS software version 16, utilizing the Chi-square test to determine the correlation between FC level, age, disease type, and radiography results. The t-student test was used to examine the correlation of FC level with quantitative variables such as skin score and GI symptoms, magnesium, and ESR, while the Mann-Whitney test was used for other serum tests with abnormal distribution (CRP, Albumin, Ferritin, folic acid, Vitamin B12, and zinc). A two-tailed p-value <.05 was considered significant in the study. If data were absent for a variable, it was considered as missing and not imputed unless otherwise specified.
Results
A total of 54 patients were not available for the study out of 100 patients. Finally, a total of 46 patients were admitted to our medical department. However, seven patients, including two men and five women, were excluded from the study due to various reasons such as diabetes, history of esophagectomy, and simultaneous diabetes and polymyositis. The remaining 39 patients were all female and had a mean age of 43.23 years with a standard deviation of 11.75 years.
Frequency distribution of disease characteristics, small intestine wall thickening, and esophageal dilation.

*Unspecified cases were removed.
The mean and standard deviation of laboratory tests in the studied subjects.

*Unspecified cases were removed.
The FC test was completed successfully in 38 individuals, with a positive result in 26 patients (68.4%) and a negative result in 12 patients (31.6%).
The distribution of FC results by age category, disease type, the presence of wall thickening, and the presence or absence of esophageal dilation in the subjects.
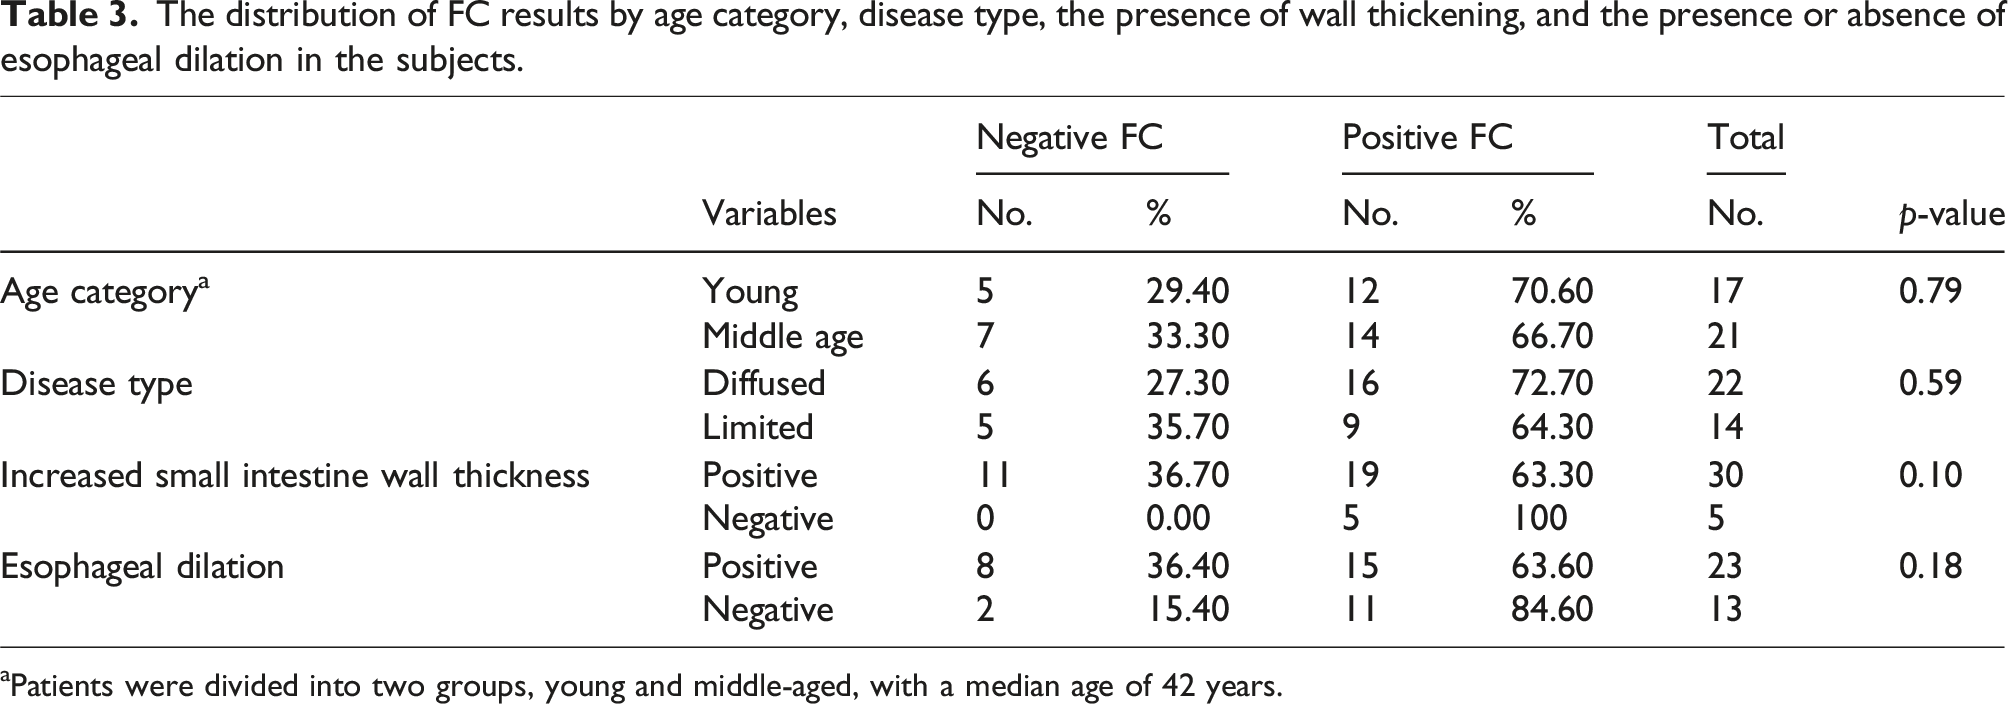
aPatients were divided into two groups, young and middle-aged, with a median age of 42 years.
To calculate the data, normal frequency distribution was used for the mean and standard deviation of skin score, GI symptoms final score, ESR, and magnesium, followed by the application of the student t test.
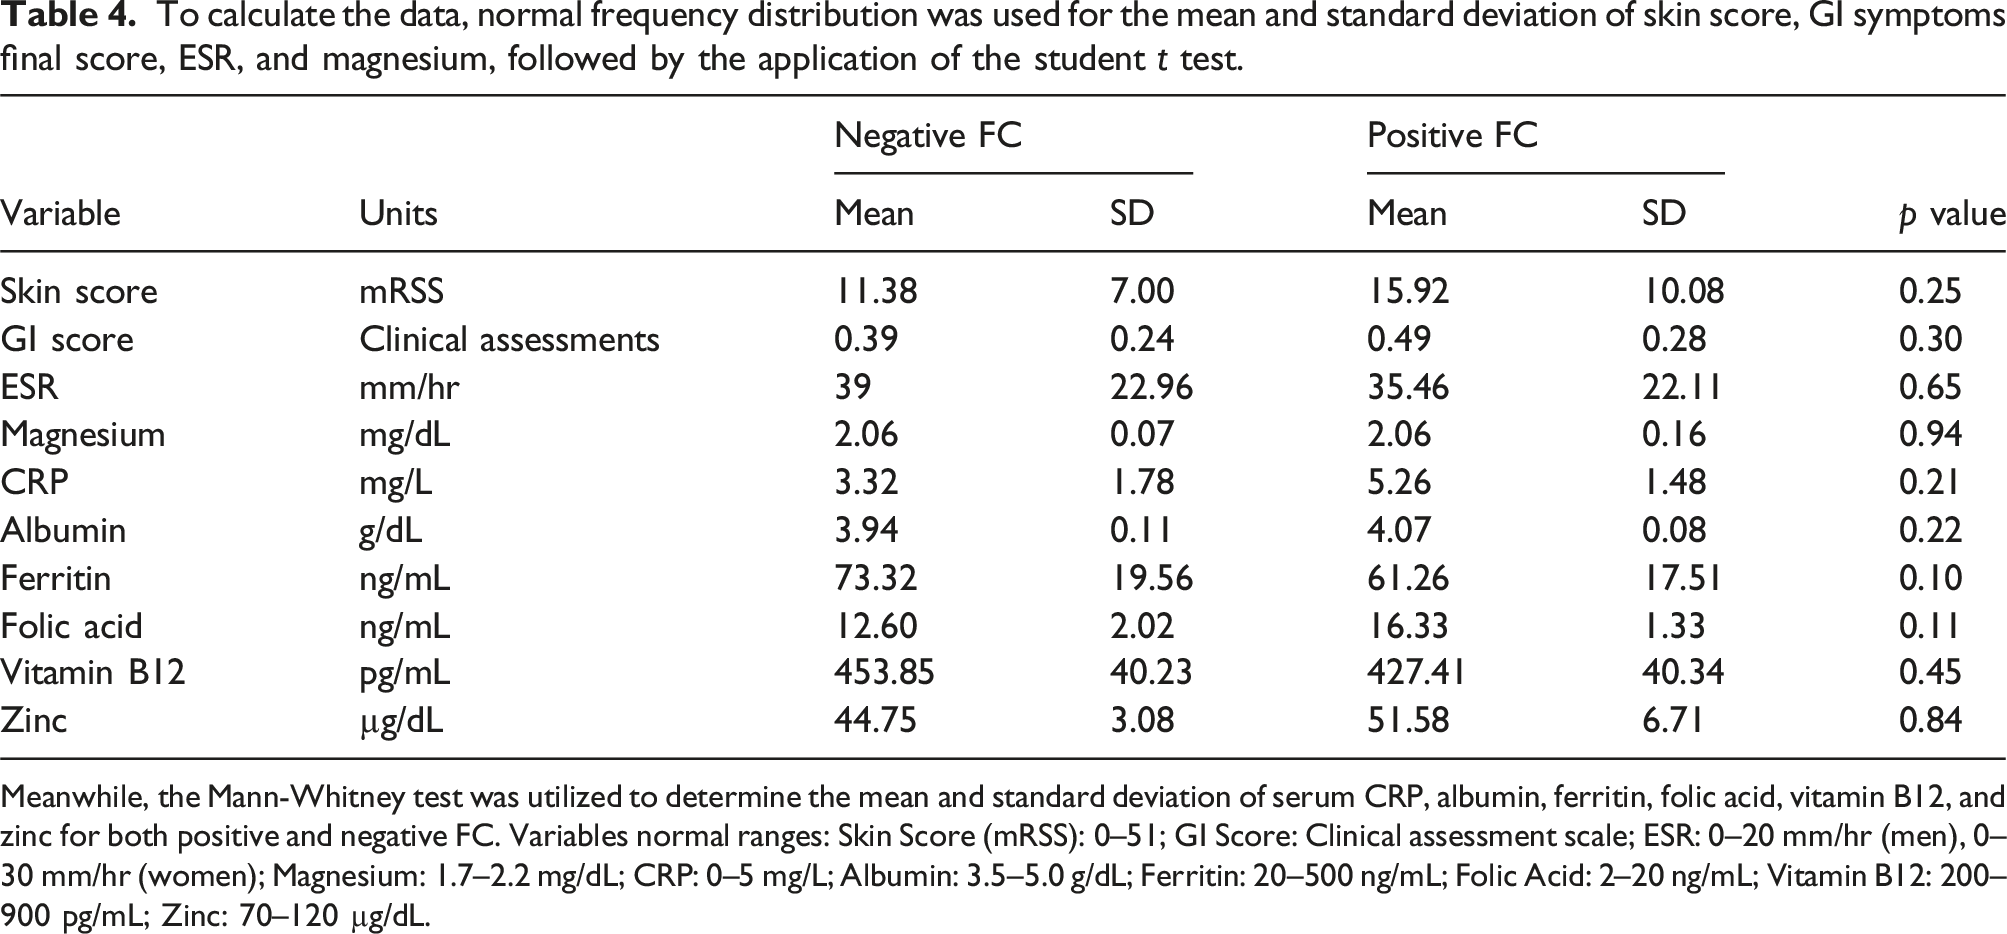
Meanwhile, the Mann-Whitney test was utilized to determine the mean and standard deviation of serum CRP, albumin, ferritin, folic acid, vitamin B12, and zinc for both positive and negative FC. Variables normal ranges: Skin Score (mRSS): 0–51; GI Score: Clinical assessment scale; ESR: 0–20 mm/hr (men), 0–30 mm/hr (women); Magnesium: 1.7–2.2 mg/dL; CRP: 0–5 mg/L; Albumin: 3.5–5.0 g/dL; Ferritin: 20–500 ng/mL; Folic Acid: 2–20 ng/mL; Vitamin B12: 200–900 pg/mL; Zinc: 70–120 µg/dL.
Discussion
According to Table 3, there was no notable variation in the occurrence of FC-positive cases between the young group (70.6%) and the middle-aged group (66.7%) in relation to age (P. Value = 0.79). There was no significant correlation found, but it was observed that the younger age group had a higher number of positive FC cases. This could possibly be due to the increased digestive tract activity in younger individuals. A previous study 17 on elderly patients with IBD and normal endoscopic findings found that the mean FC level was not higher, and there was no significant relationship between age and FC level. In contrast, a study by D'Angelo in 2017 demonstrated that FC levels increase with age. 18 These conflicting findings are further complicated by Heinzel et al., 19 who reported that elevated FC levels in older individuals were associated with gut microbial dysbiosis and increased systemic inflammation markers. This suggests that while FC levels may be influenced by age-related gut changes, the relationship between FC and age remains unclear and warrants further investigation.
In regards to the different types of SSc, Table 3 offers data on the occurrence of FC-positive cases. The results show that there was no significant difference (P. Value = 0.59) between the frequency of positive FC cases in the diffused type (72.7%) and the limited type (64.3%). However, due to the higher probability of digestive tract disorder in the diffuse type, 20 the number of positive FCs was significantly higher than in the limited type, which confirms the link between FC levels and digestive tract involvement in patients with SSc. This finding aligns with the results of Hamberg et al., 21 who found that a substantial proportion of SSc patients (38%) had elevated FC levels compared to controls. Their study suggests that gastrointestinal inflammation may be present even at the early stages of SSc, reinforcing the hypothesis that diffuse-type SSc patients, who often have more severe GI involvement, may exhibit higher FC levels.
Several studies have been conducted to evaluate the use of FC levels in different diseases. Bonnin et al 22 found that the level of FC in children with IBD is significantly higher than in children with functional type of disease or healthy children. Similarly, Andreasson et al 9 discovered that the level of FC in SSc patients was significantly higher compared to people with Sjögren’s disease, rheumatoid arthritis, and healthy ones, indicating specificity of FC in diagnosing digestive tract problems in SSc patients. Ozseker et al 23 also found that FC levels can be used as a tool to identify GI tract problems in patients with Behcet’s disease, as patients with ulcers in terminal ileum or colon in endoscopic examinations exhibited significantly higher levels of FC compared to those with no digestive tract abnormalities (P. Value = 0.01).
However, Montalto et al 15 reviewed recent studies on the diagnostic use of FC levels in various GI disorders and concluded that FC level should not be used as a marker for structural digestive tract diseases but rather as a sign of inflammation of the GI wall. This aligns with the findings of Heinzel et al., 19 who demonstrated that elevated FC levels were linked to gut microbial dysbiosis, systemic inflammation, and metabolic alterations, further supporting the role of FC as an inflammatory marker rather than a direct indicator of structural GI pathology.
The prevalence of FC-positive cases in patients with SSc was determined by analyzing the thickness of the intestinal wall in CT-enterography. Table 3 shows that there was no statistically significant difference in the frequency of FC-positive cases between those with normal small intestine wall thickness (63.3%) and those with increased thickness (100%) (P. Value = 0.10). However, it’s worth noting that only five cases showed evidence of increased small intestinal wall thickness in their CT-enterography, and all five had FC levels of more than 200 g/gμ. Since endoscopic access to the small intestine can be difficult, expensive, and painful, determining FC levels can serve as a predictive tool for the presence of GI disorders in the small intestine in patients with SSc. This aligns with the study by Polkowska-Pruszyńska et al., 24 which found that FC was a highly sensitive (94.12%) and specific (73.68%) marker for detecting small intestinal bacterial overgrowth (SIBO) in SSc patients. While our study did not assess SIBO directly, the association between FC and small intestine involvement suggests that FC could serve as a potential non-invasive screening tool for SIBO in SSc patients.
Various studies have established a link between FC levels and GI issues. For instance, in 2011 3 and 2014, 9 Anderson et al. conducted two studies that revealed a strong correlation between FC levels and GI pathology, which was proven by Cine-radiography. Similarly, in 2015, Cerrillo et al. 25 tested 112 patients with Crohn’s disease involving the ileum using magnetic resonance elastography. They compared the results with their FC levels and observed that the magnetic resonance index of activity score was significantly associated with FC levels (p-value <.01). Additionally, in 2017, Shimoyama et al. 26 evaluated FC levels as a marker for small bowel inflammation in patients with Crohn’s disease. They discovered a significant positive correlation between FC level and CT-enterography score (p < .0001).
Further research with a larger sample size is needed to determine if FC levels can indicate inflammation in the small intestine, as our current study did not yield significant results.
In patients with SSc, the esophagus is commonly affected, with 90% of patients experiencing this issue. 27 Our study aimed to compare the frequency of FC-positive cases in patients with and without esophageal dilation during a barium swallow test. The results showed no significant relationship between positive cases of FC in patients with and without esophageal dilation (P. Value = 0.18). However, FC levels were numerically higher in patients with esophageal dilation, indicating a possible correlation between elevated FC levels and upper GI tract disorders. Previous studies 17 have shown that FC can be a useful marker for detecting abnormalities in both the upper and lower GI tract. Though it is more useful in colon disorders, FC levels have been found to be significantly higher in children with reflux compared to healthy children. 17
Based on the data presented in Table 4, individuals with a positive FC response had an average skin score of 15.92, while those with a negative FC response had an average skin score of 11.38. However, the difference was not deemed statistically significant with a p-value of 0.25. This finding is supported by a study conducted by Andreasson et al. 3 in 2011, which also found no significant correlation between FC levels and skin score in SSc patients. Therefore, subsequent studies did not compare these two parameters. In 2015, Marie et al. 2 also conducted a study on the role of FC level in SSc and found no correlation between FC levels and average skin score, with a p-value of 0.79.
In Table 4, the mean GI symptoms score was found to be 0.49 in individuals with a positive FC response, and 0.39 in those with a negative FC response. However, the association between FC and GI symptoms was not statistically significant (P. Value = 0.30). One possible reason for this is that the questionnaire used may not have been specialized for the Iranian population. Another factor to consider is the use of anti-acid drugs, such as proton pump inhibitors (PPIs). It is important to note that the questionnaire included questions about fear of digestive problems in different social situations, which may not have been relevant to our patient population, consisting mostly of middle-aged, illiterate, and housewife women who did not encounter diverse social situations. Similarly, questions about fear of digestive problems while traveling were not applicable to many of our patients due to financial or physical constraints. Furthermore, a study by Andreasson et al. in 2011 3 found that the relationship between FC level and GI symptom score, as measured by a Swedish questionnaire (GSRS), was also not statistically significant (P. Value = 0.44). The authors attributed this to the questionnaire’s lack of specialization for patients with SSc.
Malnutrition is a significant symptom of acute GI disease, 28 which is often linked to a low number of bacteria in the small intestine, where nutrients are absorbed. Small intestinal bacterial overgrowth (SIBO) can lead to food being consumed by bacteria, causing damage to the mucosa and impairing absorption in the small intestine, ultimately resulting in malabsorption. 29 Laboratory tests can be used to identify micronutrient deficiencies, which are common symptoms of malnutrition. Polkowska-Pruszyńska et al. 24 suggested that FC could be an indicator of SIBO in SSc patients, further emphasizing the potential role of FC in monitoring gut health and inflammation in SSc.
Through our research, we have determined that receiving prescribed vitamin and mineral supplements is a crucial factor in the elevated levels of micronutrients found in the FC-positive group. Andreasson et al. (2011) 3 conducted a similar study and came to the same conclusion, demonstrating that patients who received micronutrient supplements for deficiencies had higher FC levels compared to those who did not receive any supplemental medication. In another study conducted by the same researchers in 2014, 9 levels of folic acid, vitamin B12, iron, and zinc were measured in SSc patients. It was discovered that those with a deficiency in more than one micronutrient had higher FC levels than those with only one deficiency. Additionally, the FC levels in the second group were higher than in normal subjects (P. Value = 0.001), which suggests that GI disorders in SSc patients result in increased FC levels. FC has emerged as a valuable biomarker in reflecting gastrointestinal impairment in systemic sclerosis (SSc) patients. Although our study did not measure SIBO, FC levels were significantly associated with gastrointestinal symptoms, suggesting its potential utility in monitoring disease progression and gastrointestinal health. The development of gastrointestinal symptoms in SSc, often linked with small bowel dysmotility, underscores the importance of regular monitoring using noninvasive markers such as FC. It is important to note that this study did not measure SIBO. Therefore, while FC was found to correlate with gastrointestinal symptoms, we cannot make definitive conclusions about its diagnostic capability for SIBO. Future studies should include direct measurements of SIBO to validate the role of FC in this context. This study has several limitations, notably its small sample size. As a result, our findings may not be generalizable and may not reflect the true association between fecal calprotectin and gastrointestinal involvement in systemic sclerosis. The small cohort size limited our ability to detect significant associations, and future studies with larger sample sizes are necessary to further investigate this potential biomarker. We acknowledge that this study’s negative findings may suggest the need for a different study design to better assess the relationship between FC and gastrointestinal manifestations of SSc.
Conclusion
Given the underpowered nature of this study, we did not observe significant associations between fecal calprotectin levels and gastrointestinal involvement in systemic sclerosis, including small intestine wall thickness and esophageal dilation. This study highlights the need for larger cohort studies with more robust methodologies to explore the potential of FC in this context. Therefore, while the findings are not conclusive, they provide insight into the limitations of FC as a biomarker for gastrointestinal involvement in SSc.
Supplemental Material
Supplemental Material - Fecal calprotectin as a biomarker for gastrointestinal involvement in systemic sclerosis: Associations and limitations
Supplemental Material for Fecal calprotectin as a biomarker for gastrointestinal involvement in systemic sclerosis: Associations and limitations by Alireza Fatemi, Hale Hedayatmofidi, Nafiseh Abdolahi, Mohammad Hadi Gharib, Somayeh Livani and Mehrdad Aghaie in European Journal of Inflammation.
Footnotes
Acknowledgments
Special thanks to all the fellow authors who contributed to this article.
Author contributions
A.F: Manuscript writing and Data entry. H.H: Design of the work. M.A, and N.A: Data interpretation and substantial manuscript revision. MHG and S.L: Radiologic analysis and interpretation.
Declaration of conflicting interests
The author(s) declared no potential conflicts of interest with respect to the research, authorship, and/or publication of this article.
Funding
The author(s) disclosed receipt of the following financial support for the research, authorship, and/or publication of this article: The Golestan University of Medical Sciences financially supported this work.
Ethics statement
Informed consent
The informed consent was also obtained from the patient for the implementation of this project.
Supplemental Material
Supplemental material for this article is available online.
References
Supplementary Material
Please find the following supplemental material available below.
For Open Access articles published under a Creative Commons License, all supplemental material carries the same license as the article it is associated with.
For non-Open Access articles published, all supplemental material carries a non-exclusive license, and permission requests for re-use of supplemental material or any part of supplemental material shall be sent directly to the copyright owner as specified in the copyright notice associated with the article.