
Abstract
Introduction
Crohn’s disease (CD) is a chronic inflammatory bowel disease caused by genetic and environmental factors and alterations in the composition and abundance of gut microbiota. Research also shows the disease can lead to severely debilitating and dysregulated immune response.1,2 The incidence of CD is increasing worldwide, but it is highest in North America and Northern Europe.3–5 In China, the economic growth in the country has paralleled an increase in the incidence of CD.6,7
Although the precise etiology of CD remains unclear, dysregulated and excessive immune responses against pathogenic gut microbiota have been implicated in the development of CD. 8 Obviously, immune responses, especially the immune cells, play an important role in CD. Traditional techniques such as immunohistochemistry and flow cytometry, do not explicitly reveal the immune landscape in the intestinal mucosa of CD patients. Among the more well-studied genes, such as NOD2,9,10 CARD1511,12 and PRKCQ, 13 have been implicated in CD occurrence and development. However, these genes are not entirely related to immune response and therefore are not ideal targets for immunotherapy. As immunotherapy has been recommended by the clinical guideline of CD treatment,14,15 it is imperative to identify reliable targets in CD patients for immunotherapy.
CIBERSORT is a gene expression-based algorithm that accurately reveals the infiltration pattern of immune cells based on gene expression profiles. 16 We investigated infiltration of 22 immune cell types to the intestinal mucosa of CD patients and healthy individuals. Weighted gene co-expression network analysis (WGCNA) is a bioinformatics analytical method for accurate exploration of the relationships between genes and phenotypes. 17 The distinct advantage of WGCNA is that genes can be clustered into co-expression modules, which connect the phenotypic characteristics and the changes in gene expression. The diagnostic value of hub genes can be assessed using receiver operating characteristic (ROC) curve analysis. 18
In the present study, the gene-sequence data for the infiltration of immune cells to the intestinal mucosa of CD patients and healthy individuals were downloaded from the Gene Expression Omnibus (GEO) database. The finding of this study will unpack the complex activities in the immune microenvironment of intestinal mucosa of CD patients, which may reveal new therapeutic targets for the treatment of the disease.
Methods
Source of data
Gene expression data of CD patients and healthy individuals were downloaded from the GEO database (http://www.ncbi.nlm.nih.gov/geo/). The screening criteria for the gene expression datasets were as follows: (1) the study type was limited to expression profiling by array; (2) gene expression data in the intestinal mucosa of CD patients and normal individuals; (3) Each dataset contained for at least 100 samples; (4) analyzable processed data or raw data.
Data preprocessing and differential gene analysis
Data were preprocessed and analyzed using the R software (https://www.r-project.org/) through the following steps: (1) The probe names of each gene were converted to gene symbols, moreover, when a target gene corresponded to multiple probes, the average expression values of the probes was used to represent the expression level of the gene; (2) genes were excluded if the gene expression level was zero in more than half of the samples; (3) genes lacking expression level data for over 30% of the samples were also removed. Differential expression analysis was performed using the “limma” R package. 19 Adjusted p-value < .05 and fold change >1.2 or fold change <-1.2 were set as the threshold for significant differential expression.
Immune infiltration analysis
The composition and proportion of 22 immune cells in the intestinal mucosa of CD patients and healthy individuals were estimated using the Cell-type Identification By Estimating Relative Subsets Of RNA Transcripts (CIBERSORT) tool in combination with leukocyte signature matrix (LM22) based on gene expression profiles of the cells. 16 The permutations (perm) of the deconvolution algorithm were set at 1000.
Construction of network and identification of hub genes
The coexpression network of DEGs and the infiltration of immune cells was performed as previously described. 17 First, the soft thresholding power β, to which coexpression similarity was raised to calculate adjacency, was calculated using the pickSoftThreshold function in the “WGCNA” R package. Second, the samples were clustered to identify any obvious outliers. Third, the coexpression network was then constructed. Fourth, key gene modules were identified using hierarchical clustering and the dynamic tree cut function. Gene significance (GS) and module membership (MM) were then calculated to match modules to specific immune cells. According to the correlation between the immune cells and ME and p-value, the module with the highest correlation coefficient and the smallest p-value was selected as the most relevant module for the immune cells. Finally, the hub genes in the relevant module for the immune cells were identified based on MM > 0.9 and GS > 0.7.
Functional enrichment analysis
Biological processes and pathways regulated by the genes in the modules were identified using the Kyoto Encyclopedia of Genes and Genomes (KEGG) pathway and Gene Ontology (GO) enrichment analysis via the “clusterProfiler” R package. 20 The cutoff of the q-value was set at 0.05.
Linear model and ROC curve analysis
The Best linear model for immune cell and hub genes was derived using a stepwise forward linear regression analysis. The following statistic model was developed: y=β0+β1x1+β2x2+…+βixi, where y is the proportion of immune cells, xi is the expression value of hub genes, β0 was the intercept of the regression equation, and βi is the regression coefficients.
The utility and accuracy of the hub genes for CD diagnosis were assessed by receiver operating characteristic (ROC) analysis using the “ROCR” R package. 21 The area under curve (AUC) was then calculated and screened for genes with AUC greater than 0.7.
Statistical analysis
Data were analyzed using R software (Rx64 4.0.3). Differences between two groups were analyzed using the Wilcoxon test, whereas the Kruskal–Wallis test was used for multiple groups. The correlation between different immune cell subtypes to the intestinal mucosa of CD patients was performed using the Pearson correlation coefficient. Statistical significance was set at p < .05.
Results
Crohn’s disease microarray datasets
The diagrammatic flow of this study was shown in Figure 1. GSE179285
22
and GSE20881
23
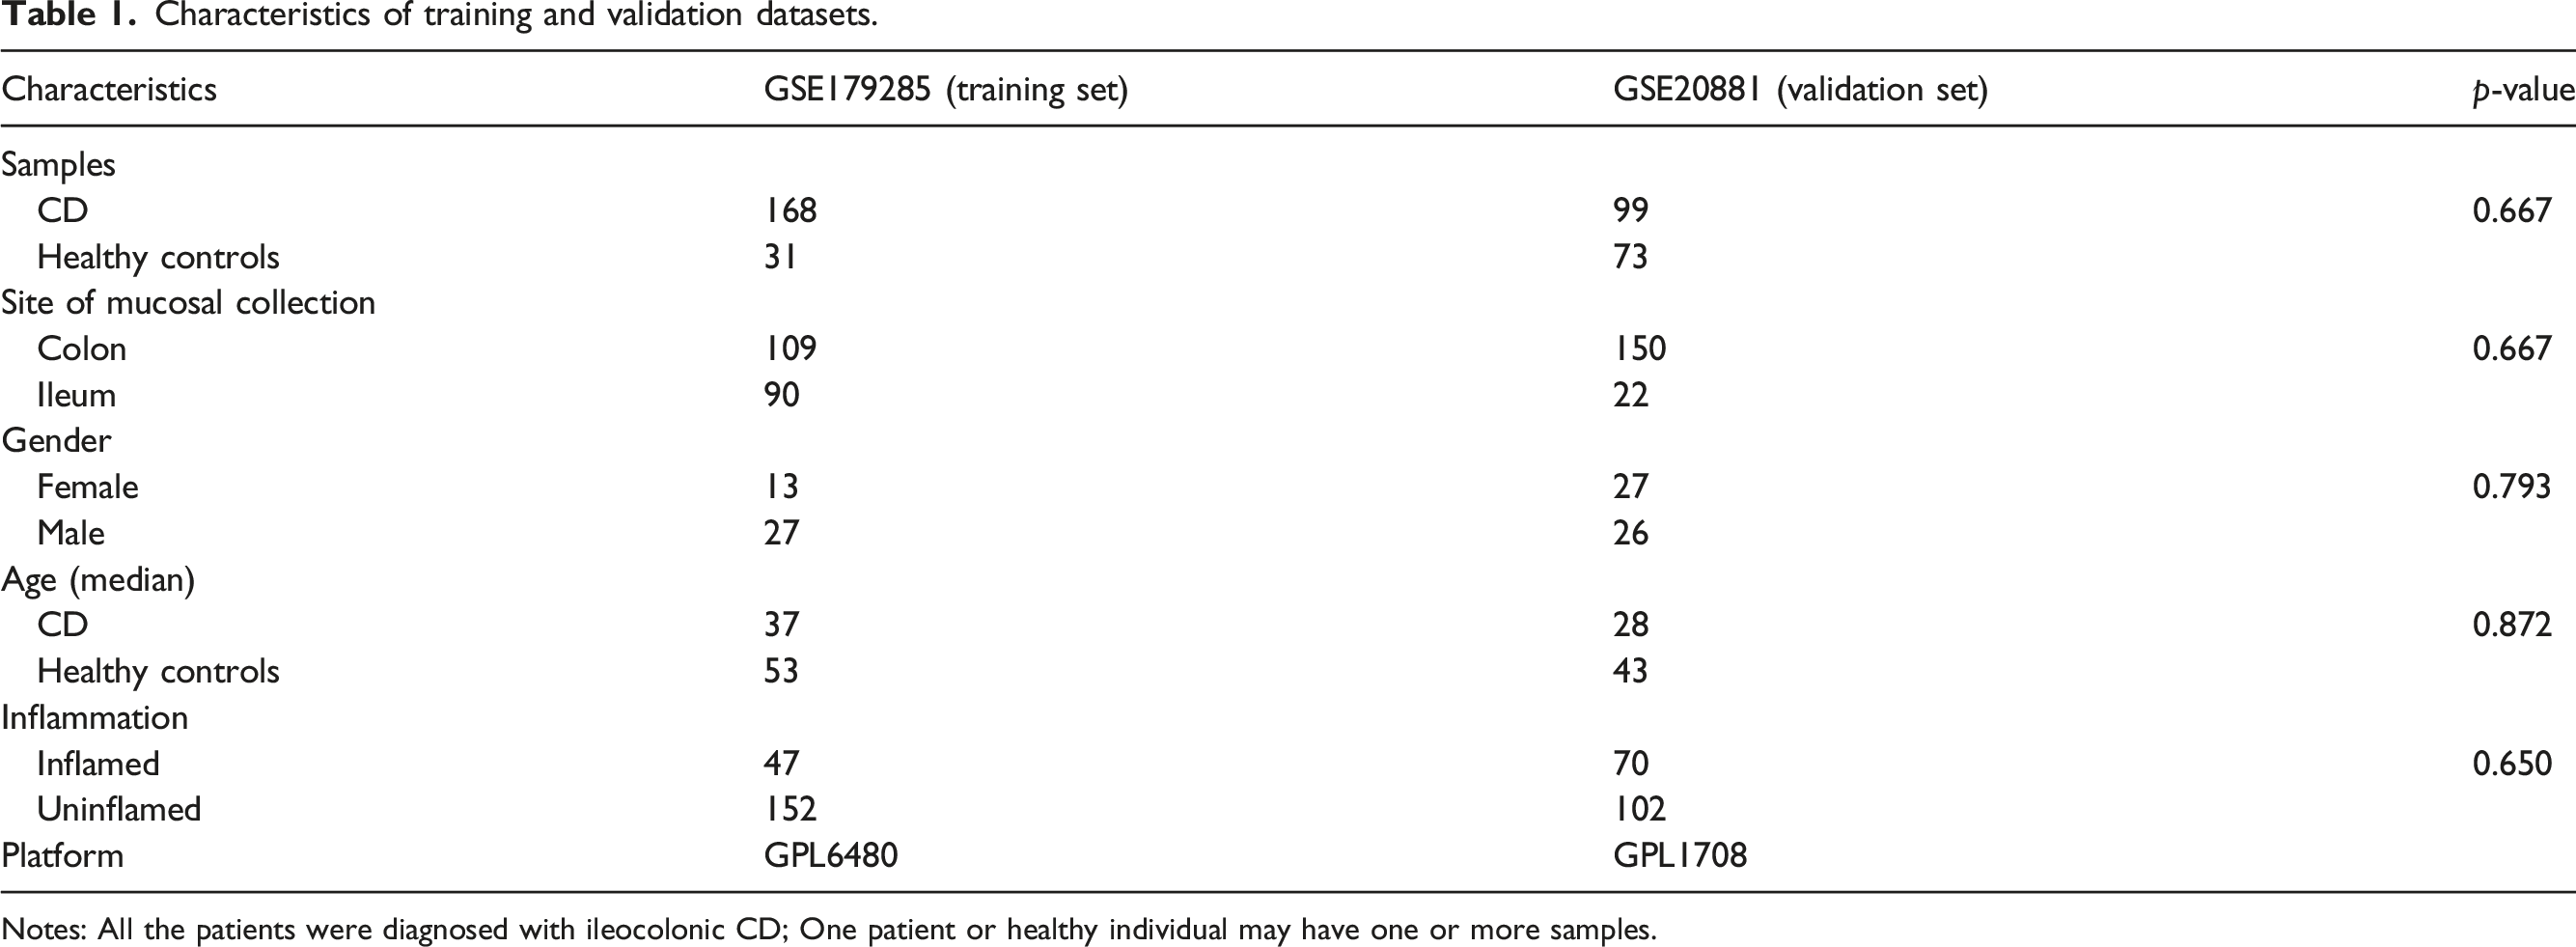
datasets were used in this study. GSE179285 was the training set, whereas GSE20881 was the validation set. Data on GSE number, numbers of samples, gender, sites of mucosal collection, platform, and inflammation are shown in Table1. There was no statistically significant difference (p > .05) between the training dataset and the validation dataset. The diagrammatic workflow of the preset study. Characteristics of training and validation datasets. Notes: All the patients were diagnosed with ileocolonic CD; One patient or healthy individual may have one or more samples.
DEGs between CD patients and healthy individuals
Based on the GSE179285, there were 1135 DEGs between CD patients and healthy individuals, in which 711 genes were upregulated whereas 424 genes were downregulated (Figure 2(a)). The expression profile of the top 50 most upregulated genes and the top 50 most downregulated genes (Supplement Table 1) were displayed using a heatmap (Figure 2(b)). (a) Volcano plots for the differentially expressed genes in the intestinal mucosa of CD patients and healthy individuals: red dots represent upregulated expressed genes, whereas blue dots represent downregulated expressed genes, and gray dots represent non-differentially expressed genes. (b) Heatmap for the top 50 most upregulated genes and the top 50 most downregulated genes.
Immune cell infiltration
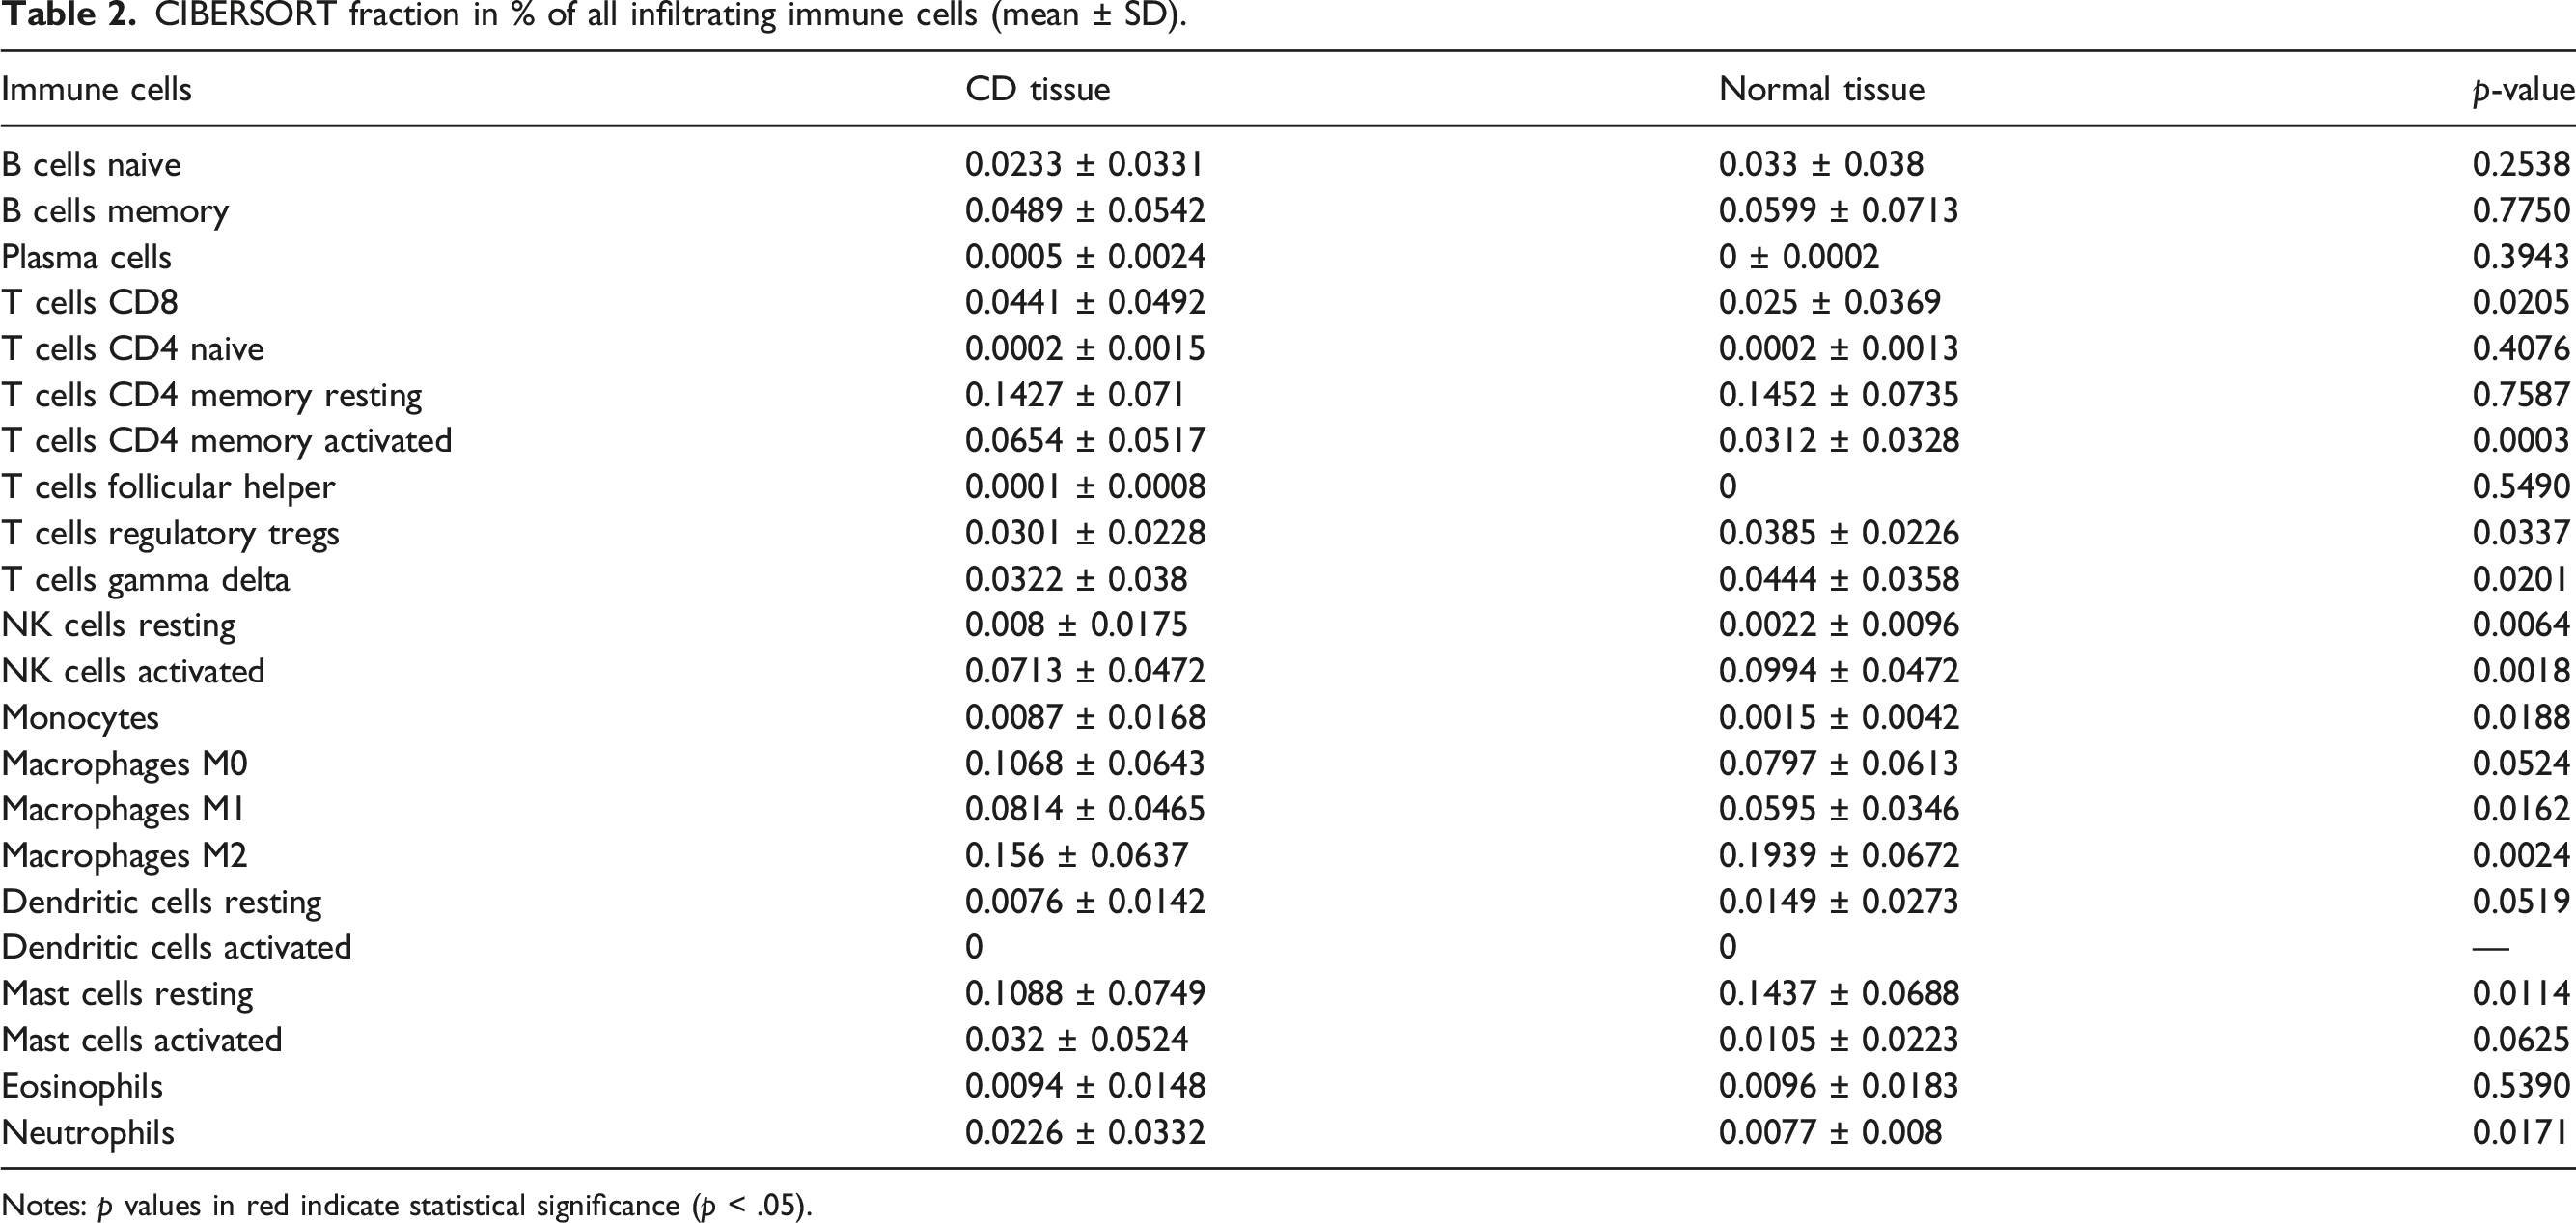
The proportion of immune cells varied between the intestinal mucosa tissues of CD patients and normal individuals (Figure 3(a) and (b), Table 2). Compared with normal tissue, the proportion of CD8 T cells, activated CD4 T cells memory, M1 Macrophages, and neutrophils were significantly higher in the intestinal mucosa of CD patients. Contrarily, a reverse trend was observed for T regulatory cells (Tregs), gamma delta T cells, activated NK cells, M2 Macrophages, and resting Mast cells (Figure 4(a), Supplement Table 2). The proportions of plasma cells, CD4 naïve T cells, activated dendritic cells were almost insignificant. There was a strong positive correlation between infiltration of M1 Macrophages and neutrophils (Pearson correlation = 0.519, p < .0001), but a strong negative correlation between infiltration of resting Mast cells and activated Mast cells (Pearson correlation = −0.523, p < .001) (Figure 4(b)) Overall, these findings demonstrated the complex, intricate network of immune response in the intestinal mucosa of CD patients. The proportion of infiltrating immune cells in the intestinal mucosa. (a) Health individuals. (b) CD patients. CIBERSORT fraction in % of all infiltrating immune cells (mean ± SD). Notes: p values in red indicate statistical significance (p < .05). (a) Box plot for the differentially infiltrated immune cells in the intestinal mucosa between CD patients and normal individuals. (b) Correlation heatmap for the correlations between infiltrated immune cells in the intestinal mucosa of CD patients. The Pearson correlation coefficient was applied for the test, *, p < 0.05, **, p < 0.01, ***, p < 0.001.

WGCNA and identification of hub genes
The soft thresholding power β was set at 18 in the subsequent analysis, because the scale independence reached 0.85 and had a relatively high-average connectivity (Figure 5(a)). Using the hierarchical clustering algorithm, most of the samples were clustered into one category (samples in a red dotted square box in Figure 5(b)) and were included for further analysis, whereas the remaining 23 samples, namely outlier samples, were divided into two categories and were excluded. The purpose is to reflect the values more realistically and to avoid compromising the quality of subsequent results. Four coexpression modules of DEGs were constructed by WGCNA (Figure 6(a)), and the relationship between modules and infiltration of the immune cells was performed. We found the most significant correlation between the turquoise module and infiltration of Macrophages M1 (cor =0.68, p = 1×10⁻²⁵) (Figure 6(b), Supplement Table 3). The immune-related gene in the turquoise module (GBP4) was then identified based on MM > 0.9 and GS > 0.7 (Figure 7(a)). The expression level of the hub gene is shown in Figure 7(b). Compared with healthy individuals, GBP4 was significantly upregulated in the colon and ileum of CD patients. (a) The network topology of various soft-thresholding powers. (a) The x-axis represents the softthresholding power, whereas the y-axis represents the scale-free topology model fit index. (b) The x-axis reflects the soft-thresholding power. The y-axis reflects the mean connectivity (degree). (b) The sample dendrogram and the infiltration of immune cells heatmap. 23 outlier samples were identified. Only samples in a red dotted square box were included. (a) Identification of modules by gene co-expression network. The branches of the cluster dendrogram represent the modules, whereas the leaves on the cluster dendrogram represent the genes. (b) Module-trait associations. Each row corresponds to a module, and each column corresponds to a proportion of infiltrating immune cell. Each cell contains the corresponding correlation and p-value. (a) Scatter diagrams for each gene in turquoise module and M1 Macrophages. (b) Box plot for the expression level of the hub gene. (c) GO analysis of the genes in modules. The node size reflects the gene count, and the node color reflects the p -value (−log10 (p value)). (d) KEGG analysis of genes in modules. The node size reflects the gene count, and the node color reflects the p-value (−log10 (p value)).


Functional enrichment analysis
The GO analysis showed that the brown module mainly regulated vesicle coating, vesicle targeting, Golgi vesicle budding, positive regulation of lipid biosynthetic process, and lipoprotein particle assembly, the grey module mainly regulated antigen processing and presentation, adaptive immune response, reactive oxygen species responses, interferon-gamma responses, immune effector process regulation, and the turquoise module mainly regulated interferon-gamma responses, immune effector process regulation, regulation of response to biotic stimulus, positive regulation of cytokine production, and leukocyte cell-cell adhesion (Figure 7(c), Supplement Table 4). The KEGG analysis further revealed that the grey module mainly regulated antigen processing and presentation, allograft rejection, viral myocarditis, graft-versus-host disease, and Type I diabetes mellitus, and the turquoise module mainly regulated antigen processing and presentation, allograft rejection, viral myocarditis, staphylococcus aureus infection, pertussis, cytokine-cytokine receptor interaction, leishmaniasis, and viral protein interaction with cytokine pathways (Figure 7(d), Supplement Table 5).
Linear model and ROC curve analysis
There was a positive linear correlation between the expression of GBP4 and infiltration of M1 Macrophages to the intestinal mucosa of CD patients (Macrophage M1 =0.0,359,382+0.0,061,959*GBP4, adjust r-squared=0.661, p < 2×10⁻¹⁶) (Figure 8(a)). The AUC for the diagnostic value of GBP4 for CD was 0.736 (Figure 8(b)). The strong correlation between the expression of GBP4 and infiltration of Macrophages M1 (Macrophage M1=0.000,9155+0.1,334,921*GBP4, adjust r-squared =0.435, p < 2×10⁻¹⁶), as well as the good diagnostic value of the gene for CD (AUC =0.702) (Figure 8(d)) was confirmed using the validation set. (a) Scatter plot and linear model of the hub gene and infiltration of M1 Macrophages based on GSE179285. (b) The ROC curve of the hub gene based on GSE179285. (c) Scatter plot and linear model of the hub gene and infiltration of M1 Macrophages based on GSE20881. (d) The ROC curve of the hub gene based on GSE20881.
Discussion
CD is a relapsing inflammatory disease, mainly affecting the gastrointestinal tract, and frequently presents with abdominal pain, fever, bowel obstruction or as well as bloody or mucoid diarrhea. 24 The precise pathogenesis of CD remains unclear, but it has been linked to excessive immune response.25–27 Unraveling the complex immune network underlying CD pathogenesis can uncover new targets for the treatment of the disease.
In the present study, we identified 1135 DEGs between CD patients and healthy individuals, some of which have been previously reported. OLFM4, which was the most upregulated gene, negatively regulates H. pylori-specific immune responses 28 and mucosal defense responses during inflammatory bowel disease. 29 The downregulated gene, FABP1, is a validated biomarker of CD diagnosis. 30 The function of other notable in CD such as CHP2 is not well understood. Furthermore, the upregulated gene expression was observed in the ileum, which is the most common site for the disease. 31
CIBERSORT revealed a significant difference in the proportion of immune cells in the intestinal mucosa of CD and healthy individuals. Macrophage and CD4+ T cells accounted for the largest proportion of the infiltrating immune cells. So far, it had already been reported that macrophage and CD4+ T cells played an important role in CD.32,33 Intestinal macrophages are a heterogeneous population of cells thought to be derived from classical blood monocytes, mediated by CCR2. 34 During inflammation, the recruited monocytes differentiate into inflammatory macrophages sensitive to stimulation by Toll-like receptors. The macrophages also secret pro-inflammatory cytokines, further promoting inflammation.35–37 In CD patients, the CD14+ macrophages, which secret abundant TNF-α, are the largest proportion of immune cells on the inflamed mucosa.38,39 The proportion of infiltrating macrophages in the intestinal mucosa of CD patients is in line with our analysis by CIBERSORT. CD4+ T cells can also release a large number of proinflammatory cytokines such as IFN-γ and IL-17/IL-22, and these cytokines contribute to the progression of CD. 40 We observed a significant difference in the proportion of resting NK cells, activated NK cells, monocytes, resting mast cells, and neutrophils in the intestinal mucosa of CD patients and normal individuals. Monocytes regulate the phagocytosis of pathogens, digesting processing and presentation of antigens, and releases of effector molecules such as chemokines and cytokines. Moreover, monocytes are thought to be the only source of intestinal macrophages, and changes in the composition of peripheral blood monocytes in CD patients have been reported.41,42 NK cells provide a rapid innate immune response, killing target cells without priming. Mast cells, which predominate at mucosal surfaces, are also crucial for early host defense. Mast cells selectively recruit and positively modulate the function of NK cells through soluble mediators such as interferons. 43
WGCNA of the GSE179285 dataset identified a strong link between the turquoise module and the infiltration of macrophages M1. GO analysis revealed the genes in the turquoise module mainly regulate interferon-gamma response, regulation of immune effector process, regulation of response to biotic stimulus positive, regulation of cytokine production, and leukocyte cell-cell adhesion. Interferon-gamma can induce transcription of metal transporter, which contributes to CD pathogenesis. 44 Interferon-gamma-target therapy can be used in treating active CD. 45 Inflammation is closely related to regulating the immune effector process, response to biotic factors, production of cytokine, and adhesion of leukocytes to endothelial cells. 46 KEGG analyses demonstrated that staphylococcus aureus infection, pertussis, cytokine-cytokine receptor interaction, leishmaniasis, and interaction of the viral protein with cytokine and cytokine receptor were important pathways in our study. Staphylococcus aureus, 47 pertussis, 48 and leishmaniasis 49 are some of the opportunistic infections in CD patients due to immunomodulation and immunosuppressive therapies.
Herein, we found a strong linear relationship between the expression of GBP4 and the infiltration of M1 macrophages in CD patients. Guanylate Binding Protein 4 (GBP4) regulates innate immune response via interferon-gamma. GO annotations revealed that GBP4 regulates several biological processes, including GTP binding and GTPase activity. Little is known about the GBP families. In mice, GBPs protect against lethal bacterial infections 50 through the GBP4 inflammasome-dependent production of prostaglandins. 51 Moreover, GBP4 is an immune-related signature biomarker for predicting prognoses and immunotherapeutic responses in patients with muscle-invasive bladder cancer, 52 and an immune microenvironment biomarker for the prognosis of ovarian cancer. 53 More importantly, GBP4 play an important role in molecular feature correlating with tumor immunity and distinctive immunoregulatory microenvironment in colorectal cancer.54,55 Also, GBP4 takes part in the type-I interferon response and displays a positive correlation with macrophages. 56 However, there is no report about CD with GBP4.
Regarding limitations, first, the results are based on the computational algorithm. Although the accuracy of this technique has been validated, the finding of this study should be verified using in vivo experiments in the future. Second, given the small sample size, the finding of this study may have been exaggerated.
Conclusion
In conclusion, there is a significant difference in the infiltration of immune cells to intestinal mucosa tissues of CD patients and healthy individuals. Given that GBP4 is a differently expressed gene between healthy individuals and CD patients and is a driver gene of macrophages, the gene is a potential immunotherapeutic target for CD treatment.
Supplemental Material
Supplemental Material - GBP4 is an immune-related biomarker for patients with ileocolonic Crohn’s disease by comprehensive analysis
Supplemental Material for GBP4 is an immune-related biomarker for patients with ileocolonic Crohn’s disease by comprehensive analysis by Heng Shi, Shengyun Sun, Xianling Zhou, Yushan He and Qin Peng in European Journal of Inflammation
Footnotes
Author contributions
HS gained the data, analyzed and interpreted the data, drafted the article; QP analyzed the data and drafted the article; XZ gained and analyzed the data; YH analyzed the data; SS and QP critically revised the manuscript. All authors provided final approval.
Declaration of conflicting interests
The author(s) declared no potential conflicts of interest with respect to the research, authorship, and/or publication of this article.
Funding
The author(s) received no financial support for the research, authorship, and/or publication of this article.
Ethics approval
Ethical approval was not sought for the present study because the GEO database is publicly available and all patient data were de-identified.
Informed consent
Informed consent was not sought for the present study because the GEO database is publicly available and all patient data were de-identified.
Data availability statement
Supplemental Material
Supplemental material for this article is available online.
References
Supplementary Material
Please find the following supplemental material available below.
For Open Access articles published under a Creative Commons License, all supplemental material carries the same license as the article it is associated with.
For non-Open Access articles published, all supplemental material carries a non-exclusive license, and permission requests for re-use of supplemental material or any part of supplemental material shall be sent directly to the copyright owner as specified in the copyright notice associated with the article.