
Abstract
The weak part of the stiffness of machine tool combined structure is the key to improve the stiffness of machine tool. To overcome the static deformation with difficulty acquisition, the paper chooses machine tool combined structure which can be equivalent to one-dimensional bar structure, and a weakness index (WI) is proposed to identify the weak part of the stiffness by means of the dynamic hammer test method. Based on the bar structure as a numerical example, the weak parts are modeled as EA reduction in stiffness while the mass is maintained at a constant value. Thorough finite element (FE) method simulations are performed to assess the robustness and limitations of the method in several scenarios with single and multiple weakness. On the crossbeam of gantry type machine tool, the sensors are used to collect vibration data, the structural modal parameters are obtained by singular value decomposition (SVD) technique, and the dynamic characteristics are systematically reconstructed by using modal state space method to obtain stiffness data at zero-frequency. Then, the weak part of the structural stiffness is identified by the weakness index. Finally, the comparison of FE simulations and experiment results are provided to illustrate the working of the method.
Keywords
Introduction
The excellent machining performance of the machine tool is closely related to its dynamic performance. The deformation during machining will not only affect the accuracy of the machine tool and the surface quality of the workpiece, but also reduce the productivity and cutter lifespan, and it even reduce the useful life of the machine tool. The stiffness is essential parameter that directly affects the accuracy of CNC machine tool, and the stiffness of machine tool improved can effectively enhance the machining accuracy of parts. 1 In order to enhance the stiffness of machine tool, it is necessary to know the stiffness of each parts of the machine tool, including the stiffness of structural parts and the stiffness of joint surface, so that the best effect can be achieved by increasing the stiffness at the most weakest parts. 2
The existing identification methods for the weak parts of the machine tool structure are mainly divided into static stiffness method and dynamic stiffness method. Two general methods based on static stiffness which have been often employed to identify weak parts in machine stiffness. The first method is the static stiffness test, which mainly measures the deformation of each structure of the machine tool by pressing the load on the key parts of the machine tool. By selecting the conversion center, the structure with the location of largest deformation is calculated, which is the weak part of the machine tool stiffness. 3 The second is to calculate the maximum deformation position through FE static analysis. The static load applied to the key parts of the machine tool is recorded by the dial indicator 4 or eddy current sensor 5 to acquire static deformation data during the static deformation testing. Both of the two methods need to select the test reference point and the clamped device for fixing the test device. However, the clamped device is difficult to find a suitable location to be installed during the measurement, and the selected reference point is also prone to deformation occurred, affecting the test accuracy.6,7 Through FE static analysis, the accuracy of the FE model at the joint surface cannot be guaranteed, leading to large error for FE analysis. In general, the static stiffness method is not simple and the low-accuracy for static conditions.
The second is the dynamic stiffness test method, which is a combination of FE and experimental modal analysis. The dynamic test method needs to build an accurate FE model. Firstly, the preliminary FE analysis of the established machine tool model is carried out. Secondly, the actual machine tool is tested, and the parameters of the FE model are modified according to the experimental results. The FE analysis results performed again on the modified model are compared with the experimental results again. This is repeated until the FE analysis results are consistent with the experimental results. The final FE model is used for analysis to obtain the weak parts of the machine tool structure. 8 The machine tool is a composite structure, and the joint parameters between the modified structures are the main research objects. Then, the modified approach for the consistency between the results of FE analysis and experimental test may not be unique, so the modified approach have complexity and blindness, resulting in complex algorithm and low accuracy of the analysis results.
In the engineering application, it is necessary to identify the weak parts of the stiffness of machine tool with quickly, simply and accurately. The position of bar-shaped combined of machine tool may be the weak parts of stiffness, such as the series structure of the crossbeam, the slide, the ram, and the guide rail combined in gantry machine tool. In this paper, the identification method of the weak parts of bar structure is studied to explore the identification of the weak parts of the stiffness of the machine tool cantilever structure.
The damage identification technology is similar to the research on the weak identification of machine tool combined structure. The application of the damage identification technique in beam bridges has attracted most attention, given that damage usually occurs at limited positions in the use stage of structural failure. Hence, we can refer to the identification algorithm of bridge stiffness to identify the weak parts of the stiffness of the machine tool cantilever structure. One of the most widely used methods for damage identification is structural modal testing and analysis,9–12 and according to the identification analysis, the changes of natural frequency and modal shape in the modal parameters are obtained to measure the size and location of the stiffness changes.
Guo et al. 13 developed a novel approach by the reconstructed data and measured data to identify the low stiffness of the cantilever structure. Fourth-order derivatives of the mode shapes were employed to detect and locate the damage in simply supported and cantilever steel-plate model structures but with the drawback of a heightened sensitivity to measurement noise. 14 In the absolute difference mode shape curvature (ADMSC) method, this method is based on the difference between the intact curvature mode shape and the damaged curvature mode shape to detect and locate the damage location of the beam structure. The limitation of this method is that depends on undamaged modal response of the structure.15,16 Sha et al. 17 proposed a local damage detection and monitoring technology based on the relative natural frequency changes only. However, a possible limitation of the method is that it always yields possible damage locations symmetrically. Such limitation is common in natural frequency-based methods. Alshalal et al. 18 used the residual error defined based on the equations of motion to identify the damage of the FE model structure of one-dimensional bar and two-dimensional beam structures. The intrinsic parameters of the FE model can be known, once the identified objects become an actual model, the intrinsic parameters can be unknown in the model. Nguyen et al. 19 proposed a new damage identification method based on the ratio of the geometric modal strain energy to the eigenvalue, and the effectiveness and practicability of this method were verified by a numerical truss bridge example. However, the study only considers the damage identification method of the structure with constant cross-section. Wei et al. 20 proposed a new method for identifying the dynamics of the human body and the empty structure in a human structure system, based only on the measured FRF of the composite system. But zero-frequency response data cannot be extracted from dynamic test. Kanta and Samit 21 utilized the change of mode shape and curvature to detect and quantify the damage in railway truss bridges, and the damage degree was evaluated by Bayesian damage identification algorithm with sensitivity. However, when the measured data is polluted by high-level noise, the accuracy of the modal parameters of the structure is affected.
There are two differences between the application of the weak identification algorithm and the damage identification. Firstly, the weak parts exist at the beginning of the manufacturing process, not in the later use process. Secondly, even the machine tool structure which can be equivalent to cantilever beam and bar structure is also complex and unequal cross-section. This paper a fast, accurate and simple to implement weakness index (WI) for identifying the weak part of the stiffness of cantilever structure of machine tool. The difference in the WI between the intact and the weak case is utilized to identify the location of the weak stiffness. The bar model and machine tool combined structure are used to demonstrate this characteristic of the WI. The identification method provides a solution to overcome the problem that it is difficult to obtain the static deformation of the machine tool structure under study and therefore does not require using the static and dynamic stiffness of identification method of the machine tool structure studied above. In this identification method, the response of the internal structure of the system model can be obtained by reconstructing the state space with the hammering dynamics test system, and the low-frequency data of the bar-shaped combined structure is extracted from the state space model. Then, the measured data and the reconstructed original data are utilized to identify the weak parts of the stiffness of the combined structure. This paper mainly studies the low-frequency characteristics of the structure (i.e. 0 Hz signal) which can best reflect the machining characteristics of the machine tool. The proposed method can be applicable to the cantilever combined structure of machine tool which can be equivalent to bar structure, to identify the weak parts of structural stiffness using the hammer test.
Following this introductory section, Section 2 introduces the theory for the identification of the dynamics of discrete model of the machine tool. The static stiffness value of the system frequency response function (FRF) at zero frequency is obtained by using the dynamic characteristic analysis of the multi-degree-of-freedom system. In the Section 3, the modal parameters are obtained by singular value decomposition (SVD) technique, and the internal response of the system model is reconstructed by modal state space method to extract the zero-frequency data of bar-shaped combined structure. Based on the measured data and reconstructed original data, the weakness index is established to identify the weak parts of stiffness. A numerical illustration of the working of the method is presented in Section 4, whilst its experimental demonstrations are presented in Section 5. Conclusions are drawn in Section 6.
Theoretical analysis
Theoretical model
Machine tools are made up of structural parts with an infinite number of degrees of freedom. In dynamic analysis, according to the specific structure of the machine tool, the machine tool can be divided into several substructures of concentrated mass. The substructures are connected by an equivalent spring and an equivalent damper to form a dynamic model. In this paper, the bar structure of machine tool is considered. Regions a, b, c, and d represent the regions excluding the joints in substructures (1), (2), (3), and (4), respectively. Region

Simplified diagram of discrete structure of machine tool.
System frequency response analysis
Figure 2 shows a multi-degree-of-freedom mass-spring-damper model. When the vibration amplitude of the simplified spring is small, the relationship between the deformation and the force of the elastic body conform to Hooke’s law. When the system is excited, the FRF of acceleration type is expressed as follows
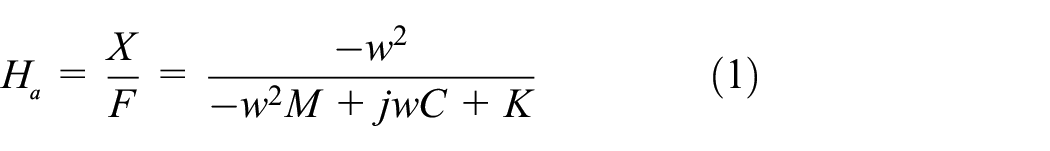
where
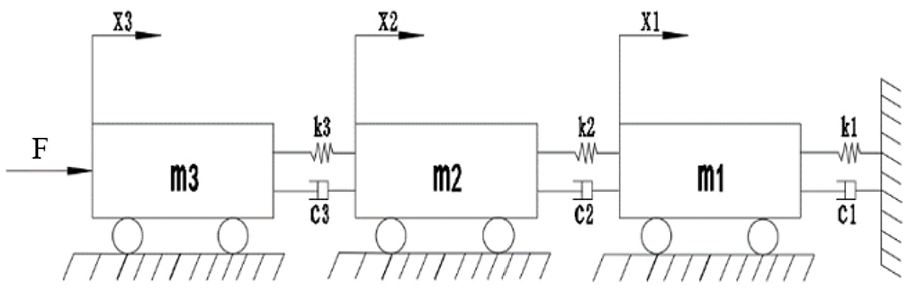
Three-degree-of-freedom vibration system.
For a three-degree-of-freedom vibration system, the matrix of the system’s impedance matrix Z can be described by

Where
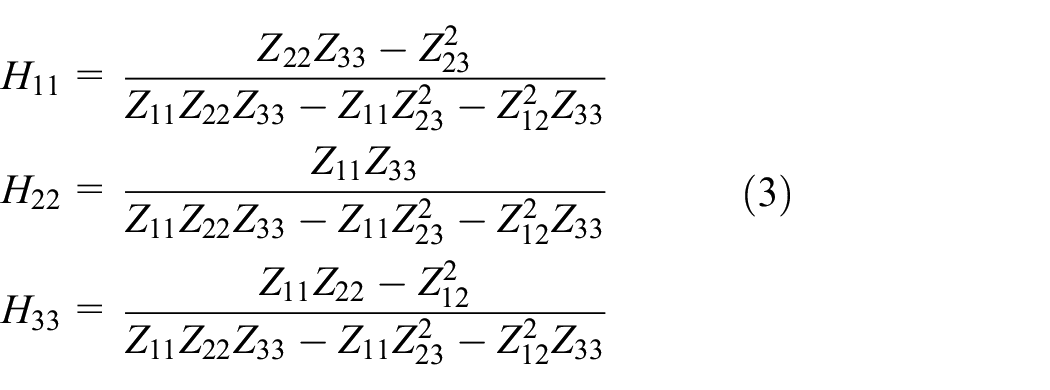
Therefore, for the three degree of freedom system, the FRF can be expressed as
When the w is equal to zero, the FRF of the system can be re-written as
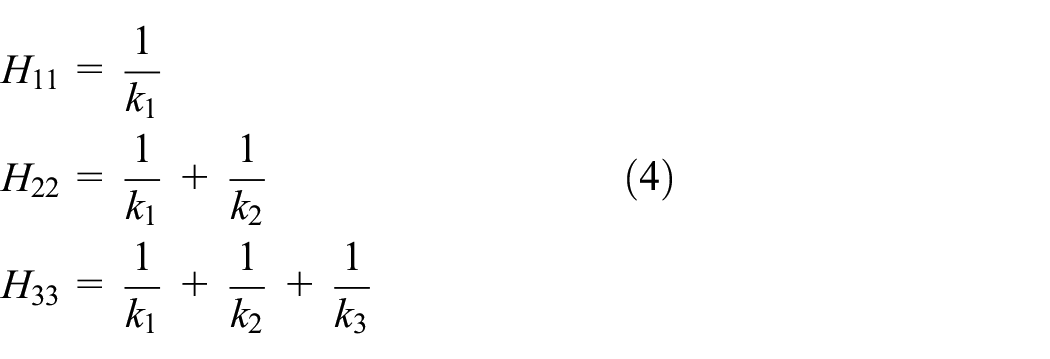
It can be seen from equation (4) that the motion of mass block only depends on the spring stiffness and has nothing to do with mass. The dynamic characteristics of the system present pseudo-dynamic characteristics, that is, static stiffness characteristics. When the excitation force is constant, neither mass nor damping will work, the FRF of the system is only related to the systematic stiffness. When the excitation force is a pulse signal acting on the system, the systematic static stiffness can be obtained by solving the FRF value at the zero-frequency and the value inverted.
Identification of weak parts
The structure dynamic test method of the hammer testing is easy to be realized on bar-shaped combined structure. Acceleration sensor is a kind of vibration pick-up equipment with high precision, low requirements of environment and installation condition. In this paper, the acceleration data of bar-shaped combined structure is collected by the acceleration sensor, the modal parameters of the structure are obtained by the singular value decomposition (SVD), the modal state space method is used to reconstruct the dynamic characteristics of the bar-shaped combined structure and obtain the static stiffness data at zero-frequency, which can best reflect the machining characteristics of machine tool. Finally, the novelty of the proposed identification index is to identify the parts of the weak stiffness in terms of weakness index obtained by the measured data and the reconstructed original data.
Model parameters
This chapter uses ERA (eigensystem realization algorithm),22,23 which is a method for global modal parameters identification in input-output time domain to solve the system identification problem of dynamical models that mathematically describe multibody mechanical systems. The key idea is to decompose the data matrix of the measured free impulse response by means of the SVD technique, the identification method can handle noisy signals properly because it has a build-in noise rejection mechanism via the usage of truncated SVD. A computer program developed in MATLAB is used for performing the dynamic analysis to extract natural frequencies, damping ratios and mode shapes.
Response reconstruction theory
The state space method is a powerful tool for solving the differential equations. Design and analysis of most of modern dynamic control systems are also on the basis of this approach. 24 In the state space method, high-order differential equations are described by a set of first-order differential equations. The single differential equation or transfer function can not fully reveal the motion state of the structure system. The reconstruction of state space makes up for the lack of reflecting the change of internal parameters, and can completely determine the motion state of all internal variables of the bar-shaped combined structure.
It should be mentioned here that the section presents the differential equation of vibration of the bar-shaped combined structure for the jth mode. The objective of dynamic model be used to obtain the state space matrices and extract the zero frequency data.

where
The general state of the system model is identified by the system state vector z(t) having a dimension

Where
By using the definition of the system state vector, the equations of motion and the measurement equations of the system can be easily rewritten in the state space form as follows

where A is the continuous-time system state matrix, B denotes the continuous-time input influence matrix, C identifies the output influence matrix, v(t) represents the output vector and u(t) represents the input vector.
The matrices A, B, and C which can be explicitly obtained as follows


Where M is the system mass matrix, C represents the system viscous damping matrix, K denotes the system stiffness matrix, I is a unit matrix,
When the external structure is not uniform cross-section bar or does not know whether it is uniform cross-section structure in advance, the system information can not be obtained from A matrix, so the response of the internal structure of the system model can only be obtained by state space reconstruction of the test system, and then the zero frequency data of bar-shaped combined structure can be successfully extract from state space model.
Proposed identification method
In order to compare the stiffness of each part of the bar-shaped combined structure, the stiffness of the uniform cross-sectional bar structure is used as the measured standard in this paper. The statics equation of bar deformation is as follows

Where u(x) is the displacement of the measured point of the bar structure, F is the dynamic impact force under the static characteristics, E is the elastic modulus of the bar material, A is the cross-sectional area of the bar; x is the distance from each node to the fixed-end.
The test data at the zero frequency is represented by the

Where
According to the zero-frequency measured data at first measured point, a set of original data is constructed

According to the data

Where
Using

Where
The

Where
In accordance with the measured data (11) and the original reconstructed (15), the weakness index (WI) is defined as

Where WI is the calculated weakness index, and h is the distance between adjacent measured points.
The suggested
According to the above analysis, when weak parts appear in the bar-shaped combined structure, the WI between two measured points of weak location will change dramatically compared with other positions. The mutation location evaluates the stiffness of the weak part of the structure. Whether the bar-shaped combined structure is uniform cross-section or not. In this paper, we use the bar structure as the standard to measure the weak part of stiffness. In fact, most of the machine tool structures are not uniform cross-section structures, such as the measured structures in this paper.
Numerical validation
The purpose of using the FE model is to verify the validity of the identification algorithm, because the intrinsic parameters of the FE model can be known and adjusted to verify the accurately of the identification algorithm. Once the identified object becomes an actual model, the unknown intrinsic parameters in the model, the accuracy of the identified results cannot be known. Therefore, the FE model analysis of bar structure is very important.
In the model, the weak part is modeled by a constant stiffness EA reduction in an element, where the stiffness reduction is represented by a stiffness reduction ratio (SRR), defined as the ratio between the reduced and original EA. The degree of weakness is then related to the extent of reduction, EA. The identification effect of WI is verified with the shift of weak location and the uniformly change of weak degrees. In practical cases, input noise and output noise inevitably exist in test system. Thus, the measured vibration data are contaminated with noise to investigate the behavior of the proposed WI in noisy conditions, so as to ensure that the weak parts of structural stiffness can be accurately identified in measured.
Research on the bar structure
Simulation model
An uniform cross-sectional bar structure showed in Figure 3 is used to verify the weak identification method described above. The length of the bar structure is L = 1.2 m, uniformly divided into 20 elements with two nodes each with a degree-of-freedom (DOF). The modulus of elasticity and mass density of all elements are E = 210 Gpa and ρ = 7850 kg/

Finite element model of bar structure.
The element stiffness matrix and mass matrix of the bar structure are shown in equation (17). The global matrix for the mass and stiffness can be obtained by assembling the elemental mass and stiffness matrices. Proportional damping C = αM + βK (α = 10−12, β = 10−5) is assumed. Similarly, the FE model of the bar structure is constructed by state space method. which can reflect the motion state of all internal variables of the structure. There is an impulse acting at the horizontal direction of the 21st node. In the FE analysis, the sampling frequency is 10 kHZ and the simulation analysis time is 15 s. An acceleration sensor is placed at each node of the bar-shaped structure to collect transversal vibration data.
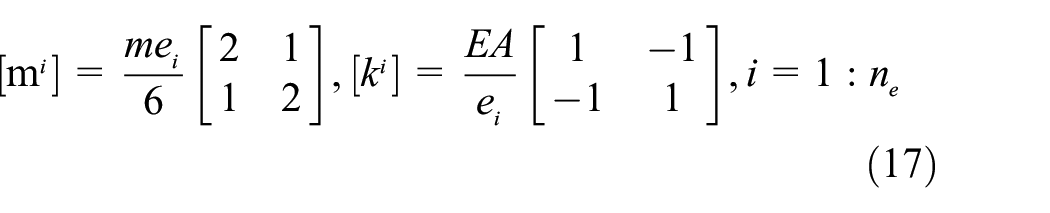
where
Figure 4 shows the natural frequency of the bar structure from the simulation via modal analysis. The Theoretical natural frequency for the bar structure shown in Figure 3 can be determined using equation (18). The presented results in Table 1 for the first three natural frequencies of bar structure show good agreement between the numerical analysis in present work and analytical analysis.


The simulation results of the natural frequency of node 10.
Natural frequencies of simulation calculation and theoretical calculation.

Weak identification
A study is carried out in which weakness is prescribed in the number of randomly specified elements of the bar structure. The intensity of weakness is varied by changing the EA over the range of 0.1 to 0.3. This represented the case of a varying degree of damage at a particular location. Three weak cases with different locations and size of EA reduction are elaborated as shown in Table 2, including the noise free scenario and the noise scenario. Cases 1 denotes the single weak location problem, cases 2 denotes the two weak cases, and cases 3 denotes the multiple weak location problems. The weakness cases are used to verify the validity of the identification of weak elements. The case without noise is represented by E-element. The case with noise is represented by EN-element.
Weak scenarios for bar model.

The absolute differences between the WI of the intact and the weak bar structure are plotted in Figures 5 to 7. The maximum mutation difference for each WI occurs in the weak parts, which is between weak elements for this case. The differences in the WI are localized near the weakness parts, that is, it approach zero outside the weak parts. This characteristic of WI can be very useful in locating the weak parts.

The weak location results of weak case 1 of the bar structure: (a) weakness identification results and (b) weakness identification results under noise scenario.
The weak location results of weak case 2 of the bar structure: (a) weakness identification results and (b) weakness identification results under noise scenario.

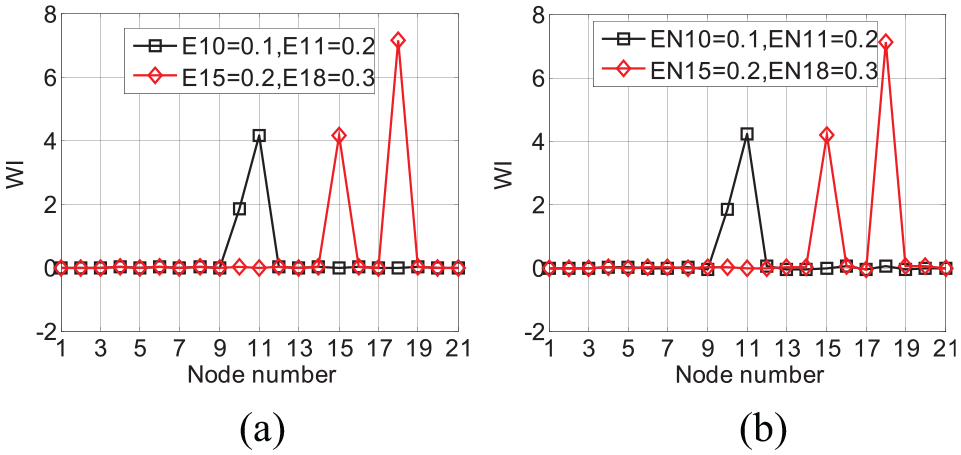
The weak location results of weak case 3 of the bar structure: (a) weakness identification results and (b) weakness identification results under noise scenario.
As showed in Figures 5(a), 6(a), and 7(a), it can be observed that the WI can identify the weak parts of stiffness accurately without taking the noise into consideration. At the location of the weak parts of structural stiffness, there is a significant mutation in the weak stiffness, and the mutation values increases with weak severity.
As showed in Figures 5(b), 6(b), and 7(b), in order to verify that the WI can identify the weak stiffness in noise case, so the measured data are contaminated with signal-to-noise ratio (SNR) of 10 dB to represent measurement noise. It can be seen that the added noise does not affect the identification effect on the bar structure. Hence, the WI can still accurately identify the weak part of stiffness under the noise case.
Research on the stepped bar structure
Simulation model
A FE model of a stepped bar structure is built using nine elements with two nodes each with a degree-of-freedom (DOFs), shown as Figure 8. The geometrical parameters and material properties of the bar are taken as length 1.2 m, elastic modulus 210 GPa, density 7850 kg/m3, and cross-sectional area

Finite element model of stepped bar structure.
Weak identification
Weakness is introduced by reducing the EA of some elements. Weak cases with different locations and size of weakness are elaborated as shown in Table 3, including the noise free scenario and the noise scenario. Cases 1 denotes the single weak location problem, case 2 denotes the two weak cases, and case 3 corresponds to a multiple-weakness scenario at three locations. The case without noise is represented by E-element. The case with noise is represented by EN-element.
Weak scenarios for the stepped bar model.

The results in Figures 9(a) and 10(a), show that the WI method can identify and locate the weak parts of stiffness without taking the noise into consideration relative to the intact stepped bar structure. At the location of the weak parts of structural stiffness, there is a significant mutation in the weak stiffness compared with the intact stiffness. When the weak severity increases from 10% to 30% in the stepped bar, the identification of the WI method becomes clearer as the mutation become larger, which gives an indication of the weak identification in the weakness simulated element as observed.

The weak location results of weak case 1 of the stepped bar structure: (a) weakness identification results and (b) weakness identification results under noise scenario.
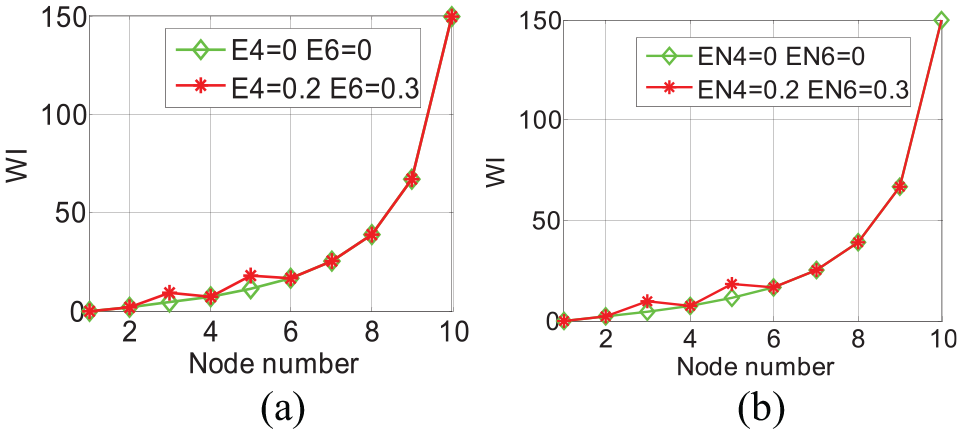
The weak location results of weak case 2 of the stepped bar structure: (a) weakness identification results and (b) weakness identification results under noise scenario.
In order to verify that the WI can identify the weak stiffness in noise case, so the measured data are contaminated with SNR of 10 dB to represent measurement noise. It can be seen that the added noise does not affect the identification effect of WI on the bar structure, shown in Figures 9(b) and 10(b). Hence, the WI can still accurately identify the weak part of stiffness under the noise case.
Based on the above analysis, the results from the numerical study show that the proposed WI method can be competent to identify the weak locations for both single and multiple weak cases with reasonable accuracy. It is worthwhile to note that the identification of non-uniform sectional stiffness is the focus of this paper, just like the bar-shaped structures of machine tool.
Experimental validation
Experimental setup
The paper focuses on the one-dimensional bar structure of machine tool bar-shaped combined structure. The biggest difference from the uniform-section bar structure is that the bar-shaped combined structure of machine tool is a structure with non-uniform section stiffness. Therefore, the feasibility of applying the new index to the actual machine tool is verified by identifying the weak parts of the machine tool bar-shaped combined structure. The machine tool investigated in this paper, as an example, is the XHAF2420 × 40 heavy gantry type machine tool, and its structure is illustrated in Figure 11. The partial combined structure of XHAF2420 × 40 heavy machine tool is equivalent to the machine tool bar-shaped combined structure of the one-dimensional bar structure to identify the weak parts of stiffness.

The structure of the XHAF2420× 40 heavy gantry type machine tool: (a) the real structure of the machine tool and (b) the simplified finite element model.
Vibration test
As shown in Figure 12(a), the test object is a series structure composed of screw nut, slide plate, guide rail and ram, which is installed on the crossbeam of the machine tool to form a machine tool bar -shaped combined structure. The experimental structure, is tested in the weakness condition, where weakness is introduced as the joint surfaces between structures. The sensor placed the bar-shaped combined structure of the machine tool has a joint surface between two measured points in Figure 12(b). An impulse hammer (SN38360), and seven accelerometers (B&K4514B-001) are used to excite the screw nut structure and measure Y-direction response data. The data acquisition system (LMS-SCM05) consisted of a laptop, a 32-channel data logger is used to gain the measured data of each sensor. Due to the high accuracy of low-frequency signals in the experiment, we need to recalibrate the sensitivity of the accelerometer with a sensor calibrator before the experimental test. The parameters of the spectrum analysis are selected as shown in Table 4.

Bar-shaped combined structure of machine tool and measurement points: (a) experimental setup for bar-shaped combined structure and (b) physical drawing of sensors placement.
Spectral analysis parameters.

Identification results
The experiment via modal testing to obtain the frequency spectrum and the time-domain signal of the system. Figure 13(a) and (b) are the time-domain diagram and the frequency spectrum diagram of bar-shaped combined structure of machine tool, respectively. The purple dot rectangle represent the first four modal parameters of the bar-shaped combined structure enough to simulate the dynamic performance of the bar under low frequency vibration. It can be seen from the figure that the influence of noise interference is relatively large and the curve is not smooth enough.

Response of bar-shaped combined structure of machine tool: (a) the measured time domain and (b) the measured frequency spectrum.
However, the modal parameters of the structure are obtained by the singular value decomposition (SVD), the system matrix of A, B and C in modal state space equation can be obtained by using the first three modal parameters, the modal state space method is used to reconstruct the dynamic characteristics of the bar-shaped combined structure, which extracts the static stiffness data at zero frequency. Finally, in terms of weakness index proposed identifies the weak parts of the machine tool bar-shaped combined structure by the measured data and the reconstructed original data. The identification results of the weak parts of the structural stiffness are shown in Figure 14. It can be seen that there is mutation between any two measured points. The joint surface is the place where the structural stiffness appear weakness, so there will be mutation cases between the measured points, which is consistent with the actual situation. Therefore, the experimental results confirm the validity of the proposed method to accurately identify the weak parts of the bar-shaped combined structure of machine tool.

Identification result of bar-shaped combined structure of machine tool.
Conclusions
In this article, a new local stiffness identification method, the so-called simultaneous WI, based only on the measured data and reconstructed original data is developed to identify the weak parts of the stiffness. The numerical and experimental results show that the proposed method is capable of identifying single and multiple damage in a bar-shaped combined structure of machine tool. Furthermore, the proposed method offers the following main advantages:
It identifies weak parts, taking advantage of dynamic hammer test method for facilitation and reliability in measurement;
The proposed WI can be capable of identifying single and multiple weak scenarios with noise case in a bar-shaped combined structure, relying solely on the measured data and the reconstructed data;
To solve the static stiffness with difficulty acquisition, the modal state space method is used to reconstruct the dynamic characteristics of the bar-shaped combined structure, which can greatly improve the identification accuracy to identify the weak parts of the stiffness;
The WI method can be used to identify the weak parts of the bar structure with uniform cross-section stiffness, and it can also be used to identify the stepped bar structure with non-uniform stiffness. Moreover, the experimental results confirm the proposed method to accurately identify the weak parts of the bar-shaped combined structure of machine tool;
The merit of the WI method does not need to know exactly the parameters of each joint surface, thus the study of the joint surfaces is skipped. Under the condition of low-frequency vibration, the WI of static characteristic is used to identify the weak parts of machine tool stiffness considering only the dynamic test data with quickly, simply and accurately;
Only by this dynamic test method can solve the complexity of FE modeling and the blindness of identification, as well as the differences between the FE modeling and actual machine tool structure, resulting in inaccurate results. Meanwhile, the method has certain practical engineering value and provides a guidance for the optimization of machine tool stiffness.
The main purpose of the method is to identify the weak parts of the stiffness of bar-shaped combined structure of machine tool. However, the weak degrees of the weak parts have not been quantified, and the future work will focus on quantitative research on the weakness.
Footnotes
Handling Editor: James Baldwin
Declaration of conflicting interests
The author(s) declared no potential conflicts of interest with respect to the research, authorship, and/or publication of this article.
Funding
The author(s) disclosed receipt of the following financial support for the research, authorship, and/or publication of this article: This work was financially supported by National Natural Science Foundation of China (Grant No. 51875009), Natural Science Foundation of Beijing Municipality (Grant No. 3162005).