
Abstract
The most usual failure mode of any mechanical structure is fatigue, which is characterized by an important feature of the decrease of elastic modulus of the material. In this paper, a fatigue life evaluation model based on equivalent elastic modulus is proposed for in-service mechanical structure. In the proposed model, parameters that represent the operating conditions of the mechanical structure, such as load, vibration, and shaft torque, etc., are used as the generalized load. To replace the fatigue stress, the statistical method is used here, which is also used in the conventional fatigue analysis method. The structural strain is also measured simultaneously. Using the statistical theory, the equivalent modulus of elasticity is formulated based on the relationship of stress, strain, and modulus of elasticity. To validate the proposed model, an online fatigue damage experiment has been conducted. The experimental results have been compared with that of the fatigue life prediction model with good agreement. It is expected that the methodology proposed in this paper will be widely used.
Keywords
Introduction
The working conditions of the key parts of mechanical equipment are complex and the operating environment is not always favorable. In the long-term operation, the structural strength of the key parts of the equipment keeps decreasing and it fails eventually. Fatigue failure is one of the most typical failure modes of key parts of the mechanical equipment, especially for the mechanical structure under cyclic or fluctuating loads. At present, the research on the fatigue state of mechanical structure is primarily focused on two aspects: life prediction and reliability evaluation.1,2 The research on life prediction mainly targets the prediction theory and method of the remaining service life of the mechanical structure, and is relatively systematic. 3 The established life prediction methods predominantly include the S-N fatigue life theory, 4 fracture mechanics theory, 5 damage mechanics theory, 6 and the probability statistics based on the life prediction method.7,8 A new formula for estimating a full range stress life curves for medium-strength steels is proposed in. 9 The durability and cumulative fatigue damage of connection detail of a steel bridge are estimated using a full range S-N curve, which is developed by employing the proposed formula. To account for the crack opening and closure effects, as well as the stress R-ratio effect, 10 a modification of the CCS fatigue crack growth law is proposed. This law has an impressive agreement with the proposed modification of the CCS fatigue crack propagation model, taking into account the plasticity-induced crack-closure model with the boundary correction factor. Various estimation methodologies were implemented to regulate the parameters of the Weibull distribution. The experimental fatigue data is collected from multiple bridges across Europe. 11 The fatigue life of key parts of the aeromechanical structure can be predicted using fracture mechanics theory to calculate the contact stress and introducing the influence coefficient of stress intensity factor. 12 Whereas the low cycle fatigue life of notched parts can be predicted using the critical distance critical plane method. 13 The fatigue life of the boom structure of the hydraulic excavator can be predicted using the Miner criterion. 14 According to the S-N curve, using the rain flow counting method and linear cumulative damage theory,15,16 the fatigue life of offshore wind turbine supporting structure can be estimated. 17 By implementing the Liouville probability density evolution equation to solve the probability density function of fatigue crack growth size, the fatigue life, and the reliability of offshore platform tubular joints can be computed. 18 Currently, most of the structural fatigue analysis is based on the theories of fracture mechanics and damage mechanics. Through the construction of the payload process, cyclic stress is determined for fatigue life estimation.19–21 The existing life prediction models primarily include the average stress affect life prediction model, 22 the fatigue life cycle model, 23 the multi-axial fatigue life model, 24 the state-space model, 25 the high cycle fatigue model, 26 the fatigue thermal response model, 27 residual life model 28 as well as the damage parameter life prediction model. 29 These models are applied to the fatigue life analysis of mechanical equipment.
The mechanical structure demonstrates the characteristics of multi parameters, non-linear, fast time-varying, complex load, and complex operating conditions in service. The fatigue analysis and safety assessment of mechanical structures are thus loaded with great challenges, which restrict the improvement of the technical level of mechanical equipment. Modulus of elasticity is a key performance parameter of engineering materials, which will highlight a decreasing feature in the fatigue process. 30 The fatigue of materials can be estimated by analyzing the law of the decrease of elastic modulus with the number of stress cycles. 31 However, considering the complexity of working conditions and service environment of the key parts of the mechanical equipment in service, it is difficult to effectively identify the actual cyclic stress of the structure. It is thus inaccurate to use the cyclic stress method for evaluating structural fatigue. Moreover, due to the complex working environment or special structure of certain mechanical equipment, it is impossible to identify the real load history of the structure; hence the conventional fatigue calculation method based on the cyclic load cannot be used for the fatigue calculation and accurate prediction of the mechanical structure. The measurement and evaluation of the fatigue state of the mechanical structure are thus crucial from the perspective of probability and statistics. In this paper, a mechanical structure is analyzed for an experimental study. In the study, the stress, strain, and modulus of elasticity of the structure and their influencing factors are taken into consideration. Two random variables of load and strain of the test piece are statistically computed using the method of generalized load analysis, which is statistically invariant. The relationship between the statistical law of strain and the equivalent modulus of elasticity of the mechanical structure is further established. Through the investigation of degrading characteristics of the equivalent modulus of elasticity statistics, the fatigue judgment of mechanical structure is realized.
Estimation algorithm
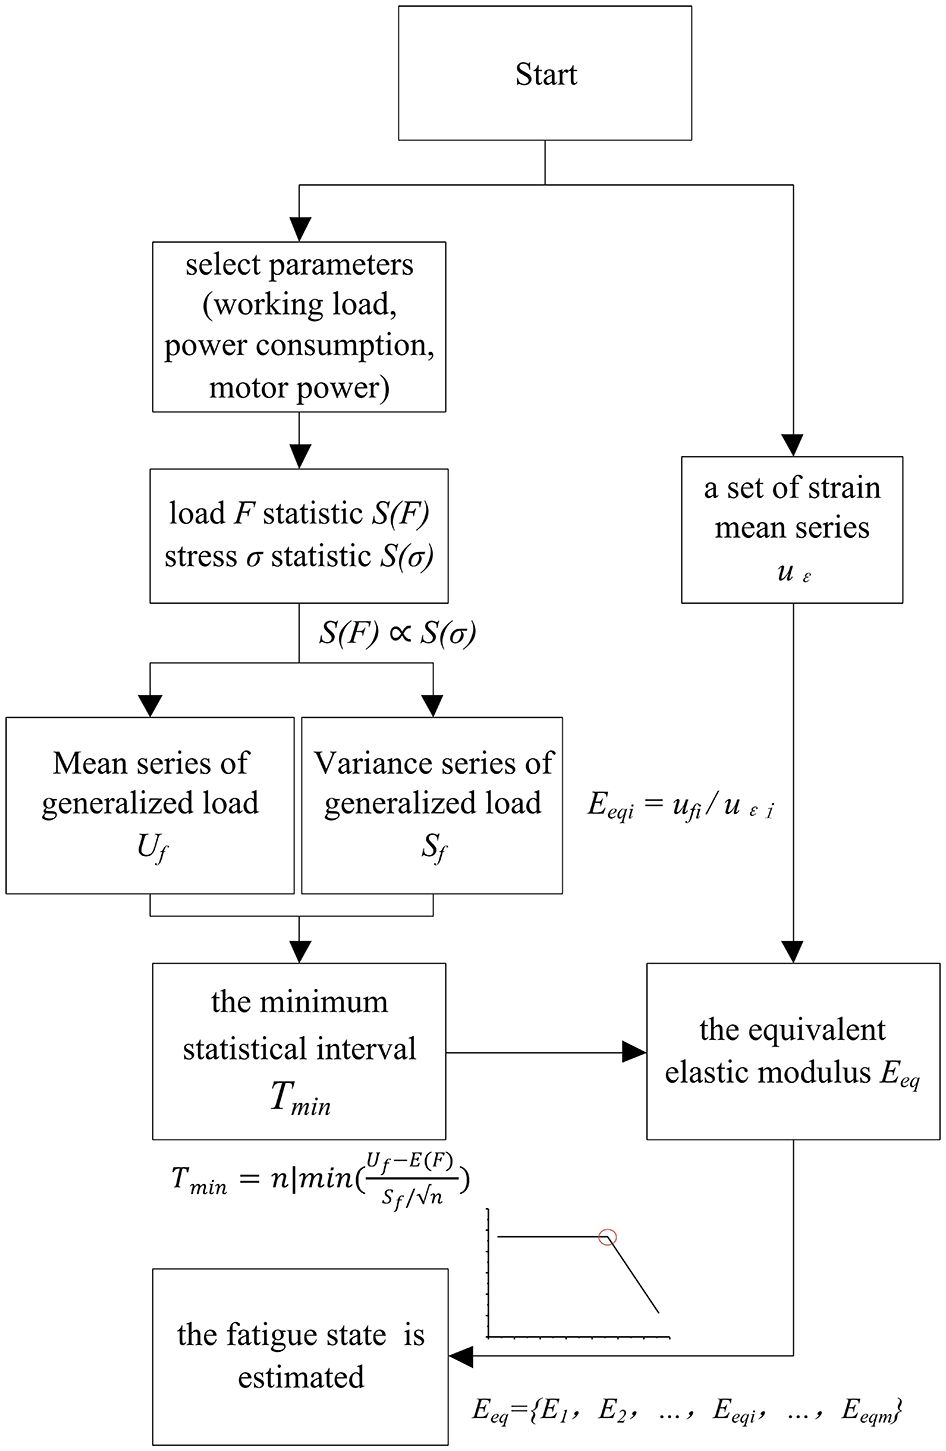
The estimation method of the fatigue state of mechanical structure in-service depends on the change of elastic modulus of the material by establishing a statistical correlation between the strain of the key parts of mechanical structure and the parameters highlighting the working state of the mechanical equipment, so as to obtain the measurement and evaluation of fatigue state of the mechanical structure in service (Figure 1).
Estimation algorithm of in-service fatigue state.
To begin with, the generalized load F with statistical significance invariable is constructed using the statistical theory. The statistic S(F) of the generalized load F is corresponding to the statistic S(σ) of the stress σ in the key parts of the mechanical structure. The measured data series of strain ε in the key parts are simultaneously computed through the actual measurement. Further, the change of elastic modulus Eeq in a statistical sense is investigated using the stress-strain relationship. Eventually, the fatigued state of the key parts of mechanical equipment structure in service is computed based on the change of Eeq. The specific computing method is as follows:
(1) Parameters like working load, power consumption, and output of motor power, which signify the working state of the mechanical structure in service, are chosen as the generalized load F with statistical significance. The statistic S(F) of the generalized load f is corresponding to the statistic S(σ) of the stress σ:

(2) The minimum statistical interval Tmin of the generalized load F is calculated so that the mean E(F) and variance D(F) of F remain unaltered. The generalized load sequence (F = {f1, f2,…, fi, …, fn}) is determined by sampling the generalized load at a certain time interval. Two new sequences Uf and Sf are constructed based on the obtained generalized load sequence. Uf and Sf are the mean and variance series of the generalized load series, respectively. Ttest and X2test are used to determine the stability of the mean and variance of the sequence Uf and Sf, respectively. Thus, the minimum value of the statistical interval I with stable mean and variance of the sequence Uf and Sf can be determined. The minimum statistical interval Tmin can be obtained as:
(3) For the measured data strain ε series of the parts corresponding to the generalized load, a set of strain mean series uε is generated using the minimum statistical interval Tmin.
(4) The equivalent elastic modulus Eeq sequence is computed, and the change of the elastic modulus is identified by the equivalent elastic modulus Eeq sequence as:


Where m = n−Tmin, ufi is the mean value of the generalized load F, and uεi is the mean value of the measured strain ε.
(5) The slope of the curve is determined based on the Eeq sequence.
(6) Based on the slope of the equivalent modulus of elasticity curve, the fatigue state of the mechanical structure is evaluated. If the slope of the equivalent modulus of elasticity curve approaches 0, the structure indicates no fatigue damage. If the slope exceeds a certain range, it signifies that the structure will have fatigue issues to deal with. The time point when the slope varies abruptly is the time when fatigue begins to appear in the key parts of the in-service mechanical equipment structure.
Experimental device
Bending fatigue damage test device of cantilever beam
A fatigue damage test device is designed and curated for the study. A small component test device is arranged, which is consistent with the material characteristics of the bearing parts of the mechanical structure. The strain of the easily damaged part or area of the key parts is hence tested. The fatigue damage of the specimen under the action of limited cyclic stress and lower than the yield limit of the material is tracked. The performance indices of the fatigue damage test device are as follows:
Alternating load on the sample: 0–50 N
Sample stroke: 0–0 mm
Excitation force loading frequency: 1–10 Hz
Counting capacity: 107
Working temperature of monitoring device: 0–55°C
Working mode of monitoring device: continuously working
Loading mode: adjustable amplitude and loading frequency
System measurement accuracy: 0.5% FS
Figure 2 demonstrates the bending fatigue damage test device with a cantilever beam. The device is made up of a cantilever beam with one fixed end, and the other end is connected with a reciprocating driving mechanism responsible for the swing of the cantilever beam specimen. The reciprocating driving mechanism is connected with the cantilever beam with the help of a connecting rod (45 steel). During the swinging, the cantilever beam is exerted by the driving mechanism. This eliminates the superposition vibration of the reciprocating driving mechanism. The equivalent elastic modulus of the mechanical structure can be obtained using strain sensors to collect the information that can help in determining the fatigue state of the mechanical structure. The fatigue situation of mechanical structure can be determined by examining the change rule of equivalent modulus of elasticity.

Bending fatigue damage test device of a cantilever beam.
Design of the connecting rod
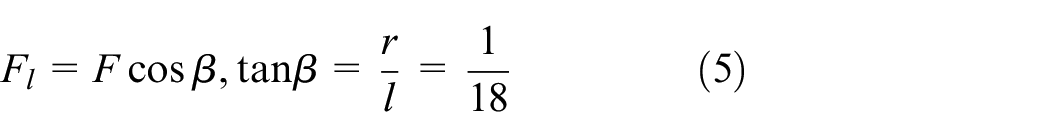
In the loading mechanism, motion and force are transmitted through the connecting rod. The connecting rod is basically a straight rod with a circular section. The radial dimension of this rod is the key to the design of the connecting rod structure. The connecting rod must be capable of withstanding continuous alternating load without breakdown. If the radial dimension is too large, the strain information on the connecting rod will not be effectively collected by the sensor. Whereas a smaller radial dimension invites the possibility of fatigue damage due to insufficient stiffness. In Figure 3, the thinner part in the middle of the connecting rod is the test section, and its radial dimension Φd is computed using the following formula. When the connecting rod is placed perpendicular to the crank, it is subjected to the maximum reaction force of the cantilever beam sample. The length of the connecting rod l = 450 mm, the crank r = 25 mm, and the axial force of the connecting rod is:

Connecting rod.
If the force on the part of the test section is the equal to that on the other parts of the whole connecting rod,

Merging the above formats,

Fatigue monitoring test system
Figure 4 demonstrates the schematic diagram of the instrumentation system for fatigue monitoring test. This test needs to measure the strain value of the cantilever beam and the stress value of the connecting rod. Temperature and strain can be determined by using the principle of the Fiber Bragg Grating (FBG) sensor. In the figure, 1# FBG, 2# FBG, and 3# FBG correspond to the measured temperature, stress, and strain, respectively. Three FBGs are respectively arranged on the frame, connecting rod, and sample. 1# FBG is basically the temperature compensation of reference grating, which is used to eliminate the influence of temperature while determining stress and strain. The instrumentation system comprises FBG, optical circulator, ASE broadband optical module, optical modulator, frequency converter, motor, turntable mechanism, 24VDC power supply, reflective paper, digital optical fiber sensor, and electronic accumulation counter. These three FBGs are connected in series and are, respectively, arranged on the frame, the connecting rod, and the sample. The sensor installation arrangement is marked in Figure 5. The stress and strain of the cantilever beam are simulated using the finite element analysis software (ANSYS). The results indicate that the maximum stress is experienced 390 mm away from the free end of the sample.

Fatigue monitoring test block diagram.

Installation arrangement of FBG sensors.
Experimental results
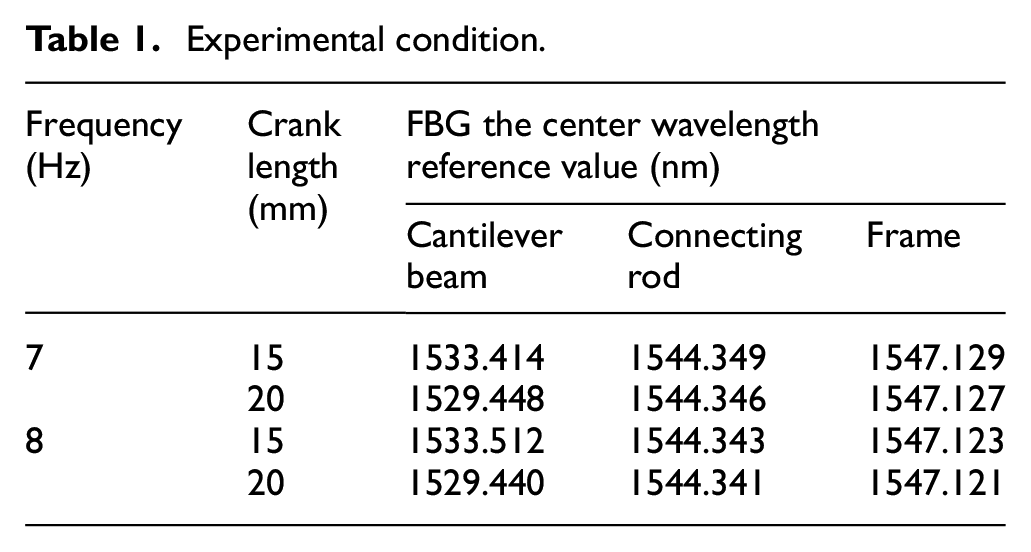
Experimental condition
The fatigue monitoring system is represented in Figure 6. For this experiment, the main factors bothering the measurement results are ambient temperature, load amplitude, and loading frequency. The experimental conditions under different crank lengths and loading frequencies are enlisted in Table 1.
Temperature: FBG sensor is sensitive to temperature, and the wavelength temperature drift is 10 pm/°C. Therefore, to eliminate the effect of temperature on the experimental results, the method adopted is to paste an FBG sensor on the rack, which is not influenced by the load. To decrease the error, the temperature compensated 1# FBG sensor is pasted on the frame with the same material as that of the sample.
Load amplitude: Under the appropriate level of stress, the material structure exhibits regular fatigue damage. If the excitation amplitude of the cantilever beam specimen under the action of connecting rod pressure (or tension) is too large, it will exceed the maximum stress limit that the specimen can bear and will eventually get destroyed. If the load is too small, the stress generated by the load will be lower than the fatigue limit of the sample material, so the sample will not be fatigue damaged regardless of the frequency of excitation. Therefore, considering this situation, the experiment is carried out under two excitation amplitudes with a crank length of 10 mm and 15 mm, respectively.
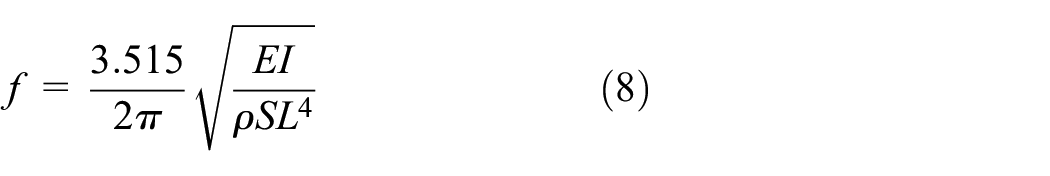
Loading frequency: The theoretical natural frequency of the cantilever beam specimen is:
Where, E is the elastic modulus of 45 steel,
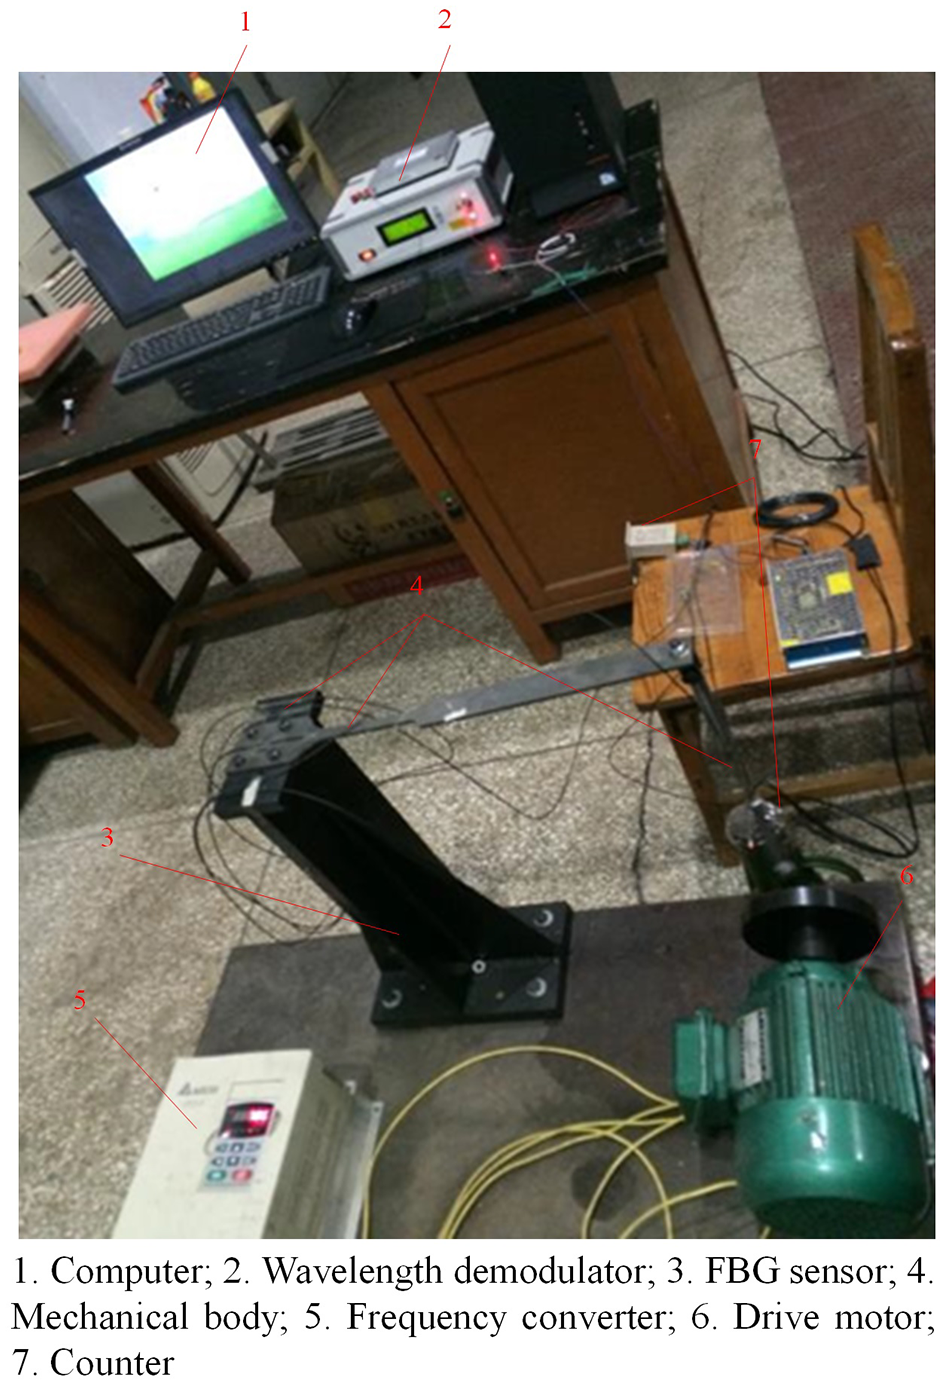
Experimental system.
Experimental condition.
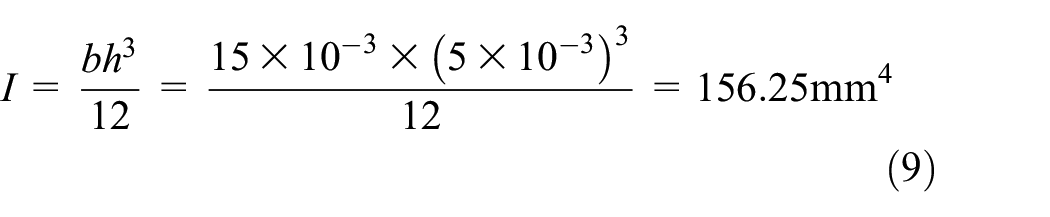
Area of the rectangular section:

Natural frequency:

To avoid resonance, the loading frequency of the load should be far away from the natural frequency of the cantilever beam sample. Moreover, since the limit frequency of the experimental device is 10 Hz, the maximum loading frequency of the load must be set to two-third of the limit frequency. To accelerate the experimental process, 7 Hz and 8 Hz within the frequency range are considered as the experimental frequencies.
Experimental process
The experimental process and data processing are as follows:
(1) Monitoring the fatigue state of the cantilever beam, collecting the frequency of motor rotation f, the number of load cycles n, the strain ε1 on the connecting rod, and the strain ε2 on the cantilever beam.
(2) At any time t, the alternating load Ft can be given as:

Where E is the elastic modulus of the connecting rod material; σ is the alternating stress; A is the area of the circular section of the test section on the connecting rod.
The load sequence {Fn} = {F1, F2,…,Ft} identified from the statistics of the alternating load on the cantilever during the entire experiment.
(3) Similarly, at any time t, the strain ε 2t of the cantilever specimen is determined, and the sequence of the strain is {ε2n}={ε21, ε22,…, ε2t}.
(4) The ratio between the alternating load sequence {Fn} and the strain sequence {ε2n} of the cantilever beam is computed. The equivalent elastic modulus sequence {Eeq} of the cantilever beam is calculated as

(5) The equivalent elastic modulus sequence {Eeq} of the cantilever beam is denoted as a curve. Based on the slope of the curve, the fatigue state of the cantilever beam can be identified.
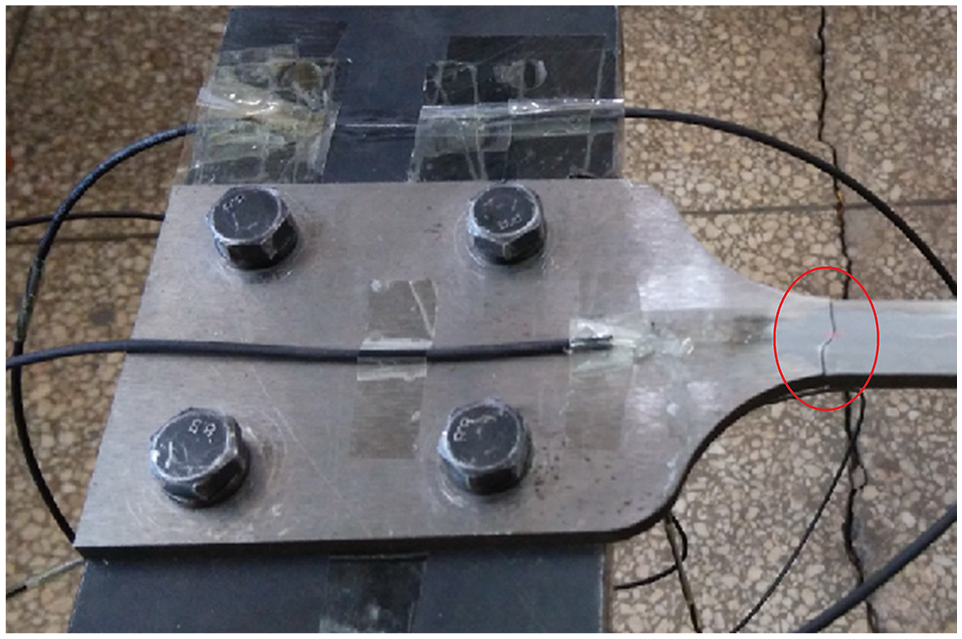
These experiments were carried out at 7 Hz and 8 Hz frequency and the crank length was 10 mm and 15 mm, respectively. The wavelength ratio sequence is calculated by taking the peak position data from each group of experimental wavelength data. The ratio sequence can be treated as the equivalent elastic modulus sequence of cantilever beam specimens. The variation in the trend of the sequence with the number of stress cycles is represented in Figure 7. Figure 8 highlights the crack generation of the cantilever specimen, and Figure 9 indicates the fracture position of the cantilever specimen. The test results suggest that the fracture positions of the samples are almost in the same position, and the consistency of the experimental device is up to the mark.

Relationship between Eeq and number of stress cycles.
Cantilever beam specimen crack.

Fracture location of cantilever beam specimen.
Analysis and judgment of fatigue state
The mean time series value of the equivalent elastic modulus is taken at the later stage of the experiment for detailed analysis. Figure 10 represents the schematic diagram of the effect of different test conditions on the change of equivalent modulus of elasticity. It can be observed from Figure 10 (a) that when the frequency value ranges from f = 7 Hz and f = 8 Hz, the amplitude values are A = 10 mm and A = 15 mm, respectively; the overall change trend of the equivalent elastic modulus is approximately the same. Moreover, for the fixed frequency, the higher the amplitude is, the faster the speed of fatigue is. The slope of the curve approaches 0 in the first 2,237,300 cycles, which suggests that the equivalent modulus of elasticity is quite stable. This stage is known as a linear stage, in which fatigue damage does not occur. Nevertheless, the slope of the two curves witnessed a downward trend, suggesting that the structure began to undergo some fatigue damage. After the occurrence of fatigue, the structural members are not directly fractured, but fatigue damage accumulation occurs. After about 6 min, when the equivalent modulus of elasticity is approaching 0, all the recorded data disappears, which indicates the structure breaks.

The decreasing process of equivalent modulus of elasticity: (a) Frequency is 7 Hz and (b) amplitude is 10 mm.
Figure 10(b) highlights the change of equivalent elastic modulus of the test piece when the amplitude is 10 mm, and the frequency is f = 7 Hz and f = 8 Hz, respectively. It can be analyzed from Figure 10(b) that the equivalent modulus of elasticity has the same change trend as that in Figure 10(a). In the initial 2,236,400 cycles, the slope of the curve approaches 0, but the latter two curves display a downward trend. For the fixed amplitude, the larger the frequency is, the faster the change trend of the equivalent elastic modulus is.
Conclusion
In engineering practice, almost all the mechanical structures work under the action of dynamic load. Some weak parts of materials will observe the initiation of cracks due to the long-term effect of this continuous alternating load. These cracks continue to expand and deepen, which eventually results in the fatigue failure of the whole structure. The methodology proposed in this paper is quite coherent and can be effectively used in all the places where mechanical structures are used. It can successfully prevent and monitor the occurrence of mechanical equipment fatigue accidents. In this paper, a statistical analysis is carried out for the fatigue state of the load-bearing parts of mechanical structures, and the variation rules of the test data of stress, strain, and equivalent modulus of elasticity are introduced.
This paper primarily focuses on the following aspects: the load and amplitude are analyzed statistically, and the fatigue test stress can also be measured. However, it is crucial to further examine the influence of various factors on the fatigue state of mechanical structures. Hence, further study needs to be done on statistical fatigue assessment methods.
Footnotes
Handling Editor: James Baldwin
Declaration of conflicting interests
The author(s) declared no potential conflicts of interest with respect to the research, authorship, and/or publication of this article.
Funding
The author(s) disclosed receipt of the following financial support for the research, authorship, and/or publication of this article: This work is supported by the National Key R&D Program of China (No. 2018YFB2000501), the Science & Technology Major Program of Henan Province of China (No. 202102210263), the Key Science and Research Program in University of Henan Province (21A460014), and the authors also acknowledge funding from Key Technology of High Speed Supercritical CO2 Turbine Henan Centre for Outstanding Overseas Scientists (GZS2018005).