
Abstract
Energy management strategy is developed by considering the random and air conditioning load fluctuation, which greatly affected the torque control of the electric motor in electric vehicle. Firstly, the vehicle power consumption model is established, based on the influencing factors of electric vehicle energy consumption: random load and air conditioning load. Therefore, driving conditions with random characteristics representing the actual random load are constructed. According to the clustered characteristic parameters, the driving conditions were classified as different driving modes. Secondly, the mode of predicted condition was taken as a variable to evaluate the logic threshold strategy and fuzzy control strategy in which the influence of air conditioning was considered. Finally, under the condition of New European Driving Cycle (NEDC), the proposed management strategy was simulated in software environment, and the hardware in-loop (HIL) test was performed to verify the strategy. The simulation and HIL test results show that the proposed energy management strategy can increase the driving range by considering the load fluctuation of air conditioning. Furthermore, the strategy combining the driving mode prediction can alleviate the decline rate of SOC. And the fuzzy control strategy has better adaptability in complex conditions and lower battery energy consumption rate.
Keywords
Introduction
Nowadays, with the advantages of pollution-free, low noise, high energy efficiency, and diversified energy sources, battery electric vehicle have become an effective way to alleviate current energy crisis and environmental pollution problems. 1 In the era of rapid development of electric vehicles, on the one hand, many scholars have conducted a series of researches on the intelligence of electric vehicles to improve the driving experience of electric vehicles 2 ; on the other hand, many experts have conducted researches on batteries and energy management strategies that affect the power performance and economy of batteries. 3 Therefore, the development of electric vehicles tends to intelligence, economy, safety, and other aspects. 4 However, Due to the restriction of battery energy density, the driving range of battery electric vehicle is limited, which seriously affects the development of electric vehicle.
In addition to improving the energy density of the battery, it is particularly essential to develop effective energy management strategies for the powertrain to improve the energy utilization rate of electric vehicles. 3 Based on previous researches, energy management strategies for electric vehicle can be mainly classified into two main parts: Rule based strategies and Optimization strategies. 5 The Rule-based strategies are real-time strategies with advantages of simplicity, reliability, and natural adaptability to online applications. Optimization-based strategies are used to minimize the energy consumption through calculating the optimal reference torques. 6 There are global optimization and real-time optimization solutions, but the calculation is complex and cannot be applied to real-time energy management.7,8
The fuzzy control strategy is an intelligent control method that is based on human experience, it can effectively solve some nonlinear problems due to its strong ability to adapt to complex and changing road conditions. Therefore, fuzzy control strategy is particularly suitable for electric vehicle energy management. Attempts have been made by many researchers for developing fuzzy control strategy for electric vehicles. 9 Ming et al. 10 proposed an energy management strategy based on fuzzy control, in which the demand torque and battery SOC were taken as input parameters of the fuzzy controller and the fuzzy rules for the actual engine torque were established. The simulation results show that the fuzzy control strategy can achieve a smoother control effect, alleviate the decline rate of battery SoC, and significantly reduce fuel consumption. Wu et al. 11 took in the influence of the randomness of operating conditions on the energy management strategy, controlled the torque of the engine and motor through the fuzzy torque distribution controller, and proposed a fuzzy control strategy based on cycle driving condition identification.
The driving condition, driver intentions, road information, and strategy are all important factors affecting the efficiency of energy management. Therefore, domestic and foreign researchers regard the above points as research emphases. Through the combination of driver intentions, the driving condition, road information, and optimized energy management strategy, they have improved the energy utilization of electric vehicles and achieved substantial results. Murphey et al. 12 adopted the neural network method for condition identification, and used the dynamic programming method to determine the optimal energy distribution rules for each representative condition, and finally realized the online application of dynamic programming algorithm combined with the condition identification strategy. Zhang and Xiong 13 divided typical driving cycles into different driving modes by using a fuzzy controller, identified the real-time driving modes, and used dynamic programming algorithm to optimize the control of different driving blocks, thus realizing adaptive energy management of real-time driving cycles.
Many open literatures show that the fuzzy control strategy is suitable for the energy management system of pure electric vehicles. At the same time, many scholars proposed energy management strategies based on driving conditions to reduce energy consumption, but they all studied typical urban cycling conditions without considering the influence of air conditioning load on vehicle performance. Therefore, this study considers the influence of air conditioning system disturbance on the vehicle performance. Also, the states of the motor drive system and electric air conditioning system are obtained and adjusted in real time to realize the energy manage of electric vehicles. Meanwhile, the complex combined driving conditions are classified and predicted to reflect the impact of random disturbance. Furthermore, the logic threshold strategy and fuzzy control strategy are studied, fuzzy energy management strategy considering random and air-conditioning load disturbances is proposed.
The rest of this article is arranged as follows. Construction of load conditions model is given in Section 2. Section 3 analyzes energy management strategies under random and air-conditioning load disturbances. Section 4 is the simulation of energy management strategy and HIL test and verification. The main conclusions are given in section 5.
Construction of load model
Load and energy consumption model
The power consumption of electric vehicles mainly includes driving resistance consumption and accessory consumption, which overcomes vehicle driving resistance is related to driving conditions. Power consumption of vehicle accessories mainly considers the impact of air conditioning system load on vehicle performance. 14 The mathematical model of the vehicle driving resistance power consumption is shown in (1).

where, P is the power loss by driving resistance during vehicle driving, v is the speed,
As the main energy-consumption accessory of electric vehicles, the use of air conditioners has a greater impact on the energy consumption rate of the whole vehicle. Therefore, this paper uses the power and operating time of the air conditioner as parameters to estimate the driving range of the electric vehicle, and explores the impact of air conditioning on the prediction of the vehicle driving range and the energy consumption rate. Assume that the average energy consumption is calculated with 5 km as a cycle iteration. When the air conditioner is turned on, the data is initialized to
(a) If the vehicle distance is less than 1 km when the air conditioner is on, the energy consumption within 5 km is defined as:

where,
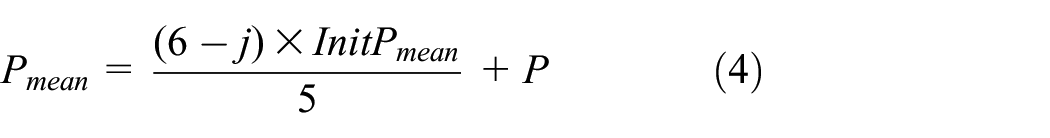
The average energy consumption and average power are shown in (3) and (4) respectively.

Combined with the above formula, the predicted vehicle mileage can be obtained:

where,
(b) If the vehicle distance is between 1 and 5 km when the air conditioner is on, the energy consumption within 5 km is defined as:


where,
(c) If the vehicle distance is more than 5 km when the air conditioner is turned on, the energy consumption is defined as:


In this state, the predicted driving distance is still calculated by (5).
Based on the real-time energy consumption

Condition recognition
Construction of combined condition
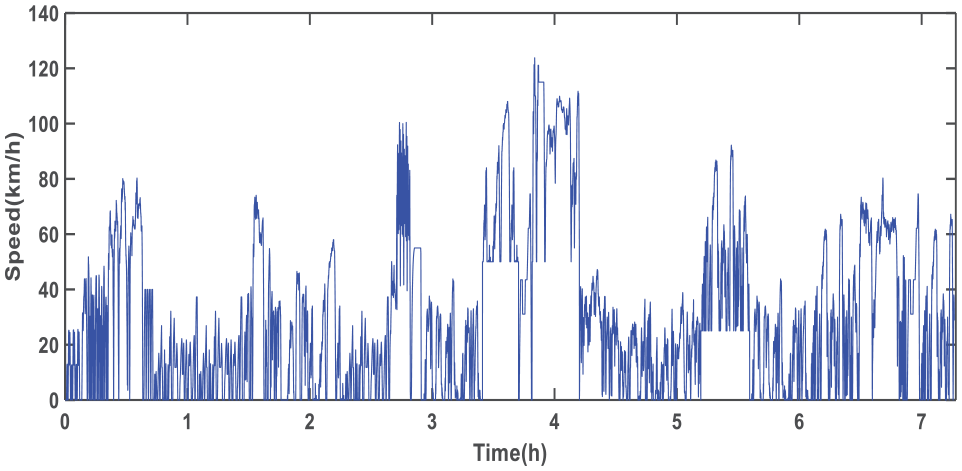
The construction of combined driving conditions is the basis for the identification of vehicle driving condition. Generally, the construction of combined working conditions should take into account most of the situations that will be encountered during actual driving such as high speed, low speed, long wait, rapid acceleration, and rapid deceleration, so that the actual driving condition of the vehicle can be more comprehensively described. Based on the ADVISOR 2002 software, this paper constructs the combined operating conditions, taking 35 driving conditions commonly used in the simulation of electric vehicles as representative typical conditions, which can represent different regions and traffic conditions of each country. As shown in Table 1, based on the typical driving conditions with characteristics of different driving conditions, the combined operating conditions constructed can better represent the actual driving conditions than single driving conditions. The change in vehicle speed over a period of time is called a driving condition segment, and the length of the segment will have a certain effect on the clustering effect of the combined driving condition, and influencing the result of the condition identification. Shen et al. 15 shows that the sampling time range of the driving condition segment is more reasonable between 50 s and 100 s. Therefore, the driving condition segment is divided with 60 s as a cycle, and the 35 typical combined driving condition diagrams are constructed as Figure 1.
Common used electric vehicle simulation driving cycles.

Combination driving condition of 35 typical conditions.
Cluster analysis of vehicle driving condition segments
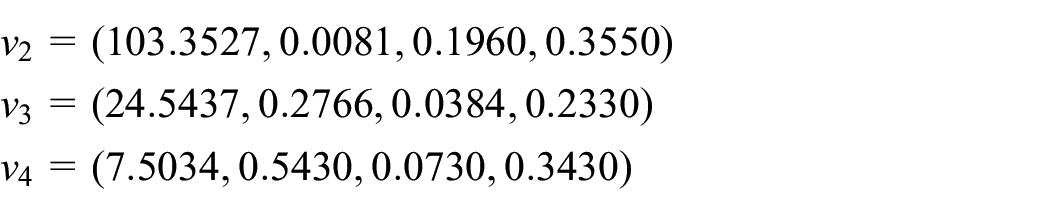
The characteristics of the historical data of the conditions experienced by the vehicle are represented by the characteristic parameters of the driving condition, and the validity of the driving condition identification results are also easily affected. Relevant research shows that the characteristic parameters related to the driving state of the vehicle usually include: distance, average speed, maximum speed, standard deviation of vehicle speed, average acceleration, average deceleration, maximum acceleration, maximum deceleration, standard deviation of acceleration, parking ratio, acceleration time ratio, deceleration time ratio, etc. 16 The correlation between the above characteristic parameters and the driving state of the vehicle is different, many scholars 16 have concluded that the average driving speed, the deceleration ratio, stopping ratio, and uniform speed ratio of automobiles can reflect the characteristics of driving conditions well. Therefore, this paper chooses the above four parameters as the characteristic parameters for driving condition recognition, and uses the semi-supervised kernel fuzzy c-means clustering algorithm is used select the number of clusters as 4, which are relatively obvious. 17 The clustering results and clustering center coordinates are shown in Figure 2. The coordinate of cluster center 2 is (103.3527, 0.0081). In such conditions, the parking rate is small and the speed is relatively high, indicating the smooth highway; the cluster center has 4 coordinates (7.5034, 0.5430). Such a working condition has a large proportion of parking, and the vehicle speed is relatively small, indicating the city center. The coordinates of category 1 and category 3 are between the above two, respectively representing the working conditions of urban suburbs and urban residential areas. Analyze the clustering center of each condition, and the final result is as follows:


Clustering simulation result of 223 fragment.
The 35 typical combined driving conditions constructed in this paper are identified, and the simulation results are shown in Figure 3. Here 1 represents the working condition of urban suburb; 2 represents highway condition; 3 represents urban residential conditions; 4 represents the working condition of urban center.

Simulation results of driving condition identification.
Driving condition prediction based on Markov theory
Driving condition prediction refers to the prediction of possible future driving conditions based on current and historical driving conditions data, and accurately predicting driving conditions can improve driving range and power battery energy consumption rate. As mentioned above, vehicle driving conditions have been divided into four categories, and the state transition between different types of driving conditions can be deduced from recent data and not related to historical data. Therefore, it can be seen that this process is Markovian. The flow chart of vehicle future driving condition prediction is shown in Figure 4:

Predict flow chart of Markov model.
Where set
Based on the results of driving condition identification, it is assumed that 60 driving condition segment data are used as the raw data predicted by Markov, and it is assumed that eight pieces of new data can be predicted for every 60-piece data. When the driving condition of the first test data is determined, the state transition probability matrix can be used to predict the future driving condition of the vehicle. Then the real-time prediction of vehicle driving condition segment is completed. The prediction result of driving condition obtained by Markov algorithm is shown in Figure 5 in which the red circle represents the original data obtained by the vehicle driving condition identification algorithm, and the blue triangle represents the data predicted by Markov algorithm. It can be seen from Figure 5 that the driving condition prediction result obtained by Markov algorithm can basically cover the actual driving conditions of vehicles. After the prediction of future driving conditions, different energy management rules can be formulated according to different driving conditions, thereby improving the driving rage and reducing the energy consumption.

Prediction result of Markov model.
Research on energy management strategy based on random and air conditioning load disturbance
Logic threshold strategy based on random and air conditioning load disturbance
The rule-based logic threshold energy management strategy divides different working states by determining control variables and variable thresholds. 18 In this paper, the categories of driving condition and the SOC value of the power battery are selected as control variables to determine the working state of the motor and the opening and closing of the air conditioner. According to the prediction of driving conditions, four driving conditions, such as urban center, urban residential area, urban suburb, and expressway, are obtained, based on this different category, the battery SOC of 0.3 and 0.7 as the threshold value. The main switching modes of logical threshold energy management strategy based on condition prediction are as follows:
(a) Highway condition
If 0 ≤ SOC ≤ 0.3, then
If 0.3 ≤ SOC ≤ 0.7 and
If 0.3 ≤ SOC ≤ 0.7 and
If 0.7 ≤ SOC ≤ 1, then
(b) Urban suburban condition
If 0 ≤ SOC ≤ 0.3, then
If 0.3 ≤ SOC ≤1 , then
(c) Urban center or residential condition
If 0 ≤ SOC ≤ 0.3, then
If 0.3 ≤ SOC ≤ 1, then
Thus, the switching conditions are mainly determined according to the SOC value of power battery and the categories of driving condition.
The simulation results of the logic threshold based on the prediction of the condition under NEDC are shown in Figure 6.

Simulation results of logic threshold strategy based on driving prediction under NEDC: (a) battery SOC under different conditions and (b) battery voltage under different conditions.
The comparison curves of SOC and voltage changes of the logical threshold strategy with operating condition prediction and the cycle condition are shown in Figure 6(a) and (b) respectively. As can be seen from Figure 6(a), the SOC decline of the battery with the strategy of condition prediction is slower, indicating that the strategy with condition prediction has better control effect. Figure 6(b) shows that the battery terminal voltage drops slowly as the vehicle travels, and the battery voltage with the strategy of working condition prediction drops more slowly and has better stability.
Fuzzy control strategy based on random and air conditioning load disturbance
This paper introduces the power distribution coefficient k to represent a weight of the maximum power allocated to the air-conditioning system, and the changes in the battery SOC and pedal opening and the temperature difference between the battery temperature and its optimal operating temperature at any time will affect the power distribution coefficient. 16 Based on this, the power distribution coefficient fuzzy controller is analyzed.
In addition, the motor is also an important factor affecting the effectiveness of energy management strategies for electric vehicles. In order to control the output torque of the motor and achieve the goal of minimizing the energy consumption of electric vehicles, we must first consider the factors that affect the output torque of the motor. On the one hand, the output torque of the motor is affected by the pedal opening and the power battery SOC; on the other hand, the actual driving conditions of the vehicle will also affect the motor output torque. The four types of operating conditions predicted are used as the input parameters of the fuzzy controller of the motor output torque. Based on this, the motor output torque fuzzy controller is analyzed in detail.
In conclusion, the flow chart of fuzzy control energy management strategy based on the condition prediction is shown in Figure 7.

Flow chart of fuzzy control strategy based on driving condition prediction.
Power distribution coefficient control
Pure electric vehicle energy management strategy is mainly to consider how the power allocation of power battery

where,
The fuzzy controller with power distribution coefficient is designed, with pedal opening θ, power battery SOC and temperature range
In this paper, triangular membership function is adopted to set the discussion domain of the pedal opening of the input parameter as T, the corresponding fuzzy subsets are NB (negative large), NS (negative small), Z (zero), PS (positive small), PB (positive large). The field of setting the input parameter power battery SOC is Y, the corresponding fuzzy subsets are VL (very low), L (low), M (middle), and H (high). Regarding the input parameter temperature range
Motor output torque control
When the power distribution coefficient is determined, the power allocated to the drive system is also determined on the premise that the power provided by the power battery can be distributed and adjusted. The motor torque is responsive in real time, so it is necessary to control the output torque of the motor. Combined with the fuzzy control algorithm, the motor output torque control strategy based on condition prediction is proposed, and the fuzzy controller of motor output torque is designed with pedal opening θ, power battery SOC and vehicle future driving conditions S as input parameters, and motor output torque
In this paper, triangular membership function is adopted to set the domain of the pedal opening of the input parameter as P, the corresponding fuzzy subsets are NB (negative large), NS (negative small), Z (zero), PS (positive small), and PB (positive large). For the future driving conditions of vehicles with input parameters, the field is set as R, and the corresponding fuzzy subsets are ON (category 1), TW (category 2), TH (category 3), and FO (category 4). The field of setting the input parameter of power battery SOC is I, the corresponding fuzzy subsets are S (low), M (middle), and L (high). The output torque of the motor
Simulation and test
Simulation
In order to verify the effectiveness of the fuzzy control strategy based on condition prediction proposed in this paper, the simulation test was carried out under typical conditions of NEDC in Europe, and the simulation was compared with the logic threshold strategy based on condition prediction. the initial SOC of the battery is set to 0.99 under NEDC conditions. When the simulation reaches the battery SOC of 0.05, the simulation ends and the simulation step is set to 0.01 s. And one of the cycle conditions is selected for specific analysis of the simulation results.
Hardware in-loop test
The hardware in-loop simulation test system simulates the running state of the controlled object with the real-time processor running simulation model, it is connected to the ECU through the I/O interface to perform the test on the ECU Comprehensive and systematic testing. Considering safety, feasibility, and reasonable cost, hardware-in-the-loop simulation testing has become an important part of the ECU development process, reducing the number of road tests, development time, and costs while improving ECU software quality. Although the real-time dynamic response capabilities of the signal input and output are different from the real-vehicle application and offline simulation, the simulation results are partially different, but the test is closer to the actual situation and is still used to verify the effectiveness of the strategy.
In order to verify the effectiveness and feasibility of the proposed fuzzy control strategy based on condition prediction, the hardware of the fuzzy control strategy based on condition prediction is tested in real time. In order to verify the fuzzy control strategy based on condition prediction of electric vehicles, the overall structure of the HIL test platform system built is shown in Figure 8.
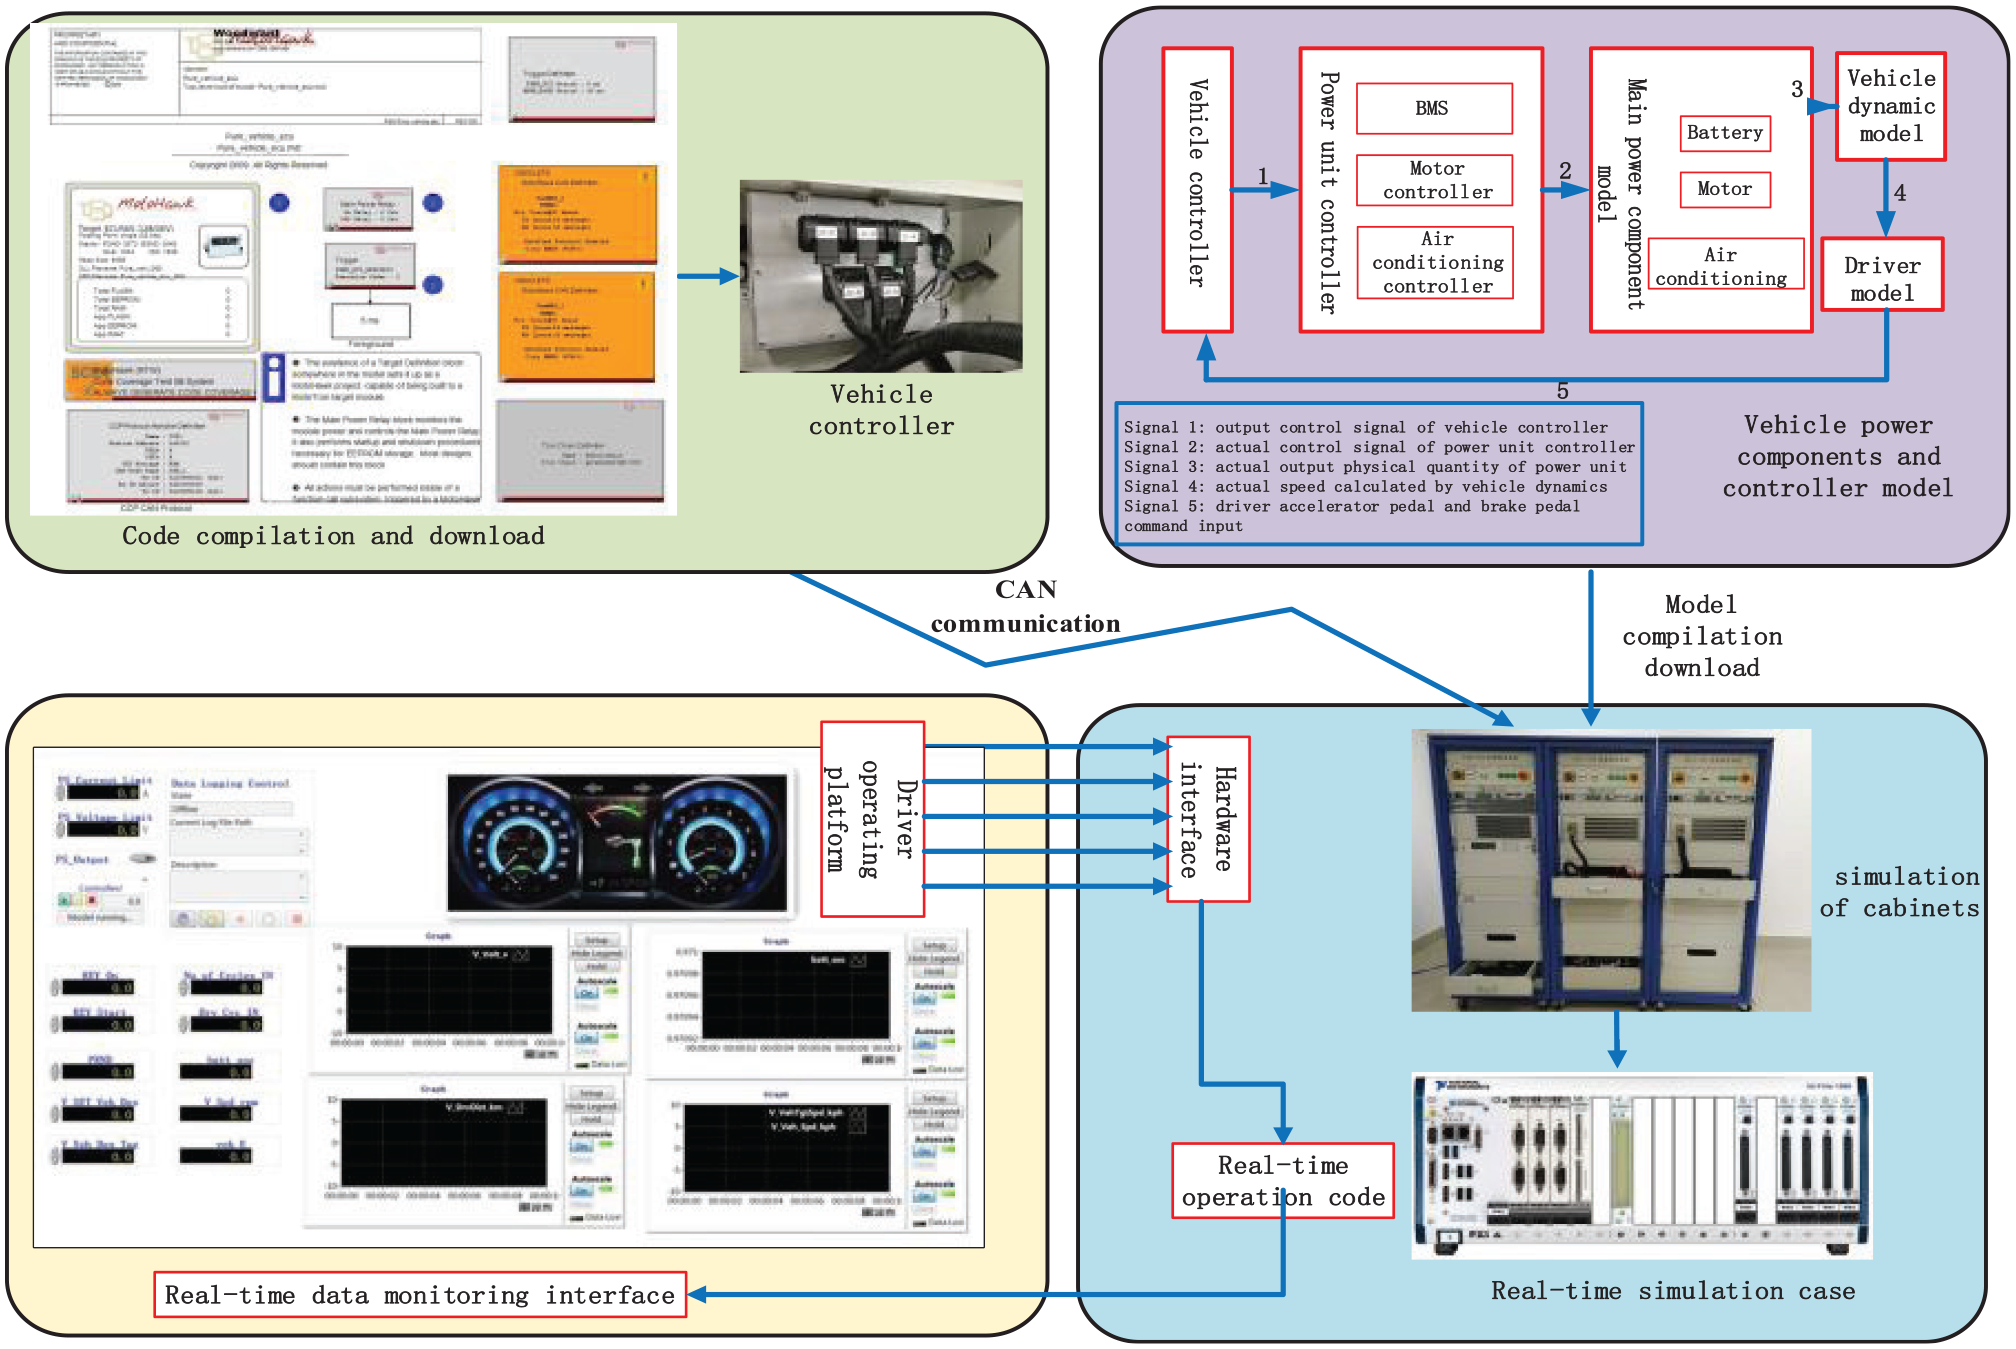
Architecture of HIL test platform system.
Results and discussion
Discussion of simulation
The simulation results of the NEDC operating conditions are shown in Figure 9. From Figure 9(a), the battery SOC decreases continuously during the driving process of the vehicle, and the battery SOC of the fuzzy control strategy of the battery decreases more slowly. It can be seen from the Figure 9(b) that the initial voltage of the battery is maintained at about 163.5 V, which is basically consistent with the actual parameters of a pure electric vehicle power battery selected in this paper, indicating the accuracy of the simulation model. And he battery terminal voltage is slightly decreased with the driving of the vehicle, but the falling amplitude is not large. That is to say, the fuzzy control strategy based on the condition prediction proposed in this paper can effectively avoid the battery voltage to be greatly reduced, and the voltage stability of the battery system is better. According to Figure 9(c), it can be concluded that under the fuzzy control strategy based on condition prediction, the charging and discharging current of the battery system has been significantly reduced, and the damage of the large current to the power battery is effectively reduced. Figure 9(d) shows that the driving range of the fuzzy control strategy based on operating condition prediction is always higher than that of the logical threshold strategy. As shown in Figure 9(e), when the air conditioner is turned on, the predicted driving range will decrease to a certain extent, otherwise the driving range will increase, and the output power of the air conditioner will change accordingly as the vehicle speed increases. The output power will decrease accordingly, and conversely, the power of the air conditioner will rise again, indicating that the real-time response of the air conditioning model established in this paper is better.

Simulation results under NEDC condition: (a) battery SOC under different strategies, (b) battery current of different strategies, (c) battery voltage of different strategies, (d) driving distance under different strategies, and (e) influence of air switching on driving mileage prediction.
Discussion of HIL test
The test results of hardware in the loop under NEDC condition are shown in Figures 10 and 11. It can be seen from Figure 11 that the tracking effect is good when the vehicle speed is low, and the target vehicle speed cannot be tracked in real time at a higher vehicle speed. This is mainly because the maximum vehicle speed parameter of the selected model can only reach 103 km/h, and it can be seen from the partial enlargement diagram that compared with the off-line simulation, the HIL test vehicle speed tracking will have hysteresis and error, mainly because the actual HIL test process. There are time delays and precision errors in the transmission of signals. Figure 11(a) shows that the offline simulation and the HIL test battery SOC curve basically match. Figure 11(b) and (c) show that the changes in battery voltage and driving range of the HIL test and simulation are still basically identical. As shown in Figure 11(d), the predicted driving mileage decreases significantly after the air conditioner is turned on, and the air conditioning power decreases (increases) as the vehicle speed increases (decreases), and the predicted driving mileage rises to some extent after the air conditioner is turned off. By comparing HIL test and simulation results, the effectiveness of the proposed fuzzy control strategy based on condition prediction is further verified.

Vehicle tracking based on NEDC.

NEDC operating hardware in loop test results: (a) battery SOC under different simulation environments, (b) battery voltage under different simulation environments, (c) mileage comparison under different simulation environments, and (d) experimental verification of the influence of air conditioning on driving distance prediction.
Result
Table 2 shows the comprehensive control results obtained from the logic threshold strategy and the fuzzy control strategy based on the driving condition prediction. Comparing the driving range and battery energy consumption rate in NEDC conditions in Table 2, it can be concluded that the driving range using the fuzzy control strategy based on the operating condition prediction has been greatly improved, and the battery energy consumption rate has a certain degree.
Integrated control results for logic threshold strategy and fuzzy control strategy with driving prediction.

As can be seen from the table, compared with the logic threshold strategy based on the working condition prediction, the fuzzy control energy management strategy has better control effect when considering the air conditioning disturbance and random load, and the battery energy consumption rate is reduced by 8.14% under the condition of NEDC driving. Mileage increased by 8.759%. In addition, when the air conditioner is turned on, its power is 1500 W, and its driving distance immediately decreases by 9.09%. After the air conditioner is turned off, driving distance increases to some extent. In summary, after comparing the two strategies, the fuzzy control strategy based on the condition prediction has better control effect and greater application value.
The battery energy consumption rate of the HIL test and simulation under the NEDC operating condition is shown in Table 3. From the table, the energy consumption rate of the HIL test is roughly the same as the offline simulation result. The results show that the proposed fuzzy control strategy based on driving condition prediction can effectively implement electric vehicle energy management and improve electric vehicle energy utilization.
Battery energy consumption rate for HIL test and offline simulation.

Conclusions
This paper studies the energy management strategies under random and air-conditioning load disturbances from the aspects of theoretical analysis, simulation, and experiments. Firstly, the energy consumption model considering the air conditioning load and the combined working condition considering the random disturbance are constructed, and the types of the driving conditions are predicted based on Markov theory. The prediction results show that the predicted results basically cover the actual driving conditions; Then, the influence of random load and air conditioning on and off on vehicle energy management strategy is explored by setting the predicted driving conditions as input variables, and the logic threshold strategy and fuzzy control strategy are analyzed. Finally, the simulation results show that: under random load disturbances, the battery SOC with the driving condition prediction strategy decreases more slowly and the voltage stability is better. Therefore, considering the condition prediction in the energy management strategy can give better play to the energy saving potential of electric vehicles; meanwhile, energy management considering air-conditioning load can increase vehicle driving mileage. Compared with the logic threshold strategy, the driving mileage with the fuzzy control strategy is greatly improved, and the battery energy consumption rate has been reduced to a certain extent, and the optimization effect has increased by 8.14%. In order to verify the correctness of the simulation, a HIL test system platform was built, and the hardware-in-the-loop real-time verification with the fuzzy control strategy considering random and air-conditioning load disturbances was completed. The HIL test results are basically consistent with simulation results, which indicates that the proposed strategy can effectively implement electric vehicle energy management and improve electric vehicle energy utilization.
Footnotes
Handling Editor: James Baldwin
Declaration of conflicting interests
The author(s) declared no potential conflicts of interest with respect to the research, authorship, and/or publication of this article.
Funding
The author(s) disclosed receipt of the following financial support for the research, authorship, and/or publication of this article: This research was funded by the National Natural Science Foundation of China, grant number [51105178, 51977100], and funded by the Natural Science Foundation of Jiangsu Province, grant number [BK20171300].