
Abstract
Shell vibration signals generated during grinding have useful information related to ball mill load, while usually contaminated by noises. It is a challenge to recognize load parameters with these signals. In this paper, a novel approach is proposed based on the improved empirical wavelet transform (EWT), refined composite multi-scale dispersion entropy (RCMDE) and fireworks algorithm (FWA) optimized SVM. Firstly, vibration signals are denoised by improved EWT, which uses cubic spline interpolation to calculate envelope spectrum for segmentation. Then, RCMDEs of the denoised signals are calculated as feature vectors. The vectors’ dimensionalities are reduced by principal component analysis (PCA). Finally, a mill load prediction model is established based on the FWA optimized SVM. The reduced feature vectors are fed to the model, thus material-to-ball ratio and filling rate being outputs. Grinding experiments show that the extracted features by RCMDE can effectively distinguish three load states. Meanwhile, experiments also show that FWA reduces the forecasting errors of material-to-balls ratio and filling rate by 1.9% and 2.9% compared with genetic algorithm (GA), as well as by 1.92% and 4.21% compared with particle swarm optimization (PSO) algorithm. It demonstrates that the proposed approach for ball mill load forecasting has high accuracy and stability.
Keywords
Highlights
An improved empirical wavelet transform (EWT) denoising algorithm is proposed.
A refined composite multi-scale dispersion entropy (RCMDE) is proposed to extract the vibration features.
A fireworks algorithm (FWA) is proposed to optimize support vector machine (SVM).
The optimized SVM is applied to forecast the ball mill load with the extracted features.
Comprehensive experiments are designed to evaluate the effectiveness of the proposed methods.
Introduction
Ball mill is the key equipment of mineral production process, while its disadvantages include low working efficiency and high energy consumption, which influence the optimization control and energy saving of mineral processing enterprises. 1 The work efficiency is highest while the ball mill load is in the best state. However, the ball mill load is difficult to measure directly. Therefore, the accurate recognition of ball mill load has become the focus of researchers.
In the grinding process, the vibration signal generated by ball mill contains useful information related to internal load parameters, which can be used to determine mill load parameters indirectly.2,3 However, due to the large amount of noises contained in the acquired vibration signals and their characteristics of non-linear and non-stationary, it is a challenge to remove the noises, extract the latent features, and construct an recognition model to forecast mill load parameters based on these signals. Many traditional and improved denoising algorithms, feature extraction algorithms and pattern recognition algorithms have been used in ball mill vibration signal processing and load recognition,4–7 but the processing effect and recognition accuracy still need further research.
In processing nonlinear signals, the empirical mode decomposition (EMD) and wavelet transform (WT) have certain advantages,8–10 but there are also problems such as mode mixing and inappropriate selection of wavelet basis function. Chen et al. 11 used a wavelet packet to decompose the vibration signal of the rolling bearing into several sub-signals containing fault information. The wavelet packet transform is an extension of the WT that can select an arbitrary frequency resolution, which makes it relatively flexible. In 2013, Gills presented a new method called empirical wavelet transform. 12 Its essence is to generate adaptive wavelets for extracting feature information from the original signals. In recent studies, the EWT decomposition technique has been applied in various fields. Chegini et al. 13 proposed a new vibration signal denoising method based on the EWT for rolling bearings fault diagnose. The results show that the EWT-based denoising method is superior to the EMD denoising technique. In, Liu et al. 14 EWT is used to decompose the original data for the wind speed forecasting. Singh and Sunkaria 15 presented a novel method for removing the power-line interference and refining the baseline wander in electrocardiogram signal utilizing the EWT method. Li et al. 16 proposed a novel technique for down-hole micro-seismic denoising using the EWT method and an adaptive threshold. Their results show that the performance of the EWT denoising method is better than the WT, the complete ensemble EMD and synchrosqueezed WT. However, there are some problems in the EWT, such as inaccurate spectrum segmentation, which leads to an inaccurate decomposition effect. Overall, further optimization is needed.
In terms of feature extraction, nonlinear dynamics methods are favored.17–20 Zhang and Shang 21 used single-scale permutation entropy and four-scale permutation entropy indicators to detect milling flutter online. Experiments demonstrate that this method can accurately and effectively identify milling flutter. And the characteristic entropy is insensitive to noises and parameter changes, which has good practicality. Mehta et al. 22 investigated the time series complexity of the motor vibration signals. He applied the multi-scale fuzzy entropy (MFE) to fault detection of rolling bearings. Results show that this method is better than SVM. Besides, Cai et al. 23 used adaptive frequency windows EWT-MFE and adaptive evolution particle swarm optimization probabilistic neural network (AEPSO_PNN) to identify and classify the load status of ball mills. The results showed that the MFE features can better distinguish three different operating conditions, and the AEPSO_PNN method has higher recognition accuracy compared with PNN and BP neural network. Among the above methods, MFE has certain advantages in the field of feature extraction. It can effectively solve the entropy catastrophe problem of multi-scale entropy (MSE) and has a good diagnosis effect. However, MFE tends to ignore the interrelationship of various time series during signal processing. In order to overcome the above shortcomings, Rostaghi and Azami 24 reported a new irregularity index named dispersion entropy (DE). This fast algorithm considers the relationship between the signal amplitudes. And it is less affected by a sudden change signal. In addition, Azami et al. 25 proposed the concept of RCMDE on this basis, and compared with other MSE algorithms, the results showed that RCMDE has unique advantages in feature extraction. Conzhi et al. 26 proposed a new method for rolling bearing fault diagnosis based on RCMDE and support vector machine (SVM). Experiments show that, RCMDE has higher fault recognition rate compared with the multi-scale dispersion entropy and MSE.
The forecasting accuracy is the top priority in the proposed method. SVM solves the several problems such as unclear network structure and local minimum in neural network algorithms. SVM has a good advantage in dealing with nonlinear problems in small-sample identification and prediction and have been widely used.27,28 However, the SVM classification prediction accuracy is affected by the smoothing parameters
In summary, the improved EWT, RCMDE, and FWA-SVM were combined in this study to improve the accuracy of ball mill load prediction. First, the improved EWT algorithm is used to decompose the vibration signal, and the sensitive modal component is selected by the correlation coefficient method to reconstruct the signal. Then calculate the value of RCMDE to judge the load state of the ball mill. Finally, FWA-SVM is used to forecast the load parameters of ball mill. The proposed method provides a new approach of ball mill load forecasting.
Improved EWT’s refined composite multi-scale dispersion entropy
Improved EWT
EWT is a time-frequency analysis method to extract significant modes of signals. A more detailed introduction to EWT, including the construction of related functions and parameter selection, can be found in. 12 The essential part of this method is segmenting the Fourier spectrum. Relying on the spectrum segmentation method based on the local maximum will lead to the problem of over-segmentation or under-segmentation. In view of this, a more reliable spectrum segmentation method is proposed, and its main process is as follows.
The time-domain discrete signal f(n) is obtained. Due to improper selection of sample length or other external reasons (zero-point drift of sensor, signal waveform deviation caused by base movement, etc.) when recording is intercepted, the trend term is generated. Therefore, the least square method is used to eliminate the trend term of the signal.
According to the Fourier transform, the frequency spectrum
Then use the cubic spline interpolation method to obtain the spectral envelope of the signal. All local maxima in the signal spectrum are searched, and the maxima are sorted in descending order (
Wavelet function
By using the inverse Fourier transform to compute
Refined composite multi-scale dispersion entropy (RCMDE)
Dispersion entropy (DE) is an algorithm that characterizes the complexity and irregularity of time series. The application of multi-scale dispersion entropy can further distinguish the characteristic difference. Compared with the multi-scale dispersion entropy algorithm, the RCMDE signal processing method can effectively reduce the loss of statistical information in the coarse-graining process, and prevent the influence of the calculation result from initial point shifting by averaging the multiple initial points, thereby reducing the calculation error. Based on the above analysis, this paper uses RCMDE to extract the characteristics of the vibration signals of the ball mill. The main calculation steps of RCMDE are as follows.
(1) For a given original data


where N denotes the length of the time series; τ is the scale factor; k represents the serial number of coarse-grained series with the starting point of
When the starting point different from
(2) For each
(3) Finally, the RCMDE of

where m is embedding dimension; c is the number of class; d is time delay.
In the RCMDE algorithm, the parameters including class c, embedding dimension m and time delay d need to be preset. In practice, time delay is recommended to d = 1 because aliasing may occur when d > 1. 24 Clearly, we need c > 1 in order to avoid the trivial case of having only one dispersion pattern. We always classify the ball mill load into 3 classes including underload, normal load and overload, so c = 3 is set according to the application. Besides, since too small m will cause RCMDE insensitive to the dynamic changes of the original signal while too large m will make RCMDE unable to detect small changes, m usually takes 2 or 3. 24 Therefore, c = 3, m = 2 and d = 1 were set as recommended by Rostaghi and Azami. 24
Establishment of mill load prediction model
FWA-SVM algorithm principle
The FWA is a swarm intelligence algorithm obtained by observing the blooming pattern of fireworks. 32 The feasible solution of each space is regarded as a firework. The best iteration times are designed by using an explosion operator, mutation operator, mapping rules, and selection strategy. The steps to optimize SVM by the firework algorithm are as follows.
Step 1 Set N fireworks to represent random N solutions un.
Step 2 Solve the explosive radius Bn and the number of explosive sparks Qn of each firework.


where Bn is the explosive radius of the n-th individual; Qn is the number of sparks generated by the n-th individual; ymin = min{f(un)} represents the best fitness value in the current population; ymax = max{f(un)} represents the worst fitness value in the current population; C is a constant used to adjust the explosion radius; H is also a constant used to adjust the amount of sparks produced by the explosion;
In the iterative process, the number of sparks can be limited to prevent too many or too few sparks under the optimal or inferior adaptability value. The limit conditions are as follows.

where
Step 3 To generate sparks, the dimension of the set


where h represents the offset,
Step 4 The mutation operator is calculated, and the Gaussian variation of each dimension is processed by crossing the boundary. The result is saved in the Gaussian population.

where e is the Gaussian noise with a mean of 1 and a variance of 1;
Step 5 The best population of all populations is selected, and then the remaining N-1 population by the wheel selection method is selected. The formula is as follows.


where P(un) represents the selection probability of the individual un; R(un) represents the sum of the Euclidean distance between the n individual and the other individuals; d(un-uj) represents the Euclidean distance between individual un and individual uj; K is the set of all individuals.
Step 6 If the condition of iteration termination is met, the optimal SVM parameter is generated at the end of the iteration; otherwise, the iteration continues.
Establishment of load identification model
The ball mill load forecasting model based on the FWA-SVM algorithm is established. The concrete steps are as follows.
The collected vibration signals from ball mill shell under different load conditions are decomposed by the improved EWT, and multiple modal components are obtained.
The correlation analysis of each modal component is carried out (details see Cai et al. 23 ), and the sensitive IMF components with a large correlation coefficient are selected to reconstruct the signal. Then, the RCMDEs of the sensitive IMF components are calculated, and the 20-dimensional feature vector set is constructed based on that.
PCA is used to reduce the dimensions of the multi-dimensional feature vector.
The feature vectors after the dimension reduction are entered into the ball mill load prediction model based on the FWA-SVM algorithm, and then the mill load parameters are acquired. The flow chart is shown in Figure 1.

Flow chart of the mill load prediction model.
Experimental study
Data collection
This experiment uses the Φ330 mm × 330 mm Bond index of dry type ball mill in laboratory as the experimental object. A DH5922N dynamic data acquisition instrument, DH131 vibration acceleration sensor, DH5857-1 charge adapter, cylindrical universal bearing, and PC constitute the vibration signal acquisition system. The picture and schematic diagram of the acquisition system are shown in Figure 2. The sampling frequency is set to 20 kHz. The filling rate and material-to-ball ratio were uniformly changed to collect multiple samples of ball mill shell vibration signals under three different loads. The mill load is classified into three categories: the filling rate between 10% and 20% as underload, the filling rate between 20% and 40% as normal load, and the filling rate between 40% and 60% as overload.
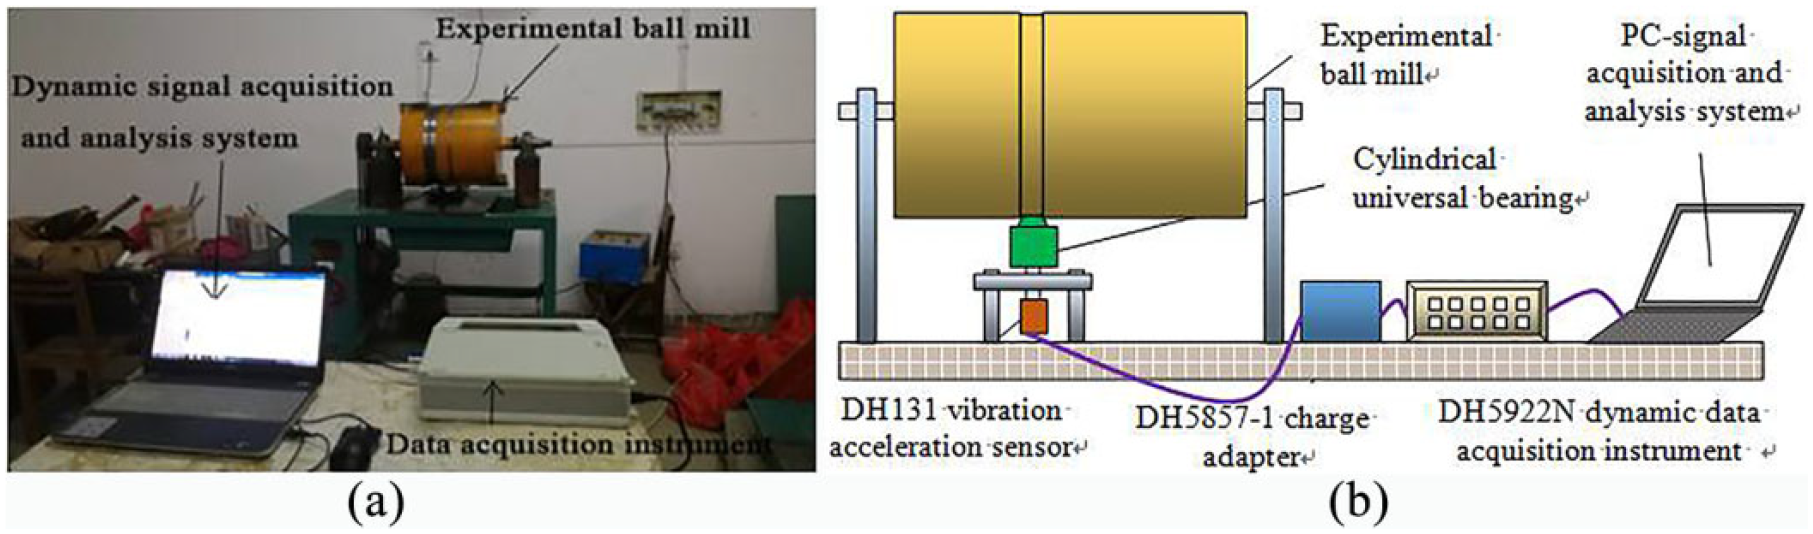
The vibration signal acquisition system: (a) the picture and (b) schematic diagram.
Decomposition of the shell vibration signal
The ball mill shell vibration signals are selected in underload (material-to-ball ratio 0.30, filling rate 15%), normal load (material-to-ball ratio 0.50, filling rate 30%), and overload (material-to-ball ratio 0.70, filling rate 50%), respectively. The results are shown in Figure 3.

Waveforms of the original shell vibration signals: (a) underload, (b) normal load, and (c) overload.
In Figure 3, it can be seen that there are a lot of noises in the original signals under three load conditions. Although there are some amplitude differences between three load conditions in the time domain, the distinction is not obvious. Therefore, the improved EWT algorithm is used to preprocess 10 groups of vibration signals under each load condition. Then, 10 intrinsic mode function (IMF) components are obtained from each group of signals, and the correlation coefficient between each IMF component and the original signal is calculated. Finally, the average correlation coefficient and average threshold within the 10 groups of signals are calculated under each load condition. The results are shown in Figure 4.

Relation between the correlation coefficient and the sequence number of the IMF component.
As shown in Figure 4, the average threshold of each load condition is 0.2742 (underload), 0.2431 (normal load), and 0.2399 (overload), respectively. According to the sensitive IMF component selection rules, the correlation coefficient between the component and the original signal is greater than the threshold, the component is retained as a sensitive IMF component. Otherwise, the component is removed as a false component. In the end, IMF2, IMF7, IMF8, and IMF10 are selected as sensitive modal components in underload condition. IMF2, IMF3, IMF6, IMF7, and IMF10 are selected as sensitive modal components in normal load condition. IMF1, IMF2, IMF3, and IMF10 are determined as sensitive modal components in overload condition. The remaining modal components are considered as false components. After that, the selected sensitive IMF components are used to reconstruct the original signals as shown in Figure 5.

Waveforms of the reconstructed vibration signals: (a) underload, (b) normal load, and (c) overload.
By comparing Figures 3 and 5, we can see that the high frequency noises are effectively removed from the reconstructed signals under different load condition, while the amplitudes and trend changes of the signals are mostly retained, so that the rich feature information of the original signals is preserved in the reconstructed signals. To further verify the superiority of the improved EWT algorithm, EMD and EWT algorithms were used to decompose the same original vibration signals under load condition 1. Then, the correlation coefficient method was also used to select the sensitive IMF components for reconstruction. The reconstructed signals by EMD and EWT are shown in Figure 6.

Vibration signal reconstruction of under working condition 1: (a) EMD reconstruction and (b) EWT reconstruction.
By comparing Figure 6 with Figures 3(a) and 5(a), it can be seen that the improved EWT algorithm can remove more high-frequency noise than EMD and EWT. Moreover, the reconstructed signal processed by improved EWT is smoother than that processed by EMD or EWT algorithm while the original signal amplitude is well preserved. In order to further quantify the denoising effect of three algorithms, their signal-to-noise ratios are calculated, the results are shown in Table 1.
SNR after denoising by three algorithms.

As seen in Table 1, the noises are significantly reduced by the improved EWT algorithm. Moreover, compared with the other algorithms, the denoising effect of the improved EWT algorithm is the best.
Extraction Load Features
In order to highlight the superiority of the improved EWT-RCMDE feature extraction method, four hybrid methods including improved EWT-MSE, improved EWT-MDE, EWT-RCMDE, and improved EWT-RCMDE are examined by the ball mill shell vibration signals in underload, normal load and overload conditions. RCMDEs in the first 15 scales (i.e.,
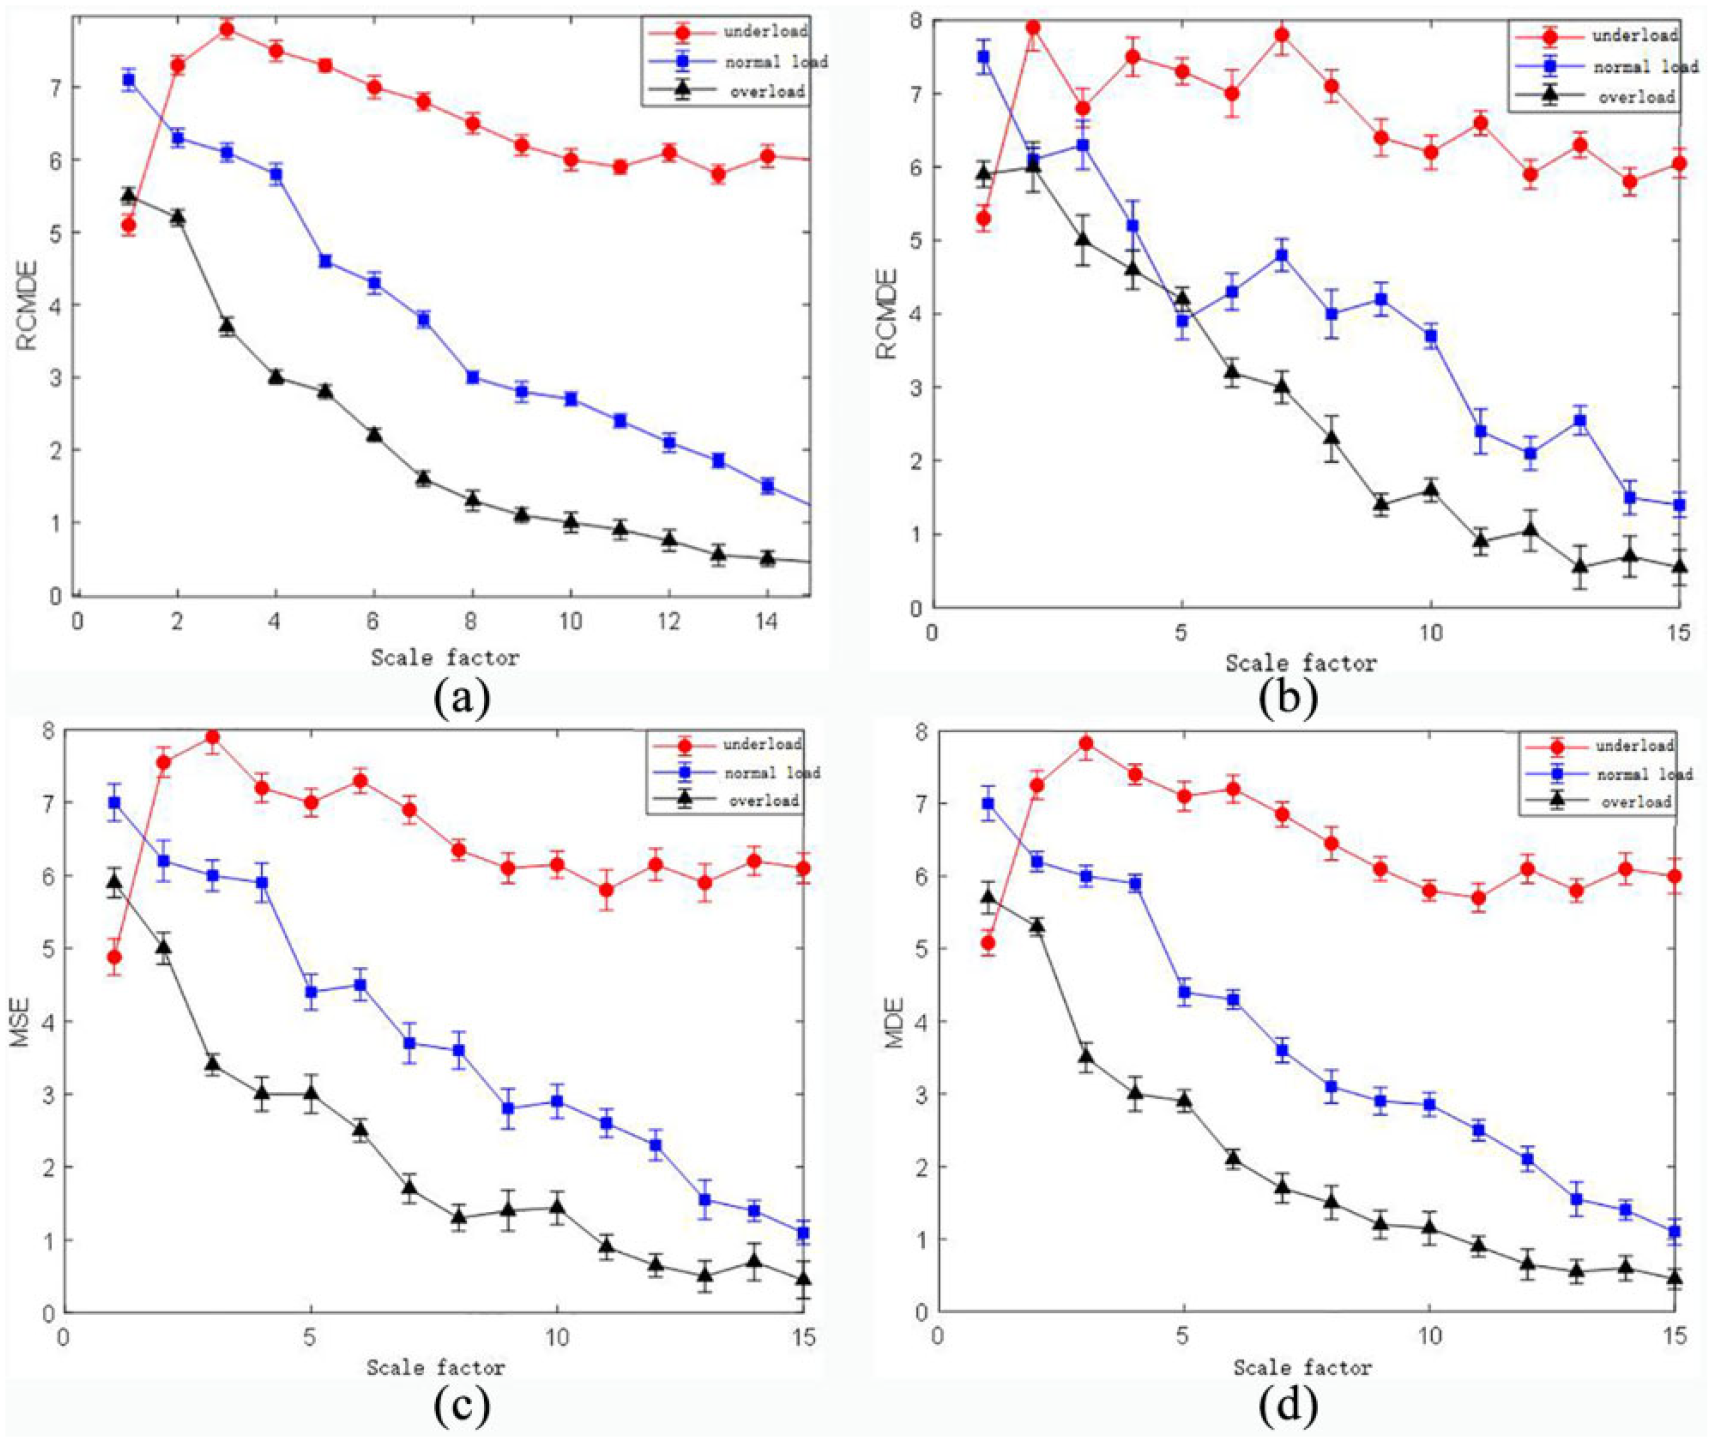
Curves of characteristic mean and standard deviation under three load conditions: (a) improved EWT-RCMDE, (b) EWT-RCMDE, (c) improved EWT-MSE, and (d) improved EWT-MDE.
As shown in Figure 7, several phenomena are worth to be analyzed. First, all the entropy values have a decreasing trend with the increase of scale factor except for that of underload
Training and testing
After normalizing the RCMDEs of reconstructed vibration signals into 20-dimensional feature vectors, four-dimensional feature vectors are finally obtained by PCA dimensionality reduction. The four-dimensional feature vectors are entered into the FWA-SVM mill load prediction model, and the material-to-ball ratio and filling rate are the outputs. About 30 groups of vibration signals under different load parameters were selected and processed by the improved EWT-RCMDE method, including 15 groups as training samples (five samples for each of the three loads), and 15 groups as test samples. In order to verify the superiority of FWA-SVM, PSO-SVM and GA-SVM were used for comparison. The initial parameters of the three algorithms are set as: the population number is 20, and the maximum number of iterations is 200. The parameters of SVM model optimized by three algorithms and the recognition results are shown in Table 2 and Figure 8.
SVM parameters optimized by three algorithms and recognition accuracy of three algorithms.


The relation between fitness value and the number of iterations/time of three algorithms.
As can be seen in Table 2 and Figure 8, after the optimization of SVM parameters by FWA, the time to reach the maximum fitness value is shorter than that of PSO. Furthermore, FWA has higher recognition accuracy rate than PSO and GA (6.60% higher than GA-SVM and 6.60% higher than PSO-SVM). These findings indicate that the fireworks algorithm is more capable of obtaining optimal kernel function parameters than PSO and GA. The average iteration time of the SVM parameters optimized by FWA is only 13.80 s, which is 76.20 s shorter than that of GA. Meanwhile, the PSO has the longest iteration time but does not give the best fitness value. To sum up, the FWA can quickly and accurately optimize SVM parameters.
The above processed training samples and test samples were entered into these three different recognition models to conduct load prediction comparison, and the results are shown in Figures 9 and 10.
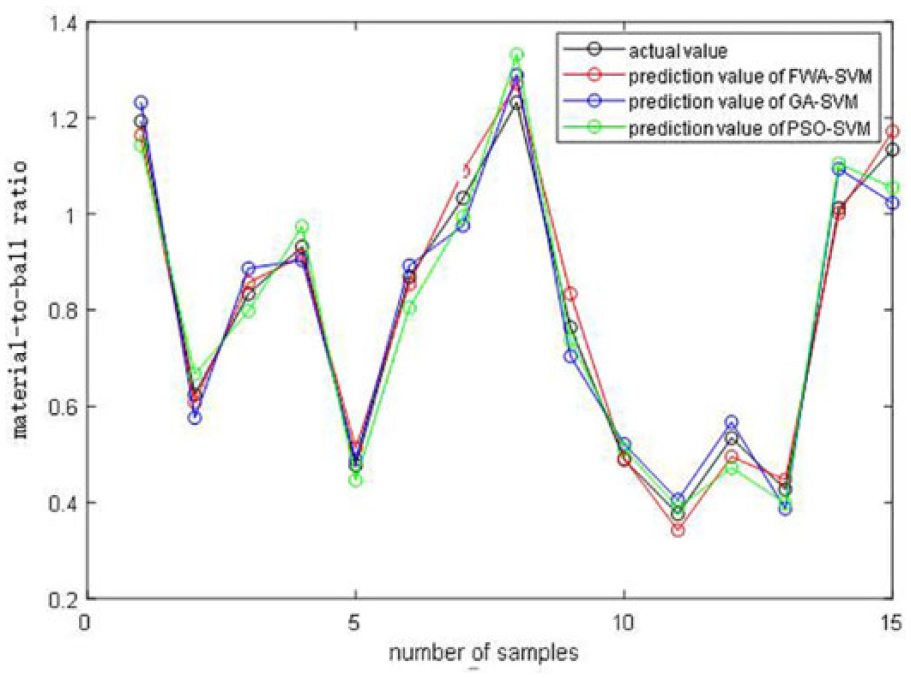
Prediction results of material-to-ball ratio.
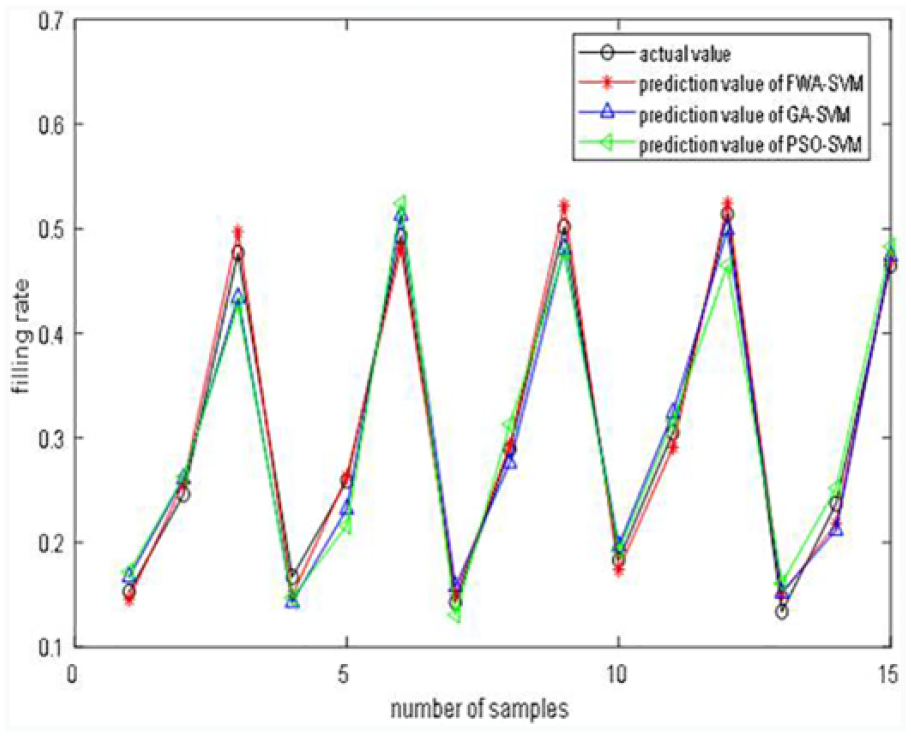
Prediction results of filling rate.
As can be seen in Figures 9 and 10, the material-to-ball ratio and filling rate predicted by the FWA-SVM model are close to the real value, and the accuracy of the mill load prediction is higher. In order to further determine the accuracy of mill load prediction, their mean absolute percentage error (MAPE) and root mean square error (RMSE) were calculated. The results are shown in Table 3.
Error comparisons between models.

As can be seen in Table 3, the MAPE of the material-to-ball ratio and filling rate predicted by the FWA-SVM model are 4.19% and 4.77%, respectively, which are lower than those predicted by GA-SVM and PSO-SVM models, respectively. Compared with the GA-SVM model and PSO-SVM model, both the FWA-SVM’s RMSE of the material-to-ball ratio and the filling rate are the smallest among the three models. This indicates that the FWA-SVM model prediction method has higher accuracy and stability.
Conclusion
In view of the diversity and complexity of mill vibration signals, an improved EWT algorithm is proposed. By comparing the decomposition effect of improved EWT with those of EWT and EMD, the effectiveness of improved EWT method is proved. By using the improved EWT to decompose the vibration signal of ball mill and the correlation coefficient method to select the sensitive IMF components, the reconstructed signals can well retain the characteristic information. Moreover, the signal-to-noise ratio is improved by 14.03 dB compared with EMD.
By calculating the average RCMDE of the reconstructed signal under three load states, the results show that the average RCMDE calculated in underload, normal load and overload conditions are quite different, which can better distinguish the different load states of the mill. Compared with MSE and MDE, RCMDE has significantly smaller errors and better recognition results.
The experimental results show that the mill load prediction model based on the FWA-SVM model is more accurate and stable than that based on the GA-SVM and PSO-SVM. The FWA-SVM model has the smallest errors in predicting the material-to-ball ratio and filling rate among these three models while keeps the shortest time to optimize the SVM parameters.
Footnotes
Appendix A: Reviews of DE
For a given univariate time series
It is obvious that
where R represents the rounding operation and
where
It can be found from the algorithm of DE that when all probabilities of distribution patterns
Appendix B: Abbreviations
EWT empirical wavelet transform
RCMDE refined composite multi-scale dispersion entropy
FWA fireworks algorithm
SVM support vector machine
GA genetic algorithm
PSO particle swarm optimization
EMD empirical mode decomposition
WT wavelet transform
MFE multi-scale fuzzy entropy
AEPSO_PNN adaptive evolution particle swarm optimization probabilistic neural network
MSE multi-scale entropy
DE dispersion entropy
IMF intrinsic mode function
Handling Editor: James Baldwin
Declaration of conflicting interests
The author(s) declared no potential conflicts of interest with respect to the research, authorship, and/or publication of this article.
Funding
The author(s) disclosed receipt of the following financial support for the research, authorship, and/or publication of this article: This research was financially supported by the National Natural Science Foundation of China (Grant No. 51464017) and the Education Department of Jiangxi Province (Grant No. GJJ190452).