
Abstract
A 30°/30° S-duct is often employed by a modern civil and military aircraft. Due to the vortex generators have poor control effect on the flow separation in the large curvature S-duct, so a new method adjusting the direction of the main flow in the transition zone for S-duct is proposed in the present study. These studies are carried out by solving Navier-Stokes equations with SST k-ω turbulence model. In order to explore the control mechanism of guide vanes on the flow field for S-duct, the internal flow field of S-duct with/without guide vanes is analyzed and compared in detail, including the velocity distribution on the symmetry plane, the secondary vortex intensity at different cross sections, turbulent kinetic energy on different cross sections, total pressure distribution on different cross sections, three-dimensional streamline, and so on. The results show that guide vanes can not only effectively adjust the direction of the main flow, but also restrain the flow separation, reduce the total pressure loss, and improve the uniformity of flow field.
Introduction
The S-duct has several advantages: (1) its structure is compact 1 ; (2) can reduce the resistance of the propulsion system 2 ; (3) can reduce the sweeping area of radar and improve the stealth performance of the aircraft.3–5 In view of the above advantages, it has been widely applied in modern commercial aircraft and military aircraft, such as Boeing 727, General Dynamics F-16, and McDonald-Douglas F-18.6–8
In order to decrease the velocity of airflow and increase the static pressure of airflow effectively, and provide a uniform airflow for an engine compressor, 7 the geometric characteristics of an ideal S-duct are that the centerline has curvature and the cross section increases along the streamwise direction,7,9,10 which is a bent diffused duct. The curvature of the centerline leads to the formation of a pair of counter-rotating vortices, and increasement of cross section produces the streamwise adverse pressure gradient, which leads to the flow separation.11,12 All these cause the decrease of total pressure recovery coefficient and the increase of distortion coefficient on the aerodynamic interface plane (AIP), which not only drop the performance of the engine, but also lead to diversified troubles. 7
Numerous researchers have studied the flow-field of S-duct. Wellborn et al. 7 studied the subsonic compressible flow through a diffused S-duct. They observed the streamwise flow separation in the S-duct and the counter-rotating vortices on the AIP, and provided standard verification data for computational fluid dynamics (CFD). Wendt and Reichert 8 have conducted an experimental study on vortex ingestion in a diffused S-duct. They reported that the appropriate vortex ingestion can improve the quality of the flow-field on the AIP. Fiola and Agarwal 13 have studied numerically the diffused S-duct, employing different turbulence models in their research. It is found that the SST-k-ω turbulence model has a better ability to capture the flow-field. Gil-Prieto et al. 14 have carried out a delayed detached-eddy simulation on the flow-field in S-duct. They demonstrated that DES simulation has good ability to capture the unsteady characteristics for the highly turbulent flow-field in the S-duct. All the above studies show that the flow separation and secondary flow in S-duct will cause the non-uniformity of the flow field and the total pressure loss, which will affect the performance of the engine.
In order to reduce the total pressure loss and make the flow field uniform for S-duct, many researchers use flow control methods. The commonly used passive control method is the vortex generator (VG). Researchers mainly controlled the local boundary layer separation near wall in S-duct by vortex generators in the past. The vortex generator can play a good role in controlling the local flow separation near wall region. Through the generated vortices by VGs, the high-energy fluid in the core zone is transported to the low-energy fluid in the boundary layer, so that the boundary layer separation can be prevented. The vortex generator also introduces secondary flow, which can prevent the formation of a pair of counter-rotating vortices. 15 Vakili et al. 16 arranged wing-type vortex generators upstream of the transition zone for a 30°/30° S-duct and successfully eliminated the flow separation. Sullerey et al. 17 investigated the effect various vortex generator configurations in reducing the flow total pressure loss and distortion in S-duct (16°/16° and 24°/24°). Their results show that it is possible to use vortex generators to increase static pressure and improve flow field quality. Tanguy et al. 18 carried out a vortex generator flow control study in an S-duct by using stereo particle image velocimetry. Their results show that the vortex generator is helpful to reduce the flow total pressure loss, but the control effect of the distortion of the flow field is poor. The results also show that vortex generators flow control method is effective in inhibiting the boundary layer separation near the wall for a small curvature S-duct, but it has little effect on inhibiting the flow separation for a large curvature S-duct.
Guide vanes are often employed to adjust the main flow direction. Tan et al.19–21 employed guide vanes to adjust the main flow direction in the flow field induced by force-vortex and established appropriate theoretical model to predict the flow field. For the diffused S-duct, due to the main flow is affected by the adverse pressure gradient and centrifugal inertial force, the direction change of the main flow along the centerline of S-duct is easy to cause the boundary layer separation near the outer wall of the exit zone and secondary vortex generated by the flow through bend. In order to better inhibit the flow separation near outer wall of the exit zone and the non-uniformity of velocity distribution in the main flow zone, a new method is proposed to improve the flow quality on the AIP by adjusting the main flow direction in the transition zone. Compared with the local flow control technology of vortex generator, the present paper attempts to set guide vanes in the transition zone of diffused S-duct to adjust the main flow direction so that the main flow can not only be close to the outer wall of the exit zone as much as possible to inhibit the local separation near the outer wall, but also adjust the non-uniformity of velocity distribution in the main flow zone to improve the flow field quality and uniformity on the AIP. The method of setting guide vanes in the transition zone of S-duct to improve flow field quality is rarely used in the past literatures.
In the present paper, by use of numerical simulation, the mechanism of adjustment of the direction of the main flow and improvement the main flow field through the S-duct are explored for a diffused S-duct with guide vanes in transition zone.
Computational setup
Model in study
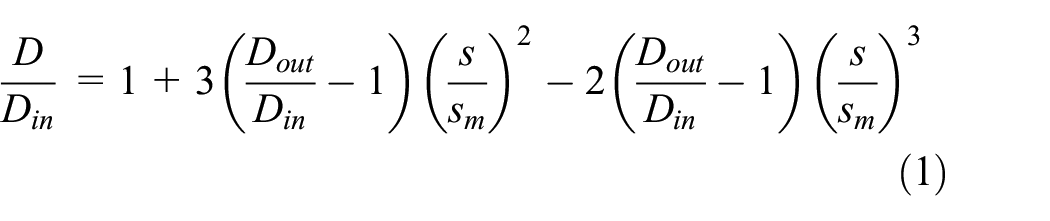
As shown in Figure 1, the geometric model studied in the present paper is a 30°/30° S-duct. Delot et al. 22 have studied the flow field in the duct experimentally. Reza et al. 23 have also carried out a numerical study on internal flow field of the S-duct. The main geometric dimensions are given in Table 1. The center line of the S-duct is composed of two arcs, and the center angle of each arc is 30°. The diameter of the inlet of the S-duct Din is 133.15 mm, the diameter of the outlet Dout is 164 mm, the curvature radius of the central line r0 is 665.4 mm, the arc length of the central line sm is 5.32Din, the length of the s-duct L is 5Din, the offset of the model H is 1.35Din, and the detailed information of the diameter of each cross section along the s coordinate can be given by

Schematic of 30°/30° S-duct geometry model.
Geometric dimensions of S-duct.

in which,
Numerical method and validation
The double precision solver of ANSYS FLUENT 16.0 is used to perform a numerical simulation for the flow-field in the S-duct. In the simulation, the Reynolds-averaged Navier-Stokes (RANS) equations are solved with a finite volume method. The SST-k-ω turbulence model is employed for the numerical simulation. The SIMPLE algorithm is used to deal with pressure-velocity coupling. The convection terms are discretized by second order upwind scheme, and the diffusion terms are discretized by second order central difference scheme.
The mesh for the simulation is generated in the ANSYS ICEM16.0 and the number of hexahedral cells is about 7.8 million for S-duct. The whole domain mesh is shown in Figure 2(a), the distance between the inlet of the whole domain and the inlet of S-duct is 6Din, the distance between the outlet of the whole domain and the outlet of S-duct is 4Din. The mesh for the outlet of the domain is shown in Figure 2(b). The number of nodes in S-duct cross section is about 13,000, and the number of nodes in the centerline of S-duct is about 600. The first layer grid height next to the wall is enough small to ensure the y+ smaller than 1 and the expansion ratio off the wall is 1.05, so the mesh has better quality and could capture the main flow field details.

Mesh for numerical simulation: (a) The mesh of the whole domain (display one every six nodes) and (b) The mesh for the outlet (display one every six nodes).
Appropriate boundary conditions are very important for numerical simulation. The pressure inlet boundary condition was chosen for the inlet of computational domain and the pressure outlet boundary condition was chosen for the outlet of computational domain. According to the atmospheric environment when the S-shaped intake works at altitude of 1100 m, total pressure (P0,inlet = 88,744 Pa) and total temperature (T0 = 281 K) were set at the pressure inlet. The static pressure (Poutlet = 79,700 Pa) was set at the pressure outlet to meet the outlet mass flow of 2.427kg/s.
To verify the numerical method, the simulation results are compared with the results in the literatures,22,23 as shown in Figure 3. The surface pressure coefficient Cp for L-up and L-down are compared with literature results. The pressure coefficient Cp is calculated according to the following formula,

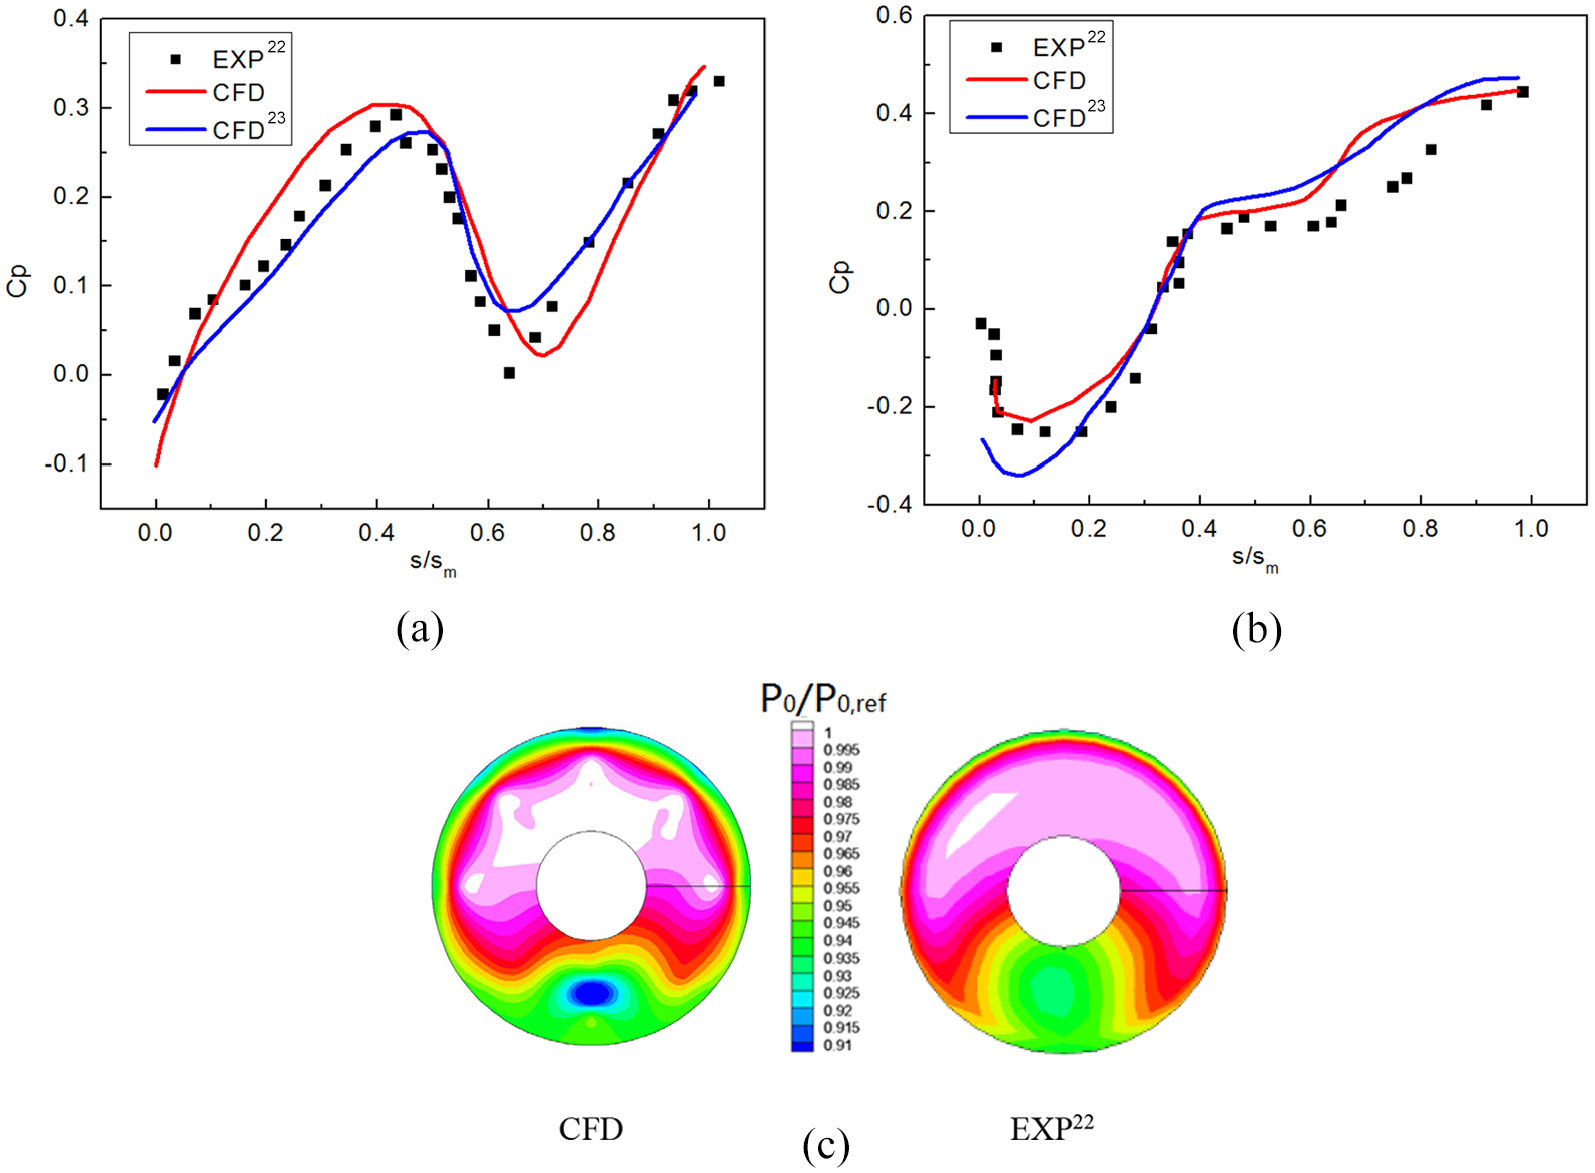
In which
The mean flow field characteristics in the diffused S-duct
Computational results
The streamwise velocity (Us/Uref) distributions on the six cross sections of S-duct are shown in Figure 4. The velocity distributions on six lines (L1–L6) are shown in Figure 5. In Figure 5, dimensionless coordinate η is given by


Streamwise velocity distributions (Us/Uref) on six cross sections.

Variation of dimensionless velocity (Us/Uref) with η.
The whole flow field of S-duct is divided into three parts: the entrance zone (0 < s/sm < 0.417), the transition zone (0.417 < s/sm < 0.583), and the exit zone (0.583 < s/sm < 1). In the entrance section, the fluid velocity near the upper wall is higher than that of the lower wall, and the pressure is lower. In the exit zone, the fluid velocity near the upper wall is lower than that of the lower wall, and the pressure is higher. In the transition zone, the streamwise velocity profile changes.
Due to the direction of the main flow in the transition zone change, it will cause the direction of the main flow not parallel to the centerline, and thus lead to the flow separation. It is helpful to reduce the separation area and improve the quality of the flow field that adjusting the direction of the main flow the transition zone. In order to better adjust the direction of the main in the transition zone, we first analyze the characteristics of main flow from the Navier-Stokes equations.
Establishment of theoretical model
The flow in the S-duct is mainly affected by streamwise adverse pressure gradient, the transverse pressure gradient, and the inertial centrifugal force. There is not only streamwise flow separation and secondary flow, but also the direction change of the main flow in the S-duct. The flow characteristics will affect the flow quality in the S-duct, and then affect the performance of the engine. In the process of the main flow progresses downstream, it is mainly affected by centrifugal force and transverse pressure gradient, showing a typical potential flow behavior. In the entrance zone, the velocity distribution on the symmetry plane of the duct is that the velocity of the main flow near the inner wall is higher, the pressure is lower, and the velocity of the main flow near the outer wall is lower, the pressure is higher. In the exit zone, the velocity distribution is that the velocity of the main flow near the inner wall is higher, the pressure is lower, and the velocity of the main flow near the outer wall is lower, and the pressure is higher. The transition zone belongs to the adjustment zone of the direction of the main flow.
Without considering the boundary layer flow, we make some simplification and consider a curved duct with constant cross section. Ignore streamwise pressure gradient and gravity and adopt the coordinate system as shown in Figure 6.


Coordinate system used in S-duct.
The continuity equation is,

After simplification, we get,

The r-momentum equation,
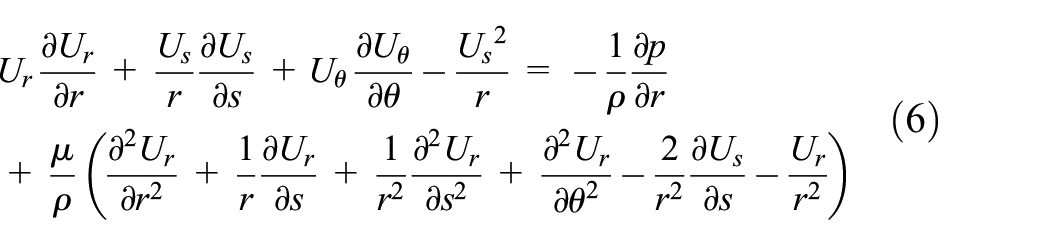
After simplification, we get,
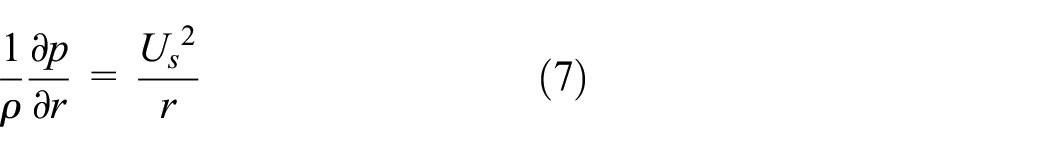
The s-momentum equation,

After simplification, we get,

Considering

Rearrange equation (10),

Integrating of both sides of equation (11),

Integrating of both sides of equation (12),

It can be seen from equation (13) that the flow velocity is induced by the combination of forced vortex and free vortex.

The volume flow through the duct is

The following equations (16) and (17) can be derived from the geometric relationship


By substituting equations (16) and (17) into equation (15), K can be obtained

The comparison between the theoretical and numerical results is shown in Figure 7. In the numerical simulation, K is obtained by the following formula

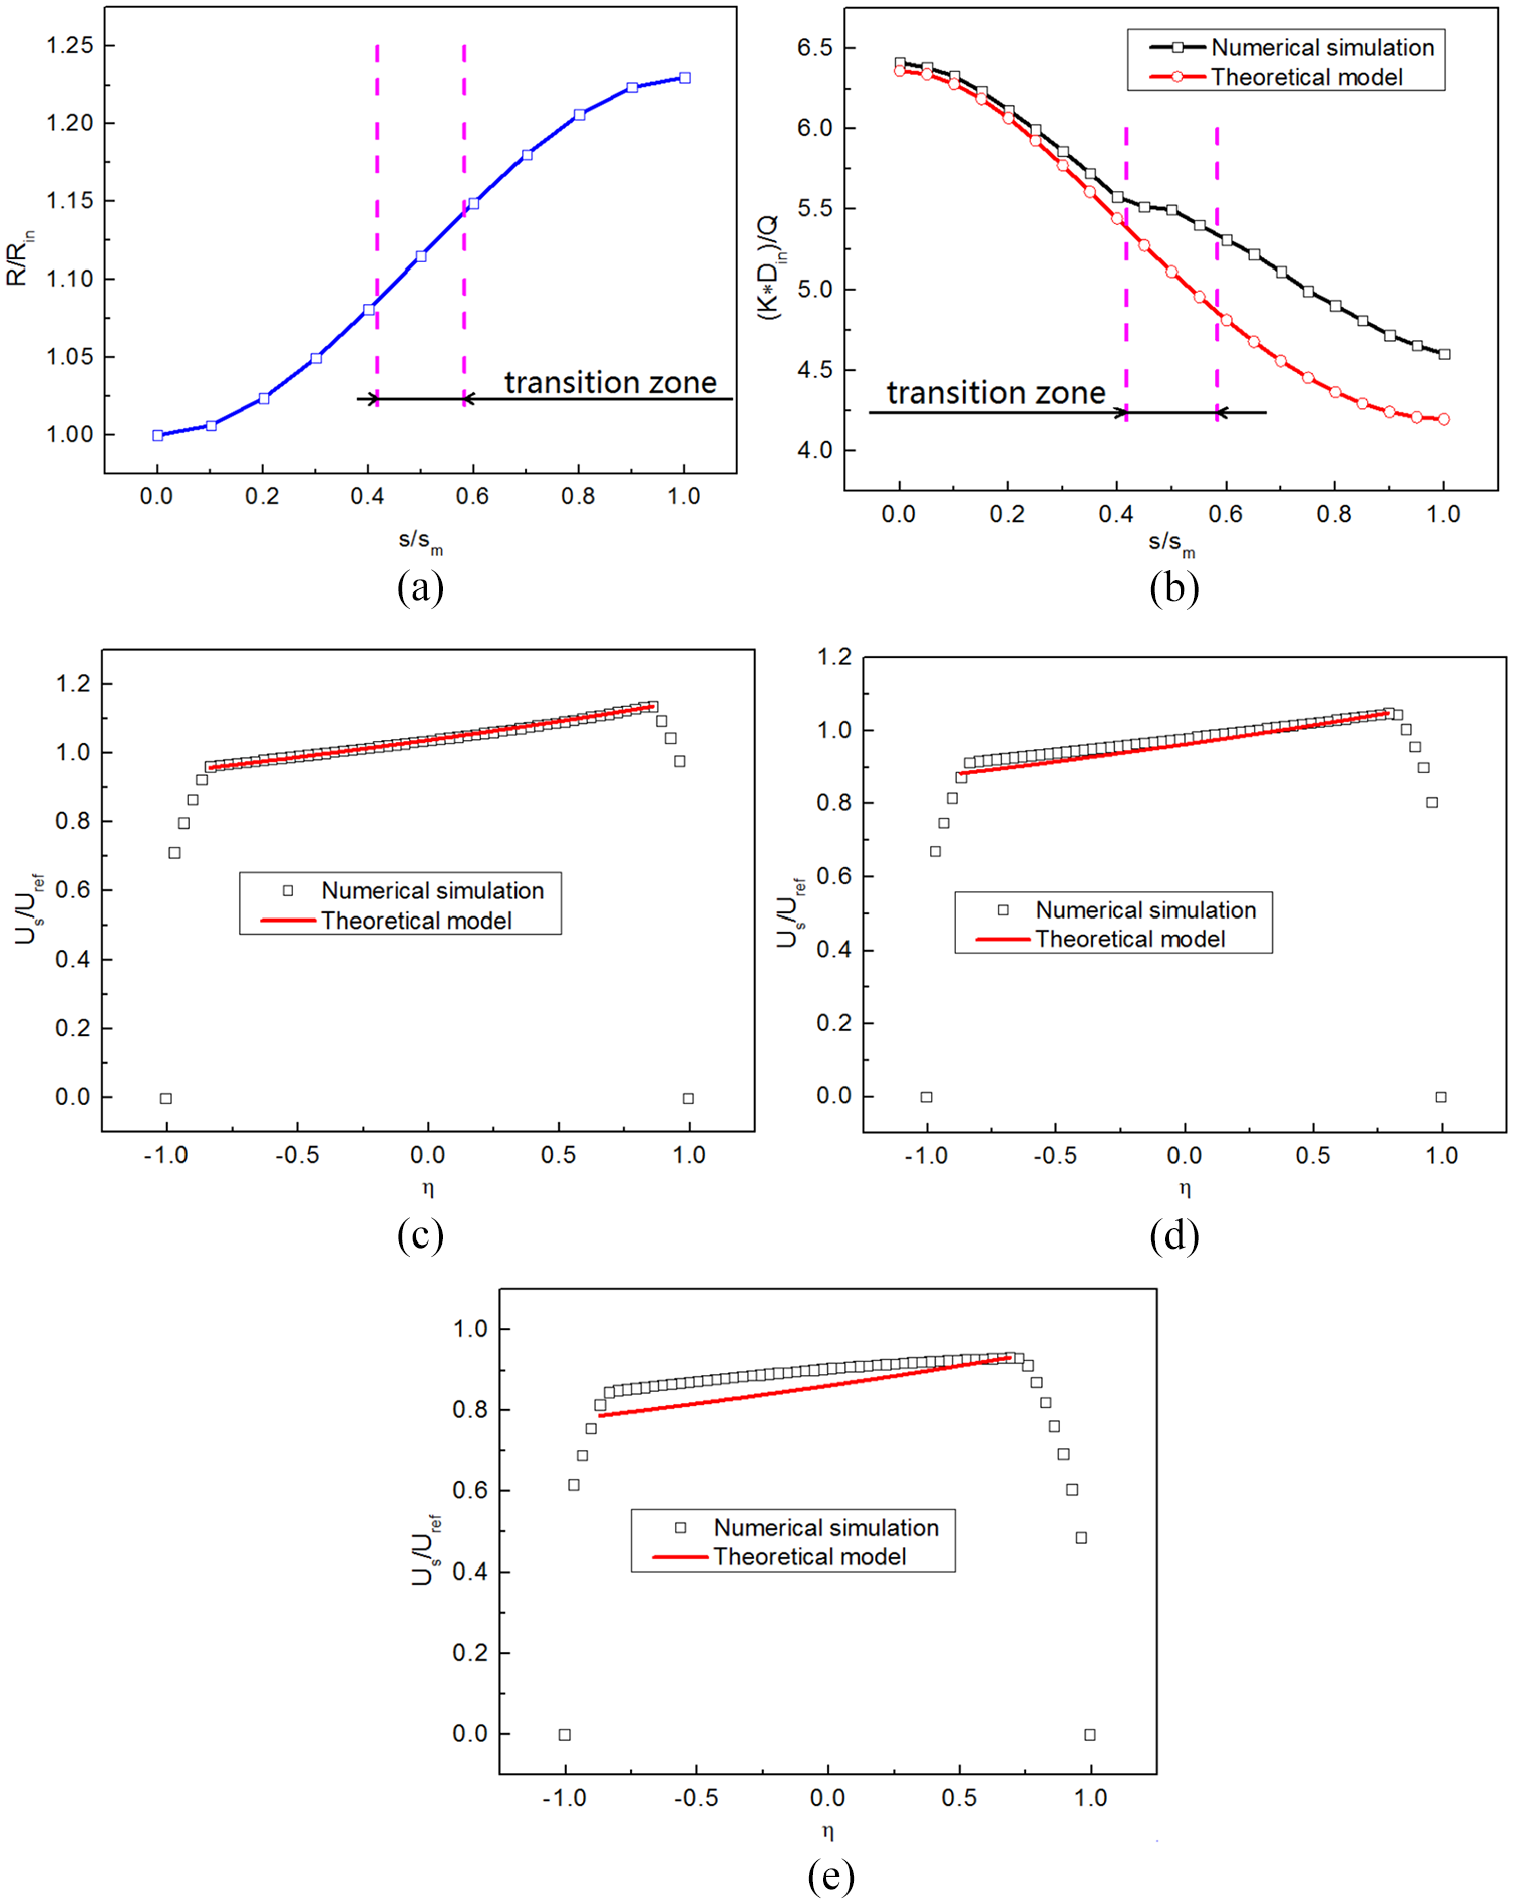
Comparison between theoretical results and numerical results: (a) the change of cross section radius, (b) theoretical and numerical results, (c) velocity profile on L1, (d) velocity profile on L2, and (e) velocity profile on L3.
Figure 7(a) shows the change of cross section radius with s/sm. As the flow progressed downstream, the change of
Adjusting the direction of the main flow by using guide vanes in the transition zone
The problem studied in this paper is that the direction change of the main flow in the case of a diffused S-duct with adverse pressure gradient. The main flow is affected by adverse pressure gradient, centrifugal force, viscous force, and inertial force. In this paper, the uniformity of flow field is improved by adjusting the direction of the main flow in the transition zone. The goal of adjusting the direction of the main flow in the transition zone is to reduce the flow field distortion and make the flow field more uniform without increasing the total pressure loss.
In order to better adjust the direction of the main flow, two guide vanes (Figure 8(a) and (b)) are set in the transition zone. The function of the guide vanes is to adjust the direction of the main flow, restrain the streamwise flow separation and secondary vortex flow in the S-duct, and improve the quality of the flow field in the cross section of the S-duct (reducing the total pressure loss and improving the uniformity of the velocity distribution on the cross section). The design of the guide vanes is based on the following principles: (1) due to guide vanes control the direction of the main flow, guide vane should be located in the main flow zone; 2) in order to avoid the corner vortex flow located in the interface between the guide vanes and the S-duct, guide vanes should not be completely connected to the wall of S-duct; (3) in order to control the flow field to a large extent and have a certain distance from the wall, the spacing between the deflectors is 0.4 times diameter of the cross section (s/sm = 0.5).
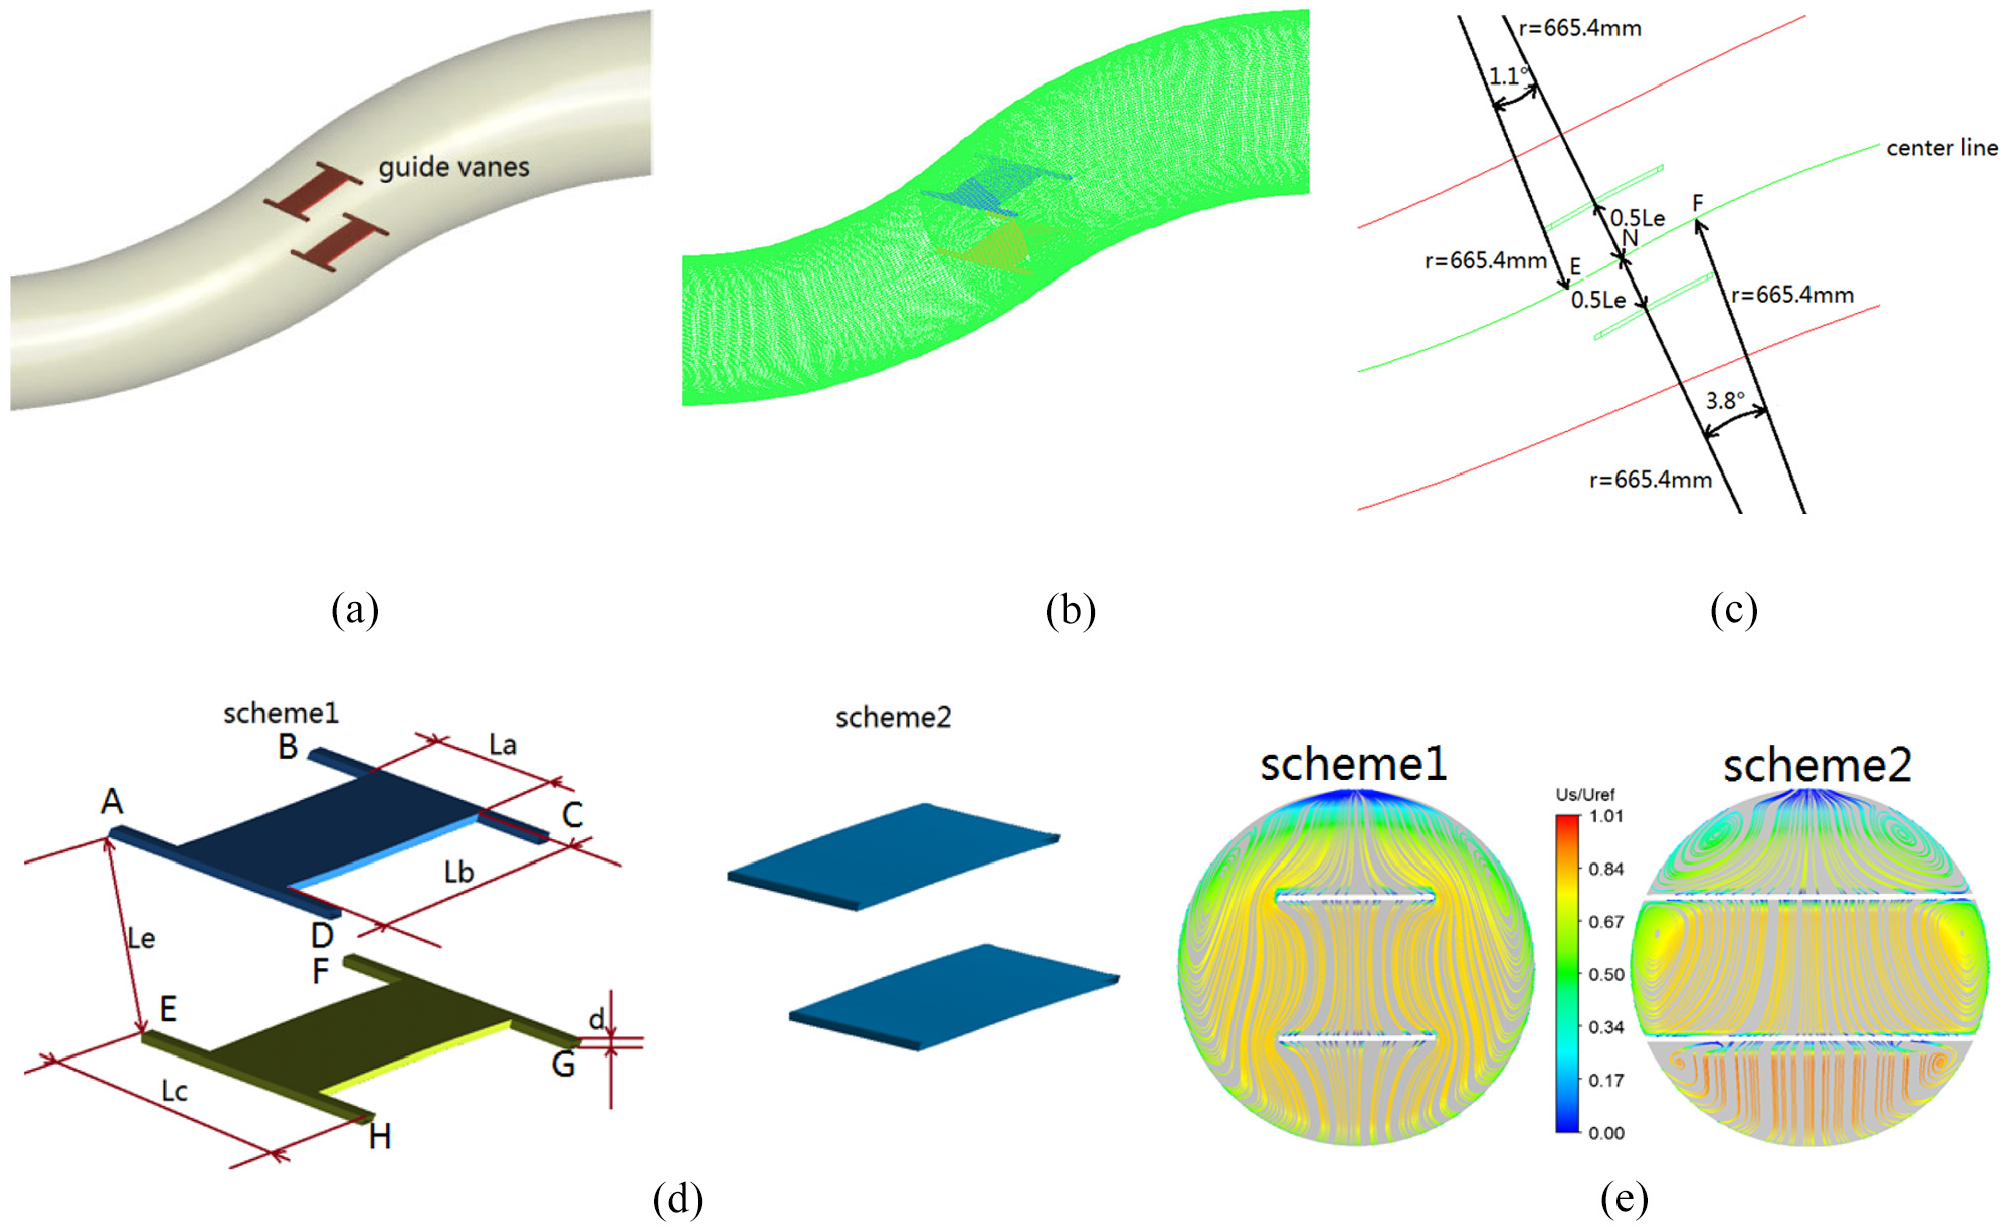
The guide vanes in the transition zone: (a) the position of guide vanes, (b) the mesh for the S-duct with guide vanes, (c) the symmetry plane of of guide vanes, (d) the geometric dimensions of guide vanes, and (e) secondary flow streamlines on cross section (s/sm = 0.5).
According to the above design principles, the geometric dimensions of the guide vanes are as follows. The width and length of the guide vane (scheme1) are La = 65 mm and Lb = 68vmm, respectively. The length of connecting rod Lc is 138 mm. The distance between the guide vanes (scheme 1) Le is 58 mm. The cross section edge length of the connecting rod d is 5 mm. The thickness of the guide vane (scheme 1) is also 5 mm (Figure 8(d)). The guide vanes for the scheme1 are connected with the S-duct wall through A, B, C, D, E, F, G, and H (Figure 8(d)). The difference between scheme 2 and scheme 1 is that the guide vanes (scheme 2) are completely connected to the wall of S-duct (Figure 8(d)). The edges of the guide vane are obtained by translating the center line ENF of the S-duct (0.482 < s/sm < 0.564, r = 665.4 mm) (Figure 8(c)). The center line EN (0.482 < s/sm < 0.5, r = 665.4 mm) has opposite curvature to the center line NF (0.5 < s/sm < 0.564, r = 665.4vmm) and is tangent to it at N (s/sm = 0.5) (Figure 8(c)). The placement direction of the guide vanes is also parallel to the center line (0.482 < s/sm < 0.564) (Figure 8(c)). The main reason why the guide vanes are not connected to the wall of S-duct is to avoid the corner vortex flow between the guide vanes and the S-duct (Figure 8(e)). Therefore, we finally choose the guide vanes (scheme 1).
The dimensionless streamwise velocity (Us/Uref) distributions on six cross sections for S-duct with guide vanes are shown in Figure 9. The velocity profiles on six lines for the S-duct with guide vanes are shown in Figure 10. Compared with Figures 4 and 5, it can be seen that due to the presence of guide vanes, the low-speed area near the upper wall surface of the exit zone is reduced.

Streamwise velocity distributions (Us/Uref) on six cross sections for S-duct with guide vanes.

Velocity profile on six lines for S-duct with guide vanes.
Figure 11 shows the comparison of
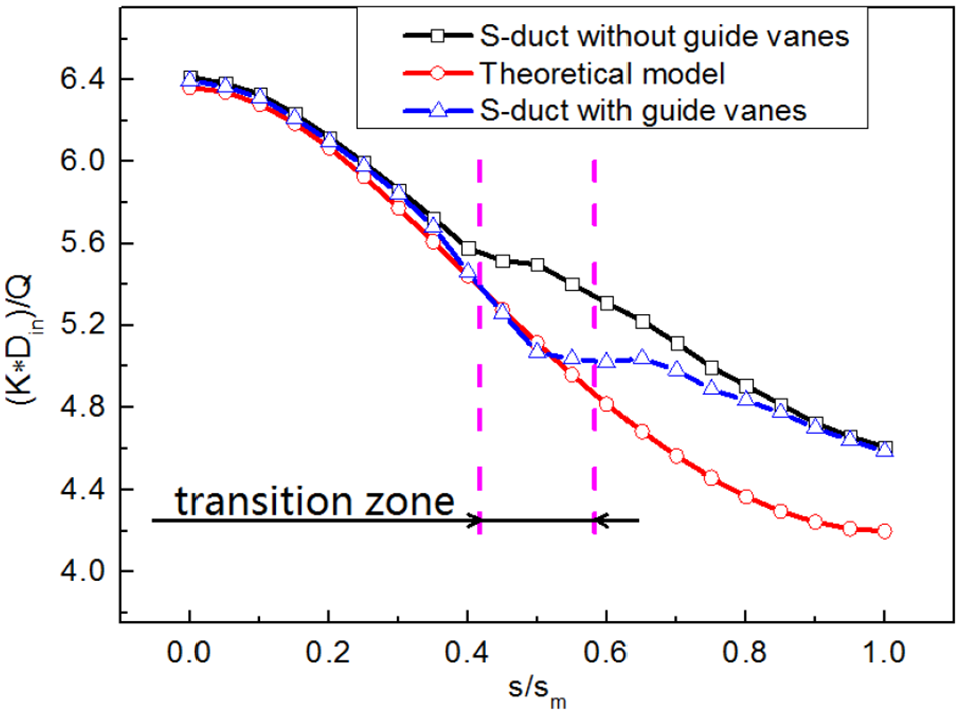
Comparison of
Figure 12 shows the streamline on the symmetry plane for S-duct with/without guide vanes. As the cross-sectional area of S-duct gradually increases in streamwise direction, streamwise adverse pressure gradient decelerates the flow velocity. At the same time, due to the curvature of the central line for the entrance zone and the exit zone are opposite, the direction of main flow in the transition zone is changed and there is the large streamwise adverse pressure gradient near the upper wall, so the flow separation area appears near the upper wall for the exit zone. By comparing Figure 12(a) and (b), we find that the guide vanes have an obvious adjustment effect on the direction of the main flow in the transition zone for S-duct, reducing the size of the separation zone and the total pressure loss.

The streamline on symmetry plane for: (a) S-duct without guide vanes and (b) S-duct with guide vanes.
Figure 13 shows the surface pressure coefficient for S-duct with/without guide vanes. It can also be seen from Figure 13(b) that there is a constant pressure area on the L-up line (0.4 < s/sm < 0.6), which implies the phenomenon of flow separation. In the downstream of the transition zone (0.6 < s/sm < 1), the pressure coefficient for S-duct with guide vanes is higher.

The variation of surface pressure coefficient with s/sm: (a) L-down line for S-duct and (b) L-up line for S-duct.
Due to the curvature of the center line of the S-duct, there will be secondary flow in the cross section of the duct under the combined action of centrifugal force and radial pressure gradient. A pair of vortices will appear in the cross section and gradually strengthen downstream (Figure 14). It can be seen Figure 14(b) that guide vanes can weaken the secondary flow, which helps to make the flow field uniform and reduce the distortion coefficient of the flow field. Figure 15 shows the dimensionless vorticity (

Secondary flow on different cross sections: (a) S-duct without guide vanes and (b) S-duct with guide vanes.

Vorticity on different cross sections: (a) S-duct without guide vanes and (b) S-duct with guide vanes.
In which,

Selection of A’ on the AIP for S-duct with/without guide vanes: (a) S-duct without guide vanes and (b) S-duct with guide vanes.
It can be seen from Figure 17 that the strength of secondary vortices gradually increases in the streamwise direction, and the strength of secondary vortices is relatively weakened in the S-duct with guide vanes.

Comparison of dimensionless vortex strength.
The distribution of turbulent kinetic energy on different cross sections is shown in Figure 18, from which it can be seen that the turbulent kinetic energy increases gradually in the streamwise direction. Figure 19 shows the change curve of average turbulent kinetic energy for different cross sections versus s/sm, combined with Figure 18(a) and (b), it can be seen that the average turbulent kinetic energy on the cross sections is relatively smaller in the S-duct with guide vanes, which is mainly because the guide vanes weaken the secondary vortex strength and flow separation.

Turbulence kinetic energy contour maps on different cross sections: (a) S-duct without guide vanes and (b) S-duct with guide vanes.

The change of average turbulent kinetic energy with s/sm.
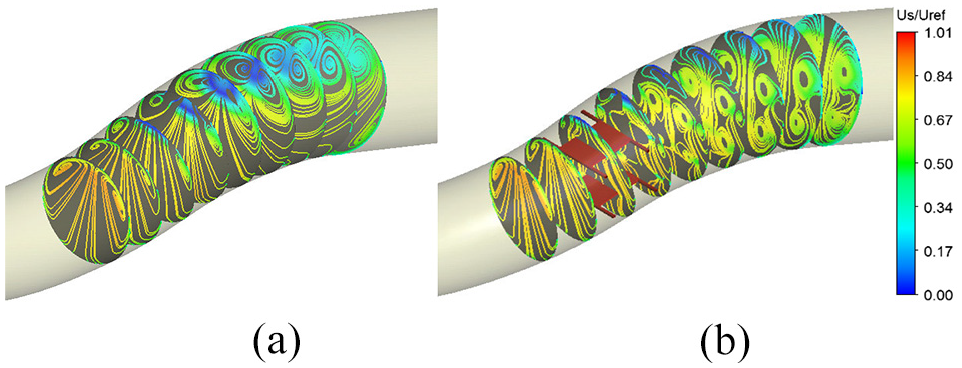
Figure 20 shows the contour map of total pressure distribution on different cross sections for S-duct with/without guide vanes. The three-dimensional streamline is shown in Figure 21. Due to the present of secondary vortices and flow separation, there will be a low pressure area in the upper part of cross section, and the range of low pressure area will gradually increase in streamwise direction. In the S-duct with guide vanes, the range of low pressure area will be smaller.

Total pressure distributions on different cross sections: (a) S-duct without guide vanes and (b) S-duct with guide vanes.

Three dimensional streamline of S-duct with/without guide vanes: (a) S-duct without guide vanes and (b) S-duct with guide vanes.
The variation of total pressure recovery coefficient and distortion coefficient with s/sm is shown in Figure 22. Total pressure recovery coefficient σ and distortion coefficient DC(60) are given by


The change of flow field quality parameters with s/sm: (a) total pressure recovery coefficient, (b) distortion coefficient, (c) relative increment of σ, and (d) Relative increment of DC(60).
In which,
The comparison of total pressure recovery coefficient and distortion coefficient on AIP section is given in Table 2, it can be seen that the total pressure recovery coefficient increases and the distortion coefficient decreases for the S-duct with guide vanes, and the quality of flow field is improved. The total pressure recovery coefficient of AIP section is increased by 0.34%, and the distortion coefficient is decreased by 10.5%.
Comparison of performance parameters (AIP) for S-duct with/without guide vanes.

Conclusions
Based on the detailed analysis of the flow characteristics in S-duct, in order to better improve the flow field quality, a new method adjusting the direction of the main flow by using guide vanes in transition zone is proposed. In order to determine the effect of guide vanes on the flow field, RANS equations are employed to simulate the flow field for a 30°/30° S-duct with/without guide vanes. By comparing the flow field in S-duct with/without guide vanes, the following conclusions can be obtained:
The method adjusting the direction of the main flow by using guide vanes in transition zone is beneficial to improve the quality of flow field. In transition zone of S-duct, guide vanes can not only adjust the direction of the main flow, but also restrain the flow separation, reduce the total pressure loss, increase the diffusivity of the secondary vortex, and decrease the strength of the secondary vortex. For S-duct with guide vanes, due to present of the guide vanes, the total pressure recovery coefficient on the AIP section is increased by 0.34%, and the distortion coefficient is decreased by 10.5%.
In the entrance zone, the main flow in the core zone of S-duct with/without guide vanes are in good agreement with theoretical mode and present potential flow behavior. In the transition zone, the main flow of S-duct without guide vanes deviates from the theoretical model, and the main flow of S-duct with guide vanes is in good agreement with theoretical mode. In the exit zone, both of them deviate from the theoretical model.
Footnotes
Appendix
Handling Editor: Chenhui Liang
Declaration of conflicting interests
The author(s) declared no potential conflicts of interest with respect to the research, authorship, and/or publication of this article.
Funding
The author(s) received no financial support for the research, authorship, and/or publication of this article.