
Abstract
To investigate the causes of damage dispersion in fatigue life of alloy materials, fatigue tests on 42CrMo are carried out under microscope with the aid of a micro fatigue testing device. The fatigue crack initiation and propagation evolution process of 42CrMo are studied on the micromechanical scale. The fatigue short crack and short crack growth rates are measured respectively under loads of 1400, 1550, and 1650 N. The experimental result shows that the initiation of fatigue short cracks is related to the randomness of microstructure defects. The initiation and propagation of fatigue short cracks on the surface of samples are random and local, while the propagation is characterized by first deceleration and then acceleration.
Introduction
The fatigue life and performance of alloy materials have great dispersion. Analyzing the causes of damage dispersion from the macro appearance, it can be considered that dispersion is caused by the random fluctuation of external loads acting on the structure as well as the internality of structural material and processes. However, this explanation is too general to grasp the essence of this problem. The micro fatigue study shows that the fatigue failure process of components includes three stages: crack initiation, propagation, and final instantaneous fracture.1–5 As symbols of fatigue life, crack initiation, crack propagation, and late fracture are controlled by the synergy of inevitability and contingency, among which the crack initiation stage is the main stage strongly affected by contingency factors.6–10 Therefore, in order to explore the essential reason of the dispersion of fatigue properties, it is necessary to study the microdamage mechanism of fatigue short crack initiation and propagation at the stage of crack initiation.11–13 By studying the evolution process of fatigue crack initiation and propagation on the micromechanical scale,14–17 the crack morphology, distribution, and evolution law of short crack initiation and propagation are found.18–20
In order to study the initiation and propagation of cracks at the micromechanical level, a fine fatigue test is carried out directly under a microscope with the help of several micro fatigue testing devices during this paper, aiming at clarifying the micro damage mechanism at the initial stage of fatigue.
Microscope fatigue testing device and technical features
Fatigue failure usually originates from the surface of samples. The micro-fatigue testing device can observe the initiation and propagation of surface cracks in real time at metallographic level and carry out precisely fine fatigue test. The micro fatigue testing technology21,22 has following characteristics: (1) Micro fatigue test is carried out under polarized light microscope with maximum magnification of about 2500 times; (2) At both metallographic and micron level, the changes on the surface during fatigue process, including those of grain and grain boundary, are able to be observed; (3) Through the camera, the whole fatigue process will display on the computer screen; (4) The test can be paused at any time to observe and photograph, also the crack can be kept open under the maximum load to observe, during the whole process researchers can easily search and scan the sample surface to track the fatigue crack propagation.
Microscopic fatigue test sample
The material for micro fatigue test is 42CrMo. The measured chemical composition of the material in wt.% includes: 0.42 C, 0.31 Si, 0.57 Mn, 0.20 Mo, 0.95 Cr, 0.03 P, 0.016 S, 0.105 Cu.
After annealing, the metallographic structure of the material is ferrite and pearlite, with average grain diameter of any orientation. The metallographic structure is shown in Figure 1. The mechanical properties of the material are: Elongation

Original morphology of annealed 42CrMo.
The sample size is shown in Fig.2.For direct observation under the microscope, two small notch of 0.5*0.2 are pre-cut on both sides of the centerline before the test to induce crack initiation at the notches, thus reducing the observation workload. Through pre-grinding, fine grinding and polishing, one side of the surface of the sample can be observed without slip marks under the microscope of micro-fatigue testing machine. Finally, the surface is slightly corroded and polished by 3% nitric acid alcohol solution to show its metallographic morphology, so as to observe the influence of the micro-structure on the initiation and propagation of cracks.

Microscopic fatigue sample size.
Microscopic fatigue test process
Put samples on a fatigue test loading device under a microscope, next, to ensure the stability of the system during loading, the test frequency should be kept at 1 Hz Sine wave loading and stress ratio are carried out in room temperature and air. The fatigue damage of three samples are observed in this test. The loading conditions are shown in Table 1.
Loading state for microscopic fatigue test.

As the test progresses, it is guaranteed that each sample is loaded for 300–1000 times with a shutdown observation. The test process is recorded by a camera installed above the microscope and a computer multimedia system connected to the camera, which enables dynamic observation of the test on a computer screen. After shutdown, the metallographic structure and fatigue cracks are observed under a microscope in static state, and images of interested areas are taken and stored. Through these images, the evolution of initiation and propagation of fatigue short cracks can be conveniently observed.
Microscopic fatigue test results
Short crack initiation stage
The nucleation of fatigue short cracks always originates from resident slip bands, grain boundaries, and inclusions, where short cracks initiate due to stress concentration caused by local plastic deformation indicating that the initiation of short cracks is related to cyclic slip process. Figure 3 illustrates the initiation of fatigue short cracks at the ferrite-pearlite grain boundary. Test shows that crack initiation can be observed at a fatigue life (

Propagation and non-propagating cracks at the initiation stage of fatigue short cracks: (a) N = 2000 cycle, (b) N = 20,000 cycle, (c) N = 22,000 cycle, and (d) N = 25,000 cycle.
The samples go through the first several thousand cycles, with a life fraction of about 10%–20%, while the new cracks continue to merge, but the length of existing short cracks is almost unchanged. Therefore, the short crack initiation stage is characterized by no obvious change in the length of short cracks and an increasing number of cracks increases with fatigue cycles (see Figure 3b).The size of short cracks initiating in this stage is smaller than the average grain size and belongs to Micro-structurally Short Cracks (MSC).
According to the observation results in reverse order, the microstructural defects in the notch of the sample and the short cracks at the machining defects are the most dangerous. Under the alternating load, the short cracks at the notch always propagate first. However, there are some phenomena that need to be paid great attention to: the first short crack (see the upper right crack in Figure 3a for details) has extended to be equivalent to the average grain size
According to the process of short crack initiation in Figure 3, it is found that the growth path of first initiating but becoming non-expanding cracks lies in ferrite grains, and the later initiating but becoming expanding crack propagates along grain boundaries, which indicates that the crack growth of this test material is mainly intergranular during the stage of crack initiation. In the MSC stage, the ferrite grains become the factor hindering crack growth after completing the function of coordinating plastic deformation and releasing deformation stress. Fatigue short cracks which extend between grains in different orientations are more dangerous than those initiating and propagating in ferrite grains, especially those at grain boundaries at the edge of samples. The instability of loading process makes it easy to become propagating cracks.
Short crack growth stage
Figure 4 shows the evolution of propagating short cracks after about 20% fatigue life. Propagating cracks always start at the grain boundaries at the edge of the sample and then extend into the interior of the sample (Figure 4a). At this time, the short cracks propagate first along the grain boundary and retard its growth near the grain boundary. The short cracks that do not propagate along the grain boundaries propagate steadily and slowly in the ferrite grain, which indicates that the crack growth rate and path in the stage of fatigue short crack growth are mainly affected by the grain boundary.

Fatigue short crack growth stage: (a) short crack does not enter ferrite (N = 3000 cycle) and (b) ferrite slip line at short crack tip (N = 5000 cycle).
When short cracks propagate in ferrite grains, there are many small slip lines at the tip of the short crack (Figure 4b). At this time, grain position has an impact on the direction of short crack growth. The number and length of the slip lines in grains have an effect on the growth rate of the short crack. The length of short cracks in this stage is longer than the average grain size of the structure, and the growth rate and direction are obviously affected by the plastic zone at the crack tip, which belongs to the physical short cracks (PSC) stage.
Local dominant crack initiation and propagation stage
During the test, it is found that when the life fraction is more than 40%–50%, the propagation crack length reaches 4
Although the direction of crack propagation is still affected by the microstructure of the material, its degree is already weakened. When the crack reaches the grain boundary, it stops slightly and then enters the next grain. When the cracks approaches but does not enter the ferrite grains, the sliding band extending from grain boundary to intra-grain appears in the ferrite grains, and the number of sliding bands increases correspondent with the fatigue cycles. When the density of the slip band reaches a certain level, the crack propagates into the ferrite grains and rapidly propagates due to the convergence of the slip band (which can be considered as MSC) in the grains (Figure 5). This is the microscopic mechanism by which DLFSC acts as a trans granular extension.
The crack growth rate changed dramatically. Although this test is under constant-amplitude stress loading, the loading device is still often affected by voltage fluctuation and it is difficult to maintain absolute stability. During the test, it is found that the crack growth rate increases greatly during the cyclic period if there are value-added fluctuations (fluctuation range< 100 N) between two shutdowns, which indicates that DLFSC expansion is extremely sensitive to external load changes.
During the DLFSC expansion process, there is little change in the number density of non-propagating cracks in other areas.
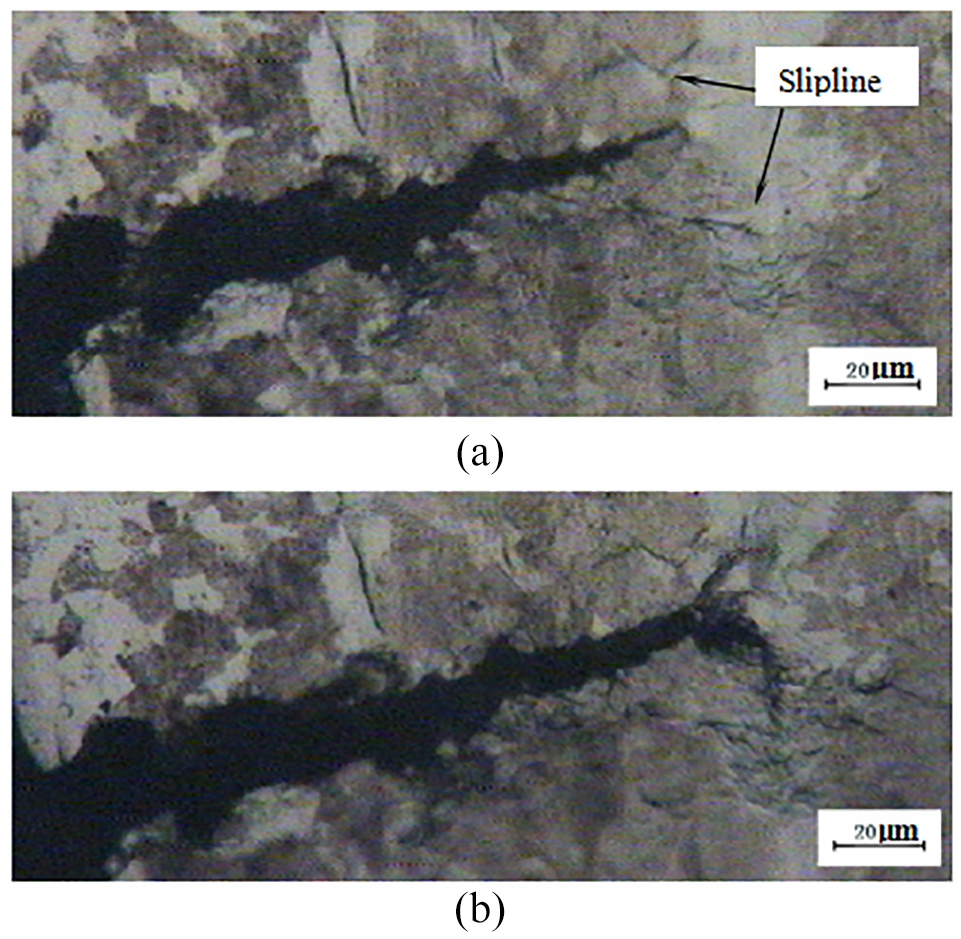
DLFSC growth stage for fatigue short cracks: (a) short crack tip slip line (N = 13,800 cycle) and (b) transgranular growth of short cracks (N = 14,200 cycle).
In summary, during the stage of local dominant crack initiation and propagation, on the one hand, the DLFSC growth is still affected by the microstructure of the material and the density of the number of cracks in the localized region, and its propagation behavior can not be described by LEFM, which conforms to the non-linear behavior characteristics of short fatigue cracks. On the other hand, DLFSC propagates in a certain region, where the density of cracks increases rapidly while the growth of cracks in other regions is inhibited, reflecting the imbalance and localization of short crack evolution process.
Crack growth rate
The technique of measuring fatigue short crack growth rate by replication technique is complicated and inaccurate, so the measurement of fatigue short crack growth rate is always a difficult problem in fatigue research. With a microscopic fatigue test device, very fine fatigue tests can be carried out to measure the length of fatigue short cracks accurately at any number of cycles in the test, thereby determining the fatigue crack growth rate.
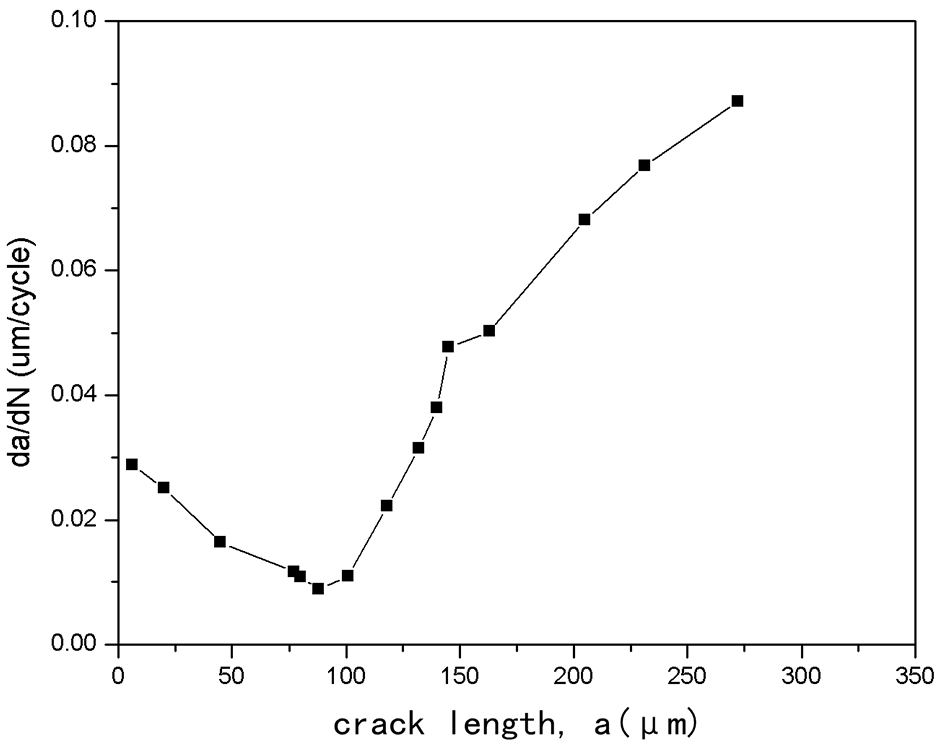
Figures 6–8 are DLFSC (Observed in Reverse Sequence) spreading rate curves of three samples in microscopic fatigue test respectively. From Figures 6–8, it is found that for each stage load level, when the length of DLFSC is very small, the spreading rate is higher; With the increase of crack length, the propagation rate decreases gradually. The rate of expansion then increases again. Therefore, before entering the long crack, the short crack has the characteristics of first decelerating and then accelerating. More specifically, when the load is 1400, 1550, and 1650 N, the initial growth rates of fatigue short cracks are about 0.017, 0.030, and 0.033 μm/cycle respectively, which indicates that the initial growth rate of fatigue short cracks increases with the increase of stress level

Short crack growth rate curve at 1400 N load.
Short crack growth rate curve at 1550 N load.

Short crack growth rate curve at load 1650 N.
The initiation and propagation of short fatigue cracks on the surface of samples is observed by micro-fatigue test. The initiation of short fatigue cracks is characterized by randomness and localization. Firstly, a certain number of short fatigue cracks are formed at the initial stage of damage during the initiation of short fatigue cracks, including grain boundary defects and grains with slip lines. At this time, there is almost no connection between cracks. The nucleation and propagation of short fatigue cracks are independent. The damage degree of short fatigue cracks can be described by an ideal short crack system evolution model 23 for damage concentration and sparse damage areas. However, this model can only reflect the ideal situation in the early stage of short crack evolution. According to the results of the micro-fatigue test, the evolution of short crack is not characterized by ideal crack but dominant crack with obvious local evolution from the whole process of short crack evolution.
The fatigue short crack growth process is also random due to the randomness of local microstructure. Therefore, the deterministic formula of fatigue short crack propagation rate in Xu and Wu
23
is modified, and the random function
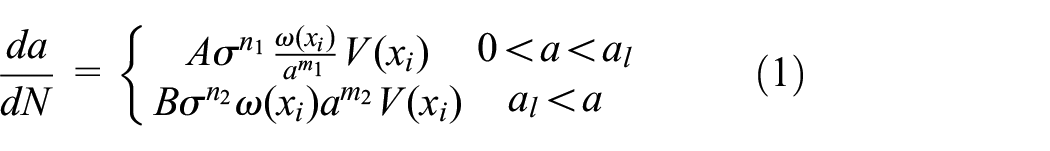
In this formula,
The local damage randomness factor
Conclusion
The dynamic microscopic fatigue test of 42CrMo is carried out by means of a microscopic fatigue testing system. The initiation, propagation, and evolution process of fatigue short crack are directly observed and accurately recorded, and the growth rate of fatigue short crack is measured, which proves that the growth of fatigue short crack has the characteristics of deceleration at first and then acceleration.
The initiation and propagation of fatigue short cracks on the surface of samples are random and localized. The initiation of fatigue short cracks is related to the randomness of microstructure defects. The first initiated fatigue short cracks may stop growing in the middle when encountering stable grains, and the later initiated short cracks eventually develop into DLFSC. Cracks are sparse in the area far from the plastic influence area of the crack tip of DLFSC. The crack tip of DLFSC destroys the stability of grains, thus forming a plastic influence zone with a large number of MSCs, The DLFSC propagates not only through self-expansion but also its convergence with MSC.
Footnotes
Handling Editor: Chenhui Liang
Declaration of conflicting interests
The author(s) declared no potential conflicts of interest with respect to the research, authorship, and/or publication of this article.
Funding
The author(s) received no financial support for the research, authorship, and/or publication of this article.