
Abstract
Recently, condition monitoring methods using the sound of the machine have attracted attention. Since approaching high voltage equipment increases the risk of electrocuting, non-contact data acquisition is desirable. Most of the research targets of acoustic monitoring are rotating machines and it is not clear whether it is effective for machines that switch between two states, such as contactors and circuit breakers. In this work, several investigations have been carried out on the acoustic condition monitoring of contactor. The Mel-frequency cepstrum coefficients (MFCCs) were obtained from the sound data of the contactors under normal and simulated fault conditions. Support Vector Machine (SVM) was trained with MFCCs and found that it could detect and diagnose contactor faults with high accuracy.
Introduction
Background
Contactors, switches and circuit breakers are used in Japan’s high-speed railways and in power distribution networks around the world, and the failure of these equipment can be significant. Therefore, many of the facilities are designed redundantly and carefully maintained to ensure safety. However, despite all of costs and efforts, accidents due to equipment failure do occur. In 2007, a circuit breaker at a substation burned out due to insulation degradation over time, causing a blackout of the surrounding high voltage distribution network for approximately 1.5 h in Osaka, Japan. 1 Similar accident was also happened in 2019 and 2020, causing a total of 4.5 h of blackout. 2 In 2012, a fire broke out in a substation in the USA due to a ground fault caused by degraded contacts in a circuit breaker. 3
Contactors are electric power devices that open and close the circuit, either when there is no current flowing or when the rated current is flowing. However, these devices alone cannot cut off an accidental current more significant than the rated current, for example such as those occurring in the event of a short circuit or earth fault. Unlike a circuit breaker, contactor does not cut off an accidental current, but it has a high durability for opening and closing operation. Both contactor and circuit breaker have a moving electrode, which engages with or detaches from the fixed electrode to connect or disconnect the circuit. Both mechanical structure is similar, but the circuit breaker has a mechanism to extinguish the arc and so can cut off an accidental current, whereas contactors are designed for repeated operation.
Contactors are widely used in places where circuits are frequently switched on and off, such as blast furnaces in steel mills and power factor correction capacitors in high-voltage distribution networks. In the field of railways, they are used in the changeover section of the Japanese bullet trains and the opening and closing of the propulsion coils of Maglev trains.4,5 Due to the high frequency of operation, mechanical failures are the most frequent faults. According to an international study more than 70,000 circuit breakers in use in 22 countries has shown that 54.4% of severe failures and 49.3% of minor failures are due to mechanical causes. 6 Another study more than 281,000 circuit breakers in use in 26 countries has shown that 50% of major failures are related to mechanical problem. 7
Since the contactor failure has a significant impact on the distribution system and train operation, maintenance is carried out according to a periodic maintenance cycle. However, this maintenance cycle is based on the worst condition of the contactor, which may lead to excessive maintenance. In recent years, condition monitoring technology has been attracting attention for efficient maintenance. This technology enables the monitoring of the equipment’s condition by using sensors to the equipment. It allows the maintenance to be performed only on the equipment that needs it. A wide range of research has been carried out on condition monitoring of circuit breakers and contactors, largely utilizing voltage, current, and vibration analysis techniques.8–15 These approaches, however, require direct access to the systems being monitored, which presents a safety risk, and the nature of the environment means that the risk of sensor failures is also increased.
A basic principle of monitoring is that sensors should be installed in such a way that they do not affect the functionality of the equipment being monitored. Voltage sensors, load sensors, displacement sensors, etc. need to be attached directly to the high voltage circuit or mechanical portion of the equipment. Should a sensor fail, it is therefore possible for it to adversely affect the functionality of the equipment, or even cause significant damage. According to a report by Ministry of Economy, Trade and Industry Japan, 69 measurement sensor incidents have occurred in the central region of Japan since 1986. 2
Additionally, current and voltage sensors, Acoustic Emission (AE) and vibration sensors, etc. need to be mounted directly on or very close to the equipment. Contactors operate at high voltages, and as such fitting and obtaining data from such sensors presents a risk to personnel. East Japan Railway Company reported seven people have been lost due to electric shocks since 1986. 16
Since attaching sensors directly or approaching to high voltage equipment poses a certain risk, a method of collecting data from some distance away is desirable. Acoustic monitoring is attracting attention because the data can be measured non-contact and at a certain distance. Furthermore, it may enable low-cost maintenance by monitoring several pieces of equipment from a single sensor.
Considerable research has been undertaken using acoustic monitoring technology to detect axle bearing failures, however there are few applications of it to contactors. 17 Many rotating machines operate at a constant speed and produce periodic vibrations when an abnormality occurs. In many previous studies, this vibration is used for fault detection and diagnosis. Reciprocating machines such as contactors, which operate non-continuously, do not exhibit the repetitive characteristics in their data, and it is therefore necessary to extract characteristics different from those conventional methods.
Related studies
It is known that rotating machinery failures can cause periodic noise, for example in bearing and axle failures. A major issue in the previous research is how to extract the anomalous noise from the background noise. Although there are few acoustic monitoring studies for single throw mechanical equipment (STME). 16 STME is a type of equipment that switches two states of the equipment by control signals. Point machines, contactors, circuit breakers, and doors are examples of STMEs. It is expected that in the initial failure of STMEs, the components will be damaged or deformed, and the balance of the force on the components transmitted to each component will be disrupted. With this, it is expected that it will be possible to detect the failure from the acoustic data if the occurrence of unusual sounds, changes in frequency, intensity, and length of the sound. Most of the studies into condition monitoring by sound have been carried out on rotating machines, while few have been carried out on reciprocating machines such as contactors and circuit breakers. On the other hand, the vibration data analysis for circuit breakers has been widely studied. Since sound is a vibration conducted through the air, vibration analysis methods can also be applied to sound data analysis.
Hou et al. 17 proposed a fault diagnosis method for a 12 kV circuit breaker. The method calculates the wavelet packet energy of the vibration and acoustic signals of the circuit breaker. It classifies them using Support Vector Machine (SVM) using the wavelet packet energy relative entropy as an input vector. In their work, they obtained 30 data of normal and 2 failures (insufficient lubrication of the crank arm, mechanism fall off in moving). Three data of each state were used as training data, and the remaining 21 data were used for validation. The results show that the combination of vibration and acoustic data can detect abnormalities with an accuracy of more than 90%. Although the classification accuracy of this study is high, only 10 data were obtained for each, and the number of data needs to be increased to check the generality.
Huang et al. 18 proposed a method to extract the EMD energy entropy from the vibration data of a 72.5 kV SF6 gas circuit breaker and to classify the feature data using a multi-layered SVM. In this verification, the following failures were considered: “loosing the base screw,”“invalid overtravel of the buffer spring,” and “time-delay vibration event caused by the inadequate lubrication for the operating mechanism.” Twenty-five data for each failure, and 25 normal data were collected. To demonstrate the effectiveness of EMD and SVM, several features and classifiers were combined, and their accuracy compared. The characteristics used were EMD, and wavelet packet transform energy entropy (WPT), and the classifiers were SVM and back-propagation network (BPN). The combination of EMD and SVM were shown to have a classification accuracy of 95% for all faults. Huang et al. 19 proposed a fault diagnosis method using variational mode decomposition (VMD) and a multi-layered SVM for circuit breaker vibration data. They proposed a fault diagnosis method using VMD and multi-layered SVMs for three faults: (1) jam fault of the iron core, (2) looseness of the base, and (3) insufficient lubrication of the connecting lever. The characteristic data are extracted from the vibration of the circuit breaker. Twenty data of each failure and normal were used for training, and 20 data were used for validation. The results showed that the classification accuracy was 100% when using multi-layered SVM. They also validated the anomaly detection for new faults that were not in the training data. When the classifier was not trained on the connecting lever’s lubrication failure, the single SVM could not determine the failure. Still, the multilayer SVM could detect and diagnose the fault as unknown fault with 100% accuracy. In actual condition monitoring, it may be difficult to obtain all types of fault data in advance, and unexpected faults may occur, therefore the ability to detect and diagnose unknown faults can be say very practical.
Yang et al. 21 proposed a fault classification method for 12 kV circuit breakers. The Morphological Correlation Coefficient (MCC) was used to detect faults, and the ensemble empirical mode decomposition Hilbert marginal spectrum energy entropy (EEMD-HMSEE) obtained from vibration data was used to train the SVM for classification. Normal data and three simulated faults, Oil Damper Failure (ODF), Operating Mechanism Jamming (OMJ), and Insulation Rod Loosening (IRL), were taken 50 each, and 60% were used for training and 40% for validation. In the validation, EMD-HMSEE-SVM using EMD as a feature and EEMD-HMSEE-KNN using KNN as a classifier were also validated and it was found proposed method accuracy was the best for classification. In order to validate the practicality of the proposed method, five data were obtained from three circuit breakers of the same type in actual use. Obtained data were analyzed by the same method and actual fault of ODF was found by this analysis. The verification also found a fault that was not investigated in the laboratory (loosening of the transmission shaft). Furthermore, 20 data were obtained from each phase of different types of 252 kV circuit breakers and analyzed by the same method. As a result, it was found that the fault of OM occurred in one phase. These results showed that the proposed method is practical for several types of circuit breakers.
Methodology
Feature extraction method
Sound data contains a lot of redundant information, and it takes a lot of computation to analyze it. Using feature extraction, it is possible to extract useful feature vectors from the data, which reduces the dimensionality of the data and reduces the computational complexity. In this study, Mel-frequency cepstrum coefficients (MFCCs) widely used in speech recognition are applied to extract features from the sound data. MFCCs have previously been also used to detect abnormalities in railway equipment. Lee et al. proposed a method to extract MFCCs from the sound of a point machine and classify them using a multilayer SVM. This method has been shown to detect faults with an accuracy of 94.1%. When only the fault data were classified, the method was able to classify them with 97.0% accuracy. 20 The following procedure obtains the MFCCs.
Emphasize the high-frequency components of the waveform by using a pre-emphasis filter.
Calculate the amplitude spectrum by FFT after applying the window function.
Compress the amplitude spectrum by applying a Mel filter bank.
Consider the above-compressed sequence of numbers as a signal and perform a discrete cosine transform.
Obtain the lower-order components of the obtained cepstrum.
The low-dimensional component of the cepstrum obtained above is the MFCCs. Since the power of sound attenuates in the higher frequencies, high-frequency enhancement is used to compensate for this. For discontinuous data, a window function is used to attenuate the two ends of the waveform. The power spectrum is used because the sound’s magnitude (the frequency to be emphasized) changes with the phonetic difference.
Suppose the dimensionality of the MFCC is increased. In that case, the more delicate components of the Mel frequency spectral envelope can be represented. Still, the dimensionality of the feature vector increases, so MFCCs with less than 20 dimensions20–23 or MFCCs and logarithmic energy are often used. 24 The MFCCs and its time-varying component Delta MFCCs, and also the time-varying component of Delta MFCCs, Delta delta MFCCs, are sometimes used.23,25–27 Nelwamondo et al. 28 tested the accuracy of bearing failure detection by varying the number of MFCCs. The results showed that 13 MFCCs was optimal for failure detection. In this analysis, the number of MFCCs was set to 13, hamming window was used for 30 ms window frame, and an overlap length was set to 20 ms.
Classification method
Support Vector Machine (SVM) is a supervised machine learning method for pattern identification based on Vapnik’s statistical learning theory. 29 It can be used for both classification and regression, but it is mostly used for classification tasks. It is a fast and reliable classification algorithm and is expected to perform well with a small amount of data. In recent years, artificial neural networks (ANNs) have also attracted attention for their high accuracy. Still, ANNs require a large amount of data to predict the response accurately and need a lot of time and computational resources to adjust the parameters. In addition, the complexity of the classification method makes it difficult to understand intuitively why the data has been classified. The SVM has an advantage in this respect because of the simplicity of the classification method.
SVM creates a decision function to classify data from training sets

In SVM, the classification boundary is set so that the distance called margin between each class across the classification boundary is the largest. Therefore, SVM can be treated as the following optimization problem. C is called the regularization parameter and was set to 1.0 in this work

Multi-classification method
SVM is essentially a learning method for binary classification. To construct a multi-class classifier, several SVMs of this form can be combined. In this work the one versus one (OvO) method was used for classification of multiple classes. This reduces the problem of classification with several classes to a set of binary classification problems. In the OvO method, only the data belonging to class i and class j are extracted, and SVM classification learning is performed. This method constructs
Since the operating sound of contactors varies with time, the time-varying data obtained by MFCC was used as training data for the SVM. This makes it possible to detect not only abnormal sounds caused by faults but also sound deviations and differences in sound transitions. In the case of a mechanical fault of the contactor, or of a lack of grease, it is expected that the balance of the parts is lost, and the shift of the operating sound and the transition appear. Hence, fault detection by this method is expected.
Field experiment
To check whether mechanical faults can be classified by operating sound, tests were conducted using 6.6 kV contactors. The structure of the contactor is shown in Figure 1. The contactor has two moving parts, one at the top and the other at the bottom. The electrode connected to the moving part engage with to and detach from the fixed electrode to connect and disconnect the circuit. Figure 2 shows the movement of the components when the contactor is closed and opened. The following procedure switches on and off the contactor.
The plunger is accelerated by the current flowing through the closing (solenoid) coil. This causes the upper and lower moving parts to move downwards and upwards.
The opening springs are shortened, and the moving contact (electrode) contacts the fixed contact, thus forming a circuit.
After the circuit is formed, the current flows through the holding coil, which attracts the plunger and continues to form the circuit.
The holding coil’s current is stopped, and the opening spring force returns the moving part to its original position.

The structure of the contactor.

Contactor components movement through opening and closing.
This mechanism is designed to ensure that the circuit is safely opened in a failure such as a power failure.
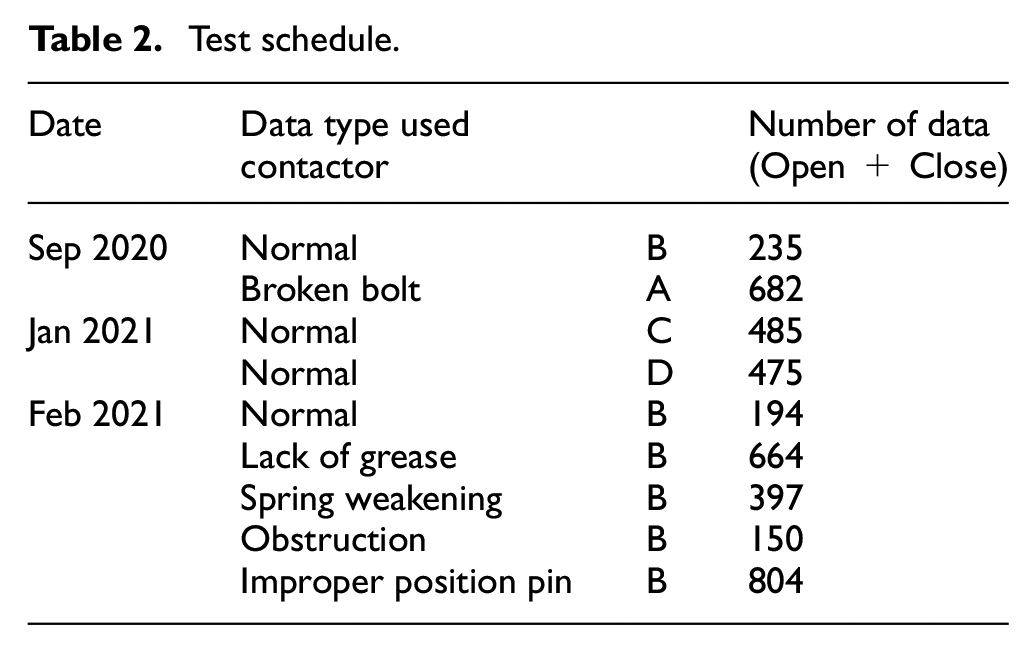
In the test, three normal contactors and one damaged contactor were used. The damaged contactor (contactor A) has a broken bolt in the lower moving part, although it can be opened and closed. All contactors were installed in the same cabinet. Two microphones were used for data collection and microphone positions are shown in Figures 3 and 4. Normal data was obtained from contactor B, C, and D and fault data was obtained from the damaged contactor A. Multiple simulated fault (Lack of grease, Spring weakening, Obstruction, and Improper position pin) data were also obtained from contactor B. Table 1 shows the measuring equipment used. Since the contactors were installed inside the panel, one microphone (microphone1) was placed in front of the contactor outside the panel, and one microphone (microphone2) was placed next to the contactor inside the panel. Two acceleration sensors were installed, one for each of the upper and lower closing coils, and four current sensors were installed to measure the closing and holding current of the upper and lower coils.
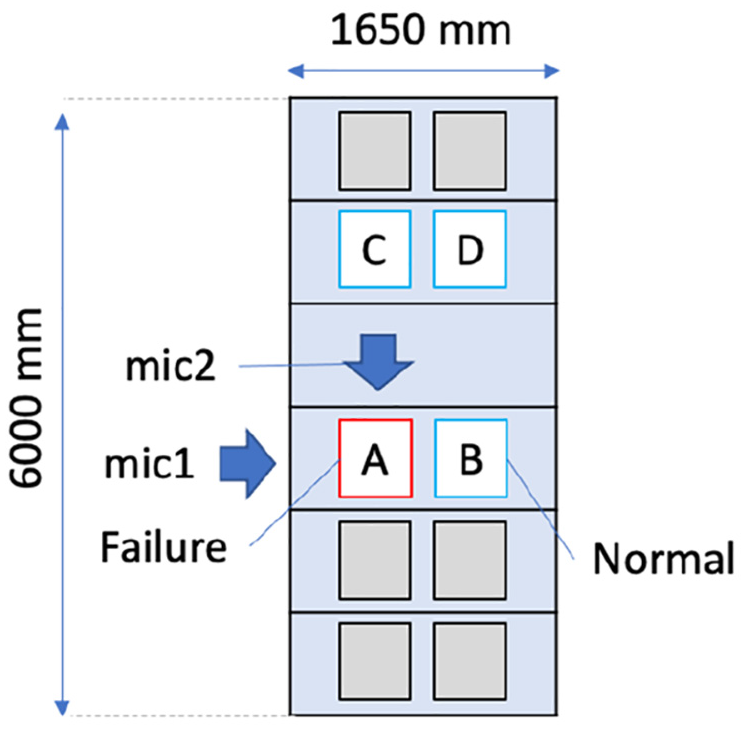
Location of measuring equipment and contactors.
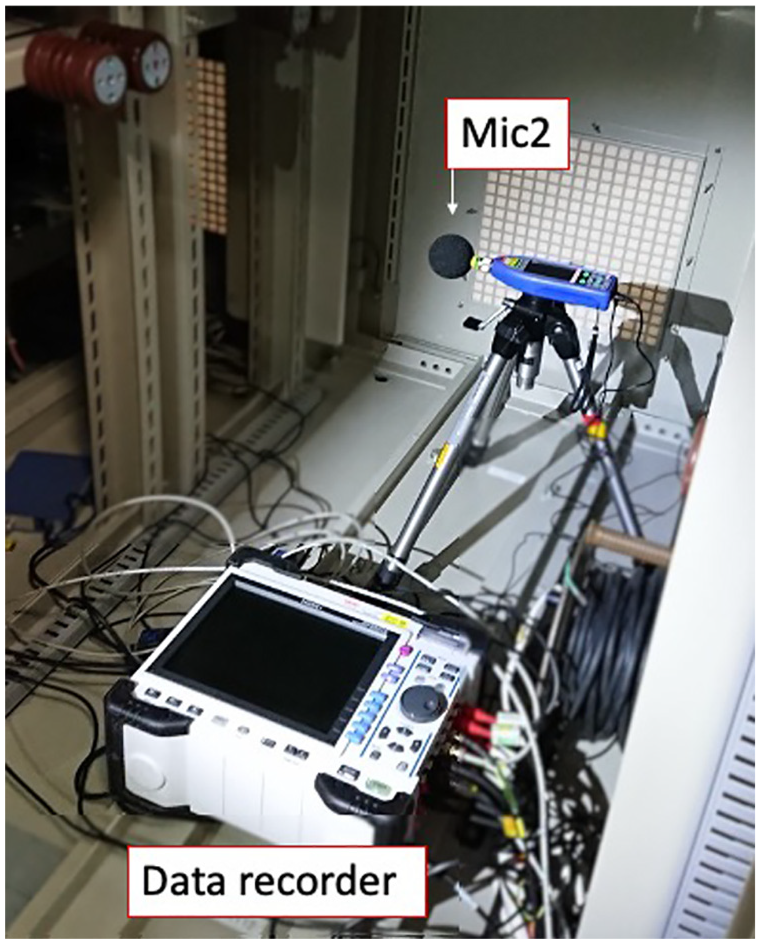
Measuring equipment.
Measuring equipment.

The damaged contactor was used and destroyed in an endurance test carried out in the past to check its durability. Periodic maintenance was carried out every 60,000 cycles in the test, and after 1.8 million cycles, the bolt leading to the bottom moving part was found to be broken. The structures of the normal and damaged contactor used are shown in Figure 5. In the damaged contactor, the bolt connecting the bottom plunger and the moving part was broken. The system continued to operate despite the plunger and moving part being separated from each other as the accelerating plunger would contact the moving part to carry it upward. When released, the components would fall separately.

The structure of normal and damaged contactor.
Mechanisms for simulating each fault is shown in Figures 6 to 9. In simulated fault 1 (Lack of grease), the grease applied to the sliding parts of the contactor was removed. The greased areas are highlighted in Figure 6. In simulated fault 2 (Spring weakening), a weakening of the opening spring was simulated. If the spring is used frequently, it is expected that the spring will compress over time, and the force will weaken. To shorten the spring, a tape was applied between the fixed part and the damper. The thickness of the tape was varied between 1, 3, 5, and 20 mm, and the data for each case were obtained. In this simulated fault, the motion of closing is the same as that of the actual fault, but the motion of opening is different from that of the actual fault. In the actual fault, when the moving part is released, it moves up and down repeatedly beyond the initial position due to the spring force, and then gradually decays and returns to the initial position. However, in the case of the simulated fault, the moving part does not move up and down when it returns to the initial position because the tape is attached, and the speed instantly becomes zero and the moving part stops at the initial position. For this reason, only closing data was used in the verification. In simulated fault 3 (Obstruction), objects were placed between the moving contact and the fixed contact. The placed objects were a piece of cloth (1 mm thick), a piece of tape (1 mm thick), a piece of rubber (5 mm thick), and a piece of wood (20 mm thick). In the case of simulated fault 4 (Improper position pin), the pin connecting the coil plunger to the moving part was displaced from its proper position. Even if the pin was displaced, the contactor could be opened and closed.

Simulated fault 1: Lack of grease.
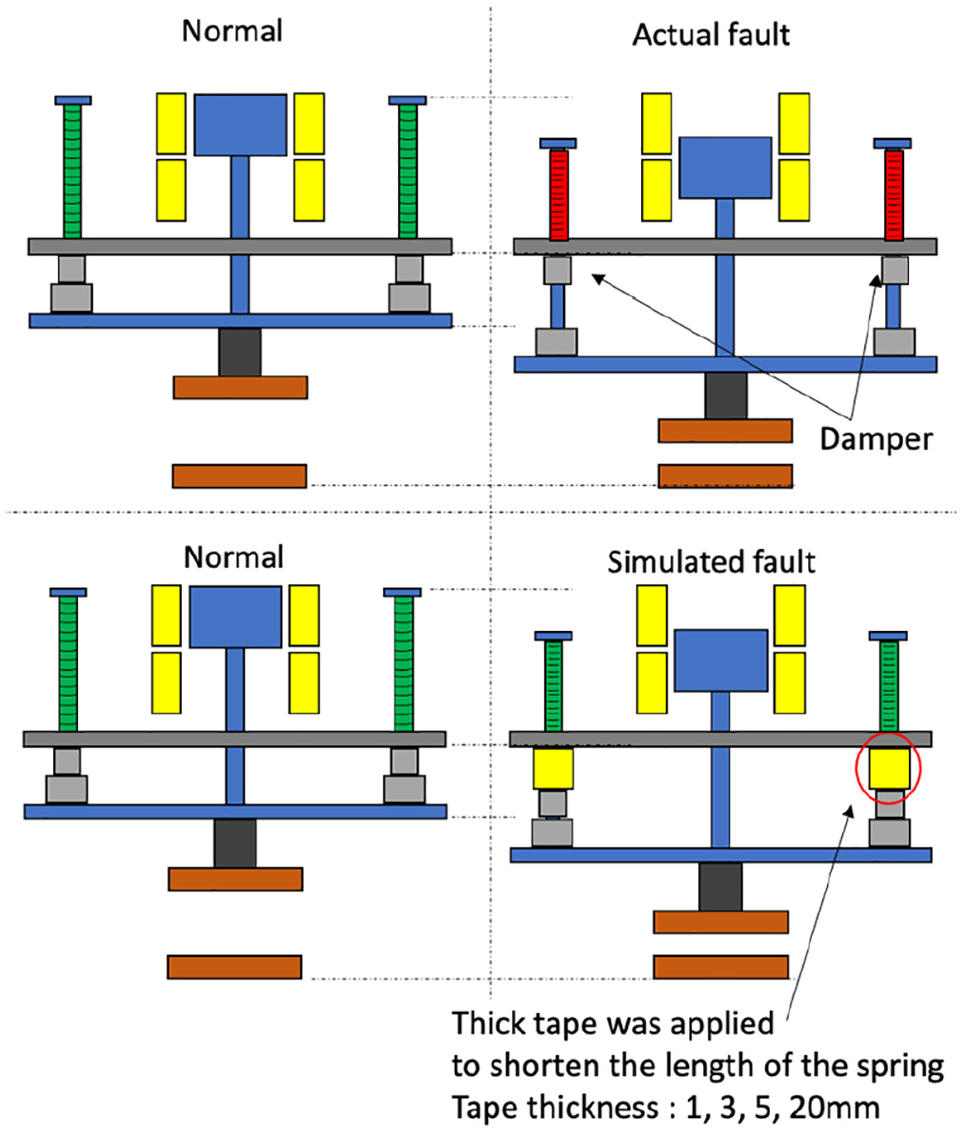
Simulated fault 2: Spring weakening.

Simulated fault 3: Obstruction.

Simulated fault 4: Improper position pin.
Examples of time domain representations and power spectrogram for both healthy and faulty signals are shown in Figures 10 and 11. The fault data of broken bolt, lack of grease, and obstruction have an observable abnormal sound before the blade impact. There is no significant difference in the other fault data, compared to the healthy case, observable using these representations.

Each data signal.
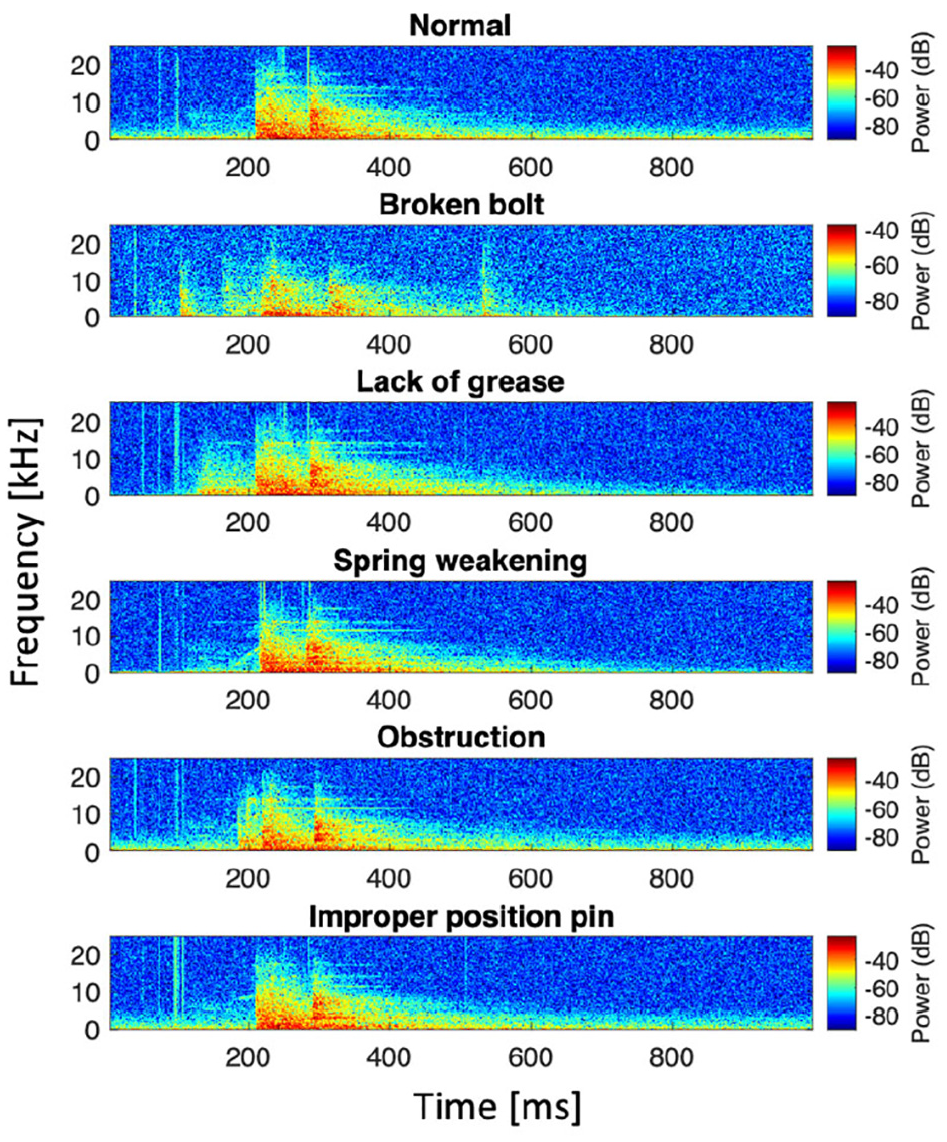
Power spectrogram of each data.
The data were acquired once every 7 s. Test schedule is shown in Table 2. Each data was collected for 1 s from 0.05 s before the control voltage exceeded 50 V. Data were obtained for each switching on and off. In the building where the contactor was installed, other equipment than the contactor was also installed, and the pump for cooling run irregularly, so some of the data includes the sound of those machines. The interference loudness was over 75 dB.
Test schedule.
Analysis
Classification accuracy
The classification algorithm used in this experiment is shown in Figure 12. The data obtained in this experiment was divided by k-fold-cross-validation, and two-thirds of the data was used for training and one-third for validation. The MFCCs were calculated and used by the SVM, and the resulting classification model was used to classify the validation data.

The algorithm for detecting failures from acoustic data.
A measure called the recall was used for verification. Recall is the percentage of fault data that are correctly predicted as fault. It is expressed by the following equation using True Positive (TP) and False Negative (FN). The fault detection accuracy is expressed using TP, FN, True Negative (TN), and False Positive (FP). The relationship between TP, TN, FP, and FN is shown in Table 3 as a confusion matrix.


Confusion matrix.
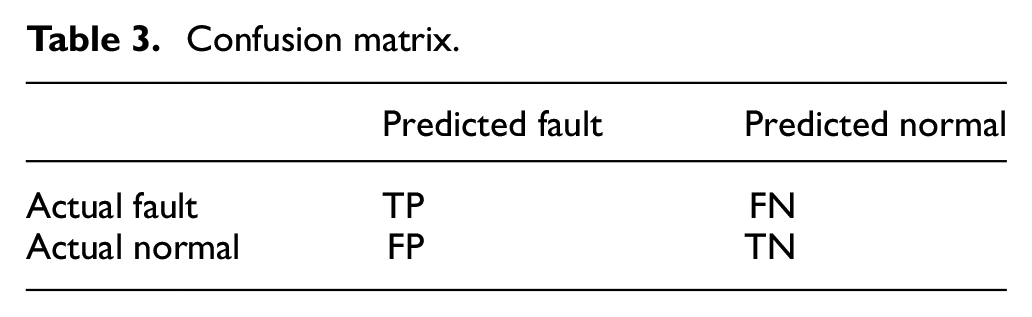
FP is a diagnosis of a fault, even though the equipment is normal. The equipment is fine and there is no risk of an accident, but the more FPs there are, the less confidence the maintenance engineers have in the system. FN means that faults are missed, increasing the probability of accidents. In the railway field, this is known as a wrong side failure.30,31 Since industrial machines rarely break, there are more normal data than fault data. If there is a lot of normal data, and the number of correct answers of normal data (TN) is large, the accuracy will become high. However, the most important thing is not to miss any faults when considering condition monitoring of industrial machines as the damage caused by a failure is significant. TP and FN is more important than TN, therefore, in the condition monitoring of industrial machines, fault detection model should be evaluated by recall.
Table 4 shows the average number of TP, FP, TN, and FN, and recall for each fault. It is clear from the table that the recall is high for all faults. Comparing the results of microphone 1 and microphone 2, it was found that the recall of microphone 2 installed inside the panel was higher than that of microphone 1. This may be because the data from microphone 1, which was located outside the panel, contained greater levels of noise, such as that arising from the cooling pump. However, since the recall of microphone 1 was also high enough (more than 95%), the influence of noise on the detecting faults seems to be small.
Recall of the fault detection.

Figure 13 shows the diagnostic results of the data. It is revealed that most of the data are accurately diagnosed. However, some data corresponding to the lack of grease and spring weakening faults are classified as normal, suggesting that the operating sound of these faults may be similar to the normal. On the other hand, for broken bolt and improper position pin, the diagnostic accuracy is 100%, suggesting a clear difference in the operating sound. In this study, each operation data was verified one by one. Since the fault of spring weakening and lack of grease progresses gradually, it is highly likely that the data before and after the verification target are also fault data. A higher fault detection accuracy can be expected by verifying multiple data (three to five operations) instead of diagnosing data one by one.

Diagnostic results.
Conclusion
In this work, MFCCs were extracted from the contactor’s operating sound and used to train the SVM. When the trained model was used with the validation data, it was found to classify and diagnose faults with high accuracy. Experiments and analysis carried out have shown that this fault detection and diagnosis algorithm applied to acoustic data is effective for contactors. More detailed analysis is needed to clarify the characteristics and similarities of the sounds and the effects of microphone locations.
Future work
This work showed that it was possible to detect and diagnose contactor faults with a high accuracy using operating sound. In the future, the transferability of the fault detection model will be investigated by obtaining same simulated fault data from multiple contactors.
Footnotes
Handling Editor: Chenhui Liang
Declaration of conflicting interests
The author(s) declared no potential conflicts of interest with respect to the research, authorship, and/or publication of this article.
Funding
The author(s) disclosed receipt of the following financial support for the research, authorship, and/or publication of this article: K. Inoue is grateful to the Central Japan Railway Company Limited for the provision of a PhD research student scholarship at the University of Birmingham.