
Abstract
Natural cortical bone is an important source of bionic bone repair materials. Sawing cortical bone is the first and important process in fabrication bone repair materials. However, the high sawing temperature could cause damage to bone tissue and nerves, and surface roughness should decrease osteoinductivity. In order to improve the cutting performance during sawing cortical bone, and the quality of prepared cortical bone slices, the band sawing process should be investigated and improved. In this paper, the novel cortical bone sawing experiment was designed with different feed rate and tooth pitch. Then, the influence of experimental parameters on temperature and roughness were analyzed with Analysis of Variance (ANOVA). The experimental results show that the lowest value of temperature is 35.5°C (tooth pitch is 8.46 mm, feed rate is 35 mm/s), the highest one is 73.8°C (tooth pitch is 4.20 mm, feed rate is 5 mm/s). And the turning point of surface roughness appear when the feed rate is 20 mm/s. Otherwise, the prediction model of sawing temperature and surface roughness could help to find optimal band sawing parameters of natural cortical bone.
Introduction
Bone repair material is one of the most clinically demanded biomedical materials. By imitating the composition, structural characteristics and biomineralization process of natural bone itself, a new type of bionic artificial bone repair material based on natural cortical bone can be obtained, which have brought the new hope for orthopedist and the bone damage patient. 1 Among them, cortical bone of bovine femur has become an important source of biomimetic bone repair materials, especially as an important method for the study of fracture healing and bone defect repair, since the distribution of constituents is very similar to the human bone.2,3 Animal cortical bone bandsawing is the first and important process in fabrication bone repair materials. However, the cortical bone is a brittle material with high density, strength and anisotropy, and mainly consists of osteons (fibers) and interstitial lamellae (matrix).4,5 Therefore, the process of bone cutting can cause severe thermal damage to the bone tissue.6–13 Meanwhile, the bone surface damage caused by brittle fracture will affect the integrity of bone tissue.14–17 Nevertheless, bone damage is closely related to processing parameters. Therefore, selecting suitable band sawing parameters is the key to control the quality of the bone repair materials.
In recent years, several studies focus on the effect of sawing parameters. Yan et al. 18 studied the influence of wire sawing parameters on bone material removal, cutting force, temperature, and bone surface quality. And the results show that better performance is achievable at higher wire speeds. To analysis the influence of circular sawing parameters on numbers of aerosol particles produced. Pluim et al. 19 explored the potential effects of saw blade frequency and saw blade contact load on the number and size of airborne bone particles produced. To compare the effect of fluid on sawing heat in knee surgery. So Tawy et al. 20 compared oscillating saws to burrs in terms of temperature generation and histological damage. Use of irrigation to reduce bone temperature was also investigated. On average, burring produced higher temperatures than sawing (p < 0.001). When uncooled irrigation was used, bone temperatures were significantly lower in sawed bone than in burred bone (p < 0.001). Irrigation lowered temperatures and thermal damage depths, and increased osteocyte viability (p < 0.001). These results suggest that irrigating bone during resection could prevent osteonecrosis onset.
In order to analysis the influence of bone-sawing parameters on cutting force in orthognathic surgery. Yanping et al. 21 developed a VR training simulator with haptic functions to simulate hone-sawing force, which was generated by the experimental force model. Using a 5-DOF machining center and a microreciprocating saw, hone specimens with different bone density were sawed at different feed rates (20, 40) and spindle speeds (9800, 11,200, and 12,600 cycles/min). Linear correlation analysis of all experimental data indicates that there were significant positive linear correlations between bone-sawing force and bone density and tool feed rale and a moderate negative linear correlation with tool spindle rate. To study the effect of blade speed and applied thrust force on the volumetric cutting rate of bone cement. James et al. 22 researched on the mechanics of bone cement removal by a reciprocating sawing process. A custom reciprocating saw with variable stroke length was used to conduct a three factor Design of Experiments. The results demonstrate a linear relationship between both force and cutting rate, and blade speed and cutting rate. A cutting rate model was developed by regression analysis of the experimental data.
According to the above mentioned literature, most of the researchers have investigated the effect of bone drilling, bone milling, and bone turning on bone injury. A few studies have used diamond wire saws, circular saw blades, and reciprocating saw blades to cut cortical bone, and in these studies, the effect of processing parameters have been evaluated on bone injury parameters such as cutting forces, cutting temperature, bone surface roughness, and the number of aerosol particles. To the best of authors knowledge, there hasn’t been any work concerning the effect of sawing parameters on bone injury during using a metal band saw blade to saw cortical bone. And metal band saw blades are the high-efficiency precision sawing tools for preparing bone repair materials. Hence, the effect of band sawing parameters on sawing temperature and surface roughness is still valuable to research and discuss. In this paper, the novel band sawing experiment was designed to investigate the effects of feed rate and tooth pitch on temperature and roughness. And then, a prediction model for sawing temperature and bone surface roughness were established based on the experimental results. The optimal band sawing parameters of cortical bone could be also evaluated with these models.
Methods
Sample preparation
In this paper, the cortical bone sample was prepared from bovine bone of the age of 2–3 years and obtained for the axial direction. The size of the prepared samples was (a) 100 mm × (b) 20 mm × (c) 4 mm, as shown in Figure 1. It should be noted that the thickness of sample is only 4 mm, which can ensure single-tooth sawing at arbitrarily time. Before the experiment, samples were immersed in a normal saline solution and stored in a refrigerator at a temperature of −85°C. It should be stated that no statistically significant differences could be found in mechanical properties of cortical bone when compare frozen bones to fresh ones. 23

Bone material sample; a mean length of the sample; b mean width of the sample; c mean height of the sample.
Sawing experimental set-up
In this paper, the effect of band sawing parameters was studied on a homemade experimental apparatus. As shown in Figure 2, a band sawing machine (LELOCLE) with a two-axis stage is the main part of the experimental equipment. And other instruments are the infrared thermal imager (Flir-E50), a three-dimensional force acquisition system (ME-K3D120), and a roughness measuring instrument (SJ-210). Among them, the cortical bone sample is fixed on the three-dimensional force sensor. Meanwhile, during each process, the monitor computer can gain timely sensor data of sawing force, and the thermal imager can record the temperature data of sawing zone, simultaneously.

Experimental set up of sawing process; θ mean back angle; γ mean rank angle; TPI mean tooth pitch.
In this experiment, three different tooth pitch of bandsaw blade have been compared at the same work condition. The material for bandsaw blade is stainless steel of medical grade. The main parameters are as follows, tooth pitch TPI 8.46 mm (S1), 6.35 mm (S2), 4.20 (S3); Circumference 1650 mm; thickness 0.56 mm; width 16 mm; rake angle γ: 9°; back angle θ: 30°; left and right deflection angle α: 5°.
Experimental design
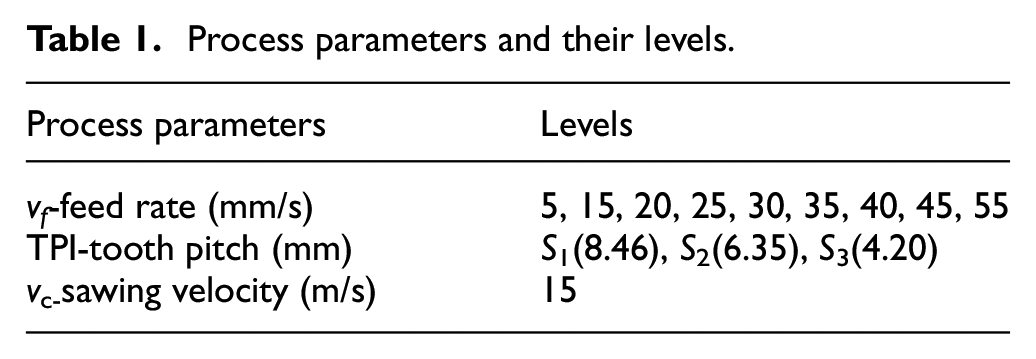
The experimental procedure was designed to investigate how tooth pitch and feed rate affect the sawing temperature and bone surface roughness during cortical bone sawing. These parameters were varied in three and nine levels as given in Table 1. Also, the sawing velocity was set equal to 15 m/s for all sawing tests. The sawing velocity was selected according to the date commonly used in literature as well as the limitations of the sawing machine. The experiments were performed based on full factorial design in order to investigate all probable combinations of process parameters and their levels. To ensure accuracy, each set of experiments was repeated three times.
Process parameters and their levels.
The temperature of the sawing area (the contact area between the bone cutting surface and the band saw) was measured by thermal imager (Flir-E50), and it’s frame rate is 50 Hz. The thermal imager is connected to the computer, and the highest temperature of the sawing area is recorded through FLIR Tools+ Desktop. The sawing force during the stable sawing period (from the back of the stainless-steel band saw entering the cortical bone sample to the saw tooth leaving the cortical bone sample) was measured. After sawing, the roughness of the cut surface of the bone flake is measured by a roughness measuring instrument. As shown in Figure 3, using the profile method to evaluate the roughness. Evaluation parameter selection contour arithmetic mean deviation Ra: the arithmetic means of the absolute value of the contour deviation within the sampling length. 24 Finally, the damage of bone cut surface was observed by the COXEM desktop scanning electron microscope (SEM).

Bone chip under surface roughness tester.
Results and discussion
Sawing temperature
In order to measure the sawing temperature, thermal imaging is used to record the highest temperature of the sawing zone. As shown in Figure 4(a), by increasing feed rate, the sawing temperature Q first decreases and then increases. By increasing tooth pitch, the sawing temperature Q decreases. The least value of sawing temperature is 35.5°C, achieved in the case of bone sawing with feed rate of 35 mm/s and tooth pitch of 8.46 mm. The greatest value of sawing temperature is 73.8°C, achieved in the case of bone sawing with feed rate of 5 mm/s, and tooth pitch of 4.20 mm. At the same feed rate, the tooth pitch increased from 4.20 to 6.35 mm, and the average sawing temperature increased by 20.26% accordingly. The tooth pitch increased from 6.35 to 8.46 mm, and the average sawing temperature increased by 9.09% accordingly. Similar results can be found in literature for the influence of various processing parameters on temperature during cutting bone. According to the results of Goran Augustin et al. 25 drilling bone. By increasing feed rate, the drilling temperature decreases. In addition, according to the results of Lee et al. 26 drilling bone, the results show that the maximum temperature increases with the increase of spindle speed. By increasing feed rate, the drilling temperature increases. Also, according to the results of Liao et al. 27 milling bone, the results show that the milling temperature decreases with the increase of spindle speed and feed rate. However, the trend of the test results of the above literatures is inconsistent with the test results of this article.

(a) Results for temperature in various sawing conditions; (b) results for sawing force in various sawing conditions; S1 mean tooth pitch: 8.46 mm; S2 mean tooth pitch: 6.35 mm; S3 mean tooth pitch: 4.20 mm.
Effect of feed rate on sawing temperature
The sawing temperature is mainly affected by friction heat and deformation heat. And friction heat and deformation heat are both related to feed rate. According to the orthogonal cutting heat source and cutting force model shown in Figure 5. There are three heat source generating areas during sawing, which are contact area of shear surface and bone chip (Zone I deformation heat Qd); contact area of rake surface and bone chip (Zone II frictional heat Qf1); contact area of flank surface and bone surface (Zone III frictional heat Qf2).

Cutting force and heat source in orthogonal cutting model; θ: mean back angle; γ: mean rake angle; φ: shear angle; β: friction angle; Fc: vertical cutting force; Ff: horizontal cutting force; F: cutting force; Fγ: force horizontal to the rake face; FγN: force perpendicular to the rake face.
When cutting depth increase, bone chips will undergo brittle fracture under stress resistance without significant plastic deformation, producing irregular crack chips. Thus, by increasing of feed rate, shear angle φ will increase. According to Lee and Shaffer equation (1), by increasing shear angle φ, the friction angle β decreases, and the friction coefficient µ (tan β = µ) also decreases, and the friction heat Qf1 in the contact area between the rake face and the bone chip decreases accordingly. Therefore, by increasing feed rate, sawing temperature decreases. On the other hand, according to Figure 4(b), by increasing feed rate, sawing force Fc increases. That means the solid surface energy that needs to be overcome increases. Moreover, the energy used to form new surfaces and twist the lattice also increases. Finally, the sawing temperature Q increases accordingly. Therefore, by further increasing feed rate, sawing temperature will increase. In summary, when the feed rate is less than 20 mm/s, the sawing temperature could be mainly affected by frictional heat. When the feed rate is more than 20 mm/s, the sawing temperature could be mainly affected by deformation heat.

Effect of tooth pitch on sawing temperature
Due to the low heat transfer efficiency of cortical bone, sawing temperature is affected by heat transfer efficiency of saw teeth. And the heat transfer efficiency of saw teeth is affected by tooth pitch. According to the tooth shape and arrangement of the band saw blade. Figure 6 shows three band saw blades with different tooth pitch. Within unit length (1 inch) of band saw blade S1, S2, S3, the number of teeth is 3, 4, 6 respectively, tooth depth h1 > h2 > h3, saw back (no sawing region) area A1 < A2 < A3. So, at the same feed rate, rake angle and back angle, by decreasing tooth pitch, the number of saw teeth involved in sawing increases in a unit of time increases, and the contact area between sawtooth and cortical bone reduces. Besides, in sawing process, the saw back is in contact with the bone cut surface, the contact area between the bone cut surface and the saw back increases as the tooth pitch decreases. The heat transfer efficiency is affected by the contact area and the number of saw teeth. Thus, the sawing temperature has a non-linear negative correlation with the tooth pitch.

The basic shape and distribution of band saw blade teeth; S1 mean tooth pitch: 8.46 mm; S2 mean tooth pitch: 6.35 mm; S3 mean tooth pitch: 4.20 mm; h: tooth depth.
Analysis of variance for sawing temperature
As we know, sawing temperature is affected by feed rate and tooth pitch. But the significance of each factor and the prediction of bone sawing temperature need to be further determined by analysis of variance (ANOVA).
For mathematical modeling of sawing temperature, firstly analysis of variance (ANOVA) was carried out using the statistical software of Design Expert. Based on the ANOVA analysis, the quartic model was found to be the most appropriate for modeling the sawing temperature. Figure 7 shows 3D graph fitting of sawing temperature with different sawing parameters. The results of ANOVA analysis are given in Table 2, representing statistical parameters of F-value and P-value for each of process parameters as well as for their interactions. The parameters with high F-value and a P-value less than 0.05 (i.e. at confidence level of 95%) are the most important factors.

3D graph of sawing temperature.
ANOVA results for sawing temperature.
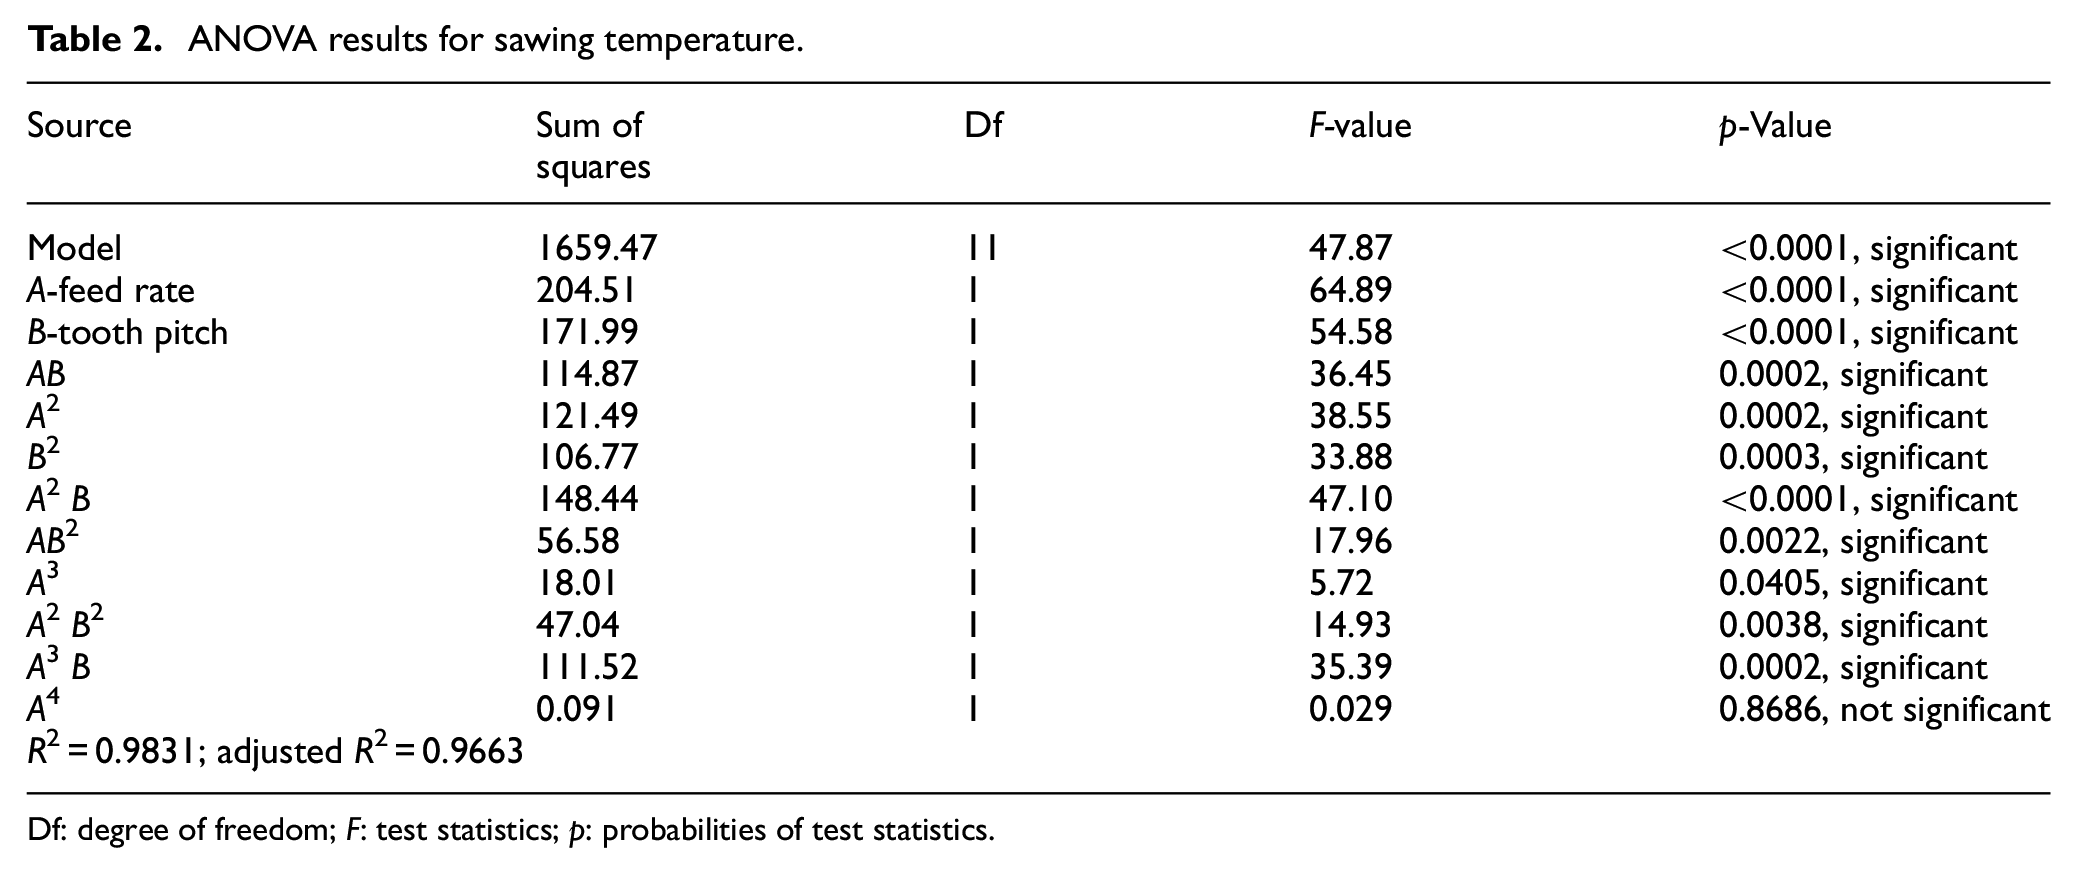
Df: degree of freedom; F: test statistics; p: probabilities of test statistics.
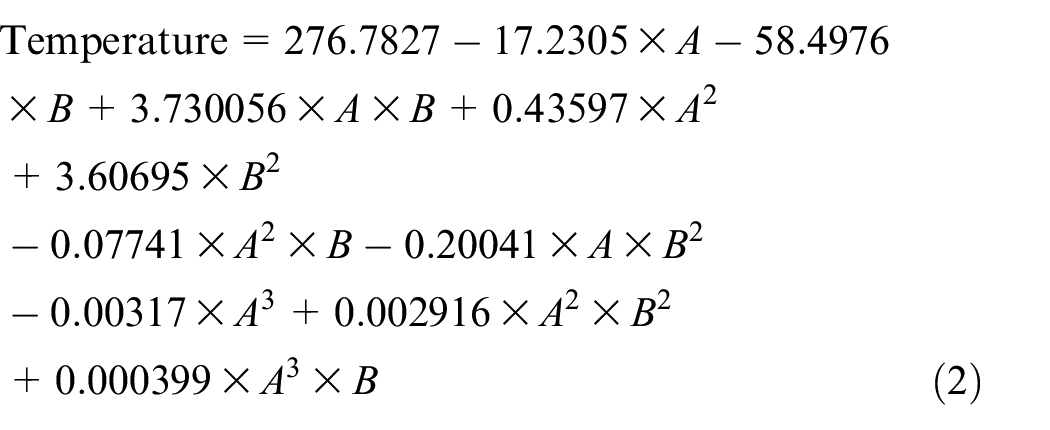
According to the ANOVA (Table 2), the p-values of feed rate and tooth pitch are less than 0.05. There is a term having a p-value more than 0.05 and hence is insignificant on sawing temperature. The regression equation for temperature is given by equation (2). Where, A and B are feed rate and tooth pitch, respectively.
In order to validate the regression predictive model, six confirmation tests were carried out and the results of the experimental tests and the regression model were compared. The comparison results for temperature are summarized in Table 3. As shown in this table, the maximum relative error between the experimental finding and the predictive model is 6.08% for temperature.
Validation tests for sawing temperature.

Bone-surface roughness
In order to study the quality of the bone surface after sawing, a roughness measuring instrument was used to measure the cut surface of the bone. The results are shown in Figure 8(a). The least value of surface roughness is 5.79 μm, achieved in the case of bone sawing with feed rate of 30 mm/s and tooth pitch of 4.20 mm. The greatest value of surface roughness is 9.48 μm, achieved in the case of bone sawing with feed rate of 20 mm/s, and tooth pitch of 6.35 mm. Similar results can be found in literature for the influence of various processing parameters on surface roughness during cutting bone. In the drilling of bovine femur bones, feed rate was found to be proportional to surface roughness, while cutting speed does not result significant influence. 28 Results of turning bone indicated that surface roughness is affected by tool coating, cutting speed, and cutting direction (rank from most influential to less influential). The finest surface finish was obtained when bone machining was conducted in longitudinal direction using coated tool with the parameters set at high cutting speed and low feed. 29 However, the experimental results of the above-mentioned literatures are not completely consistent with the experimental results of this article. Because machining tool and material removal method are inconsistent.

(a) Results for surface roughness in various sawing conditions; (b) results for Fc-RMS in various sawing conditions; S1 mean tooth pitch: 8.46 mm; S2 mean tooth pitch: 6.35 mm; S3 mean tooth pitch: 4.20 mm; Fc-RMS mean the effective value of vertical cutting force.
Relationship between feed rate and bone-surface roughness
During sawing, bone surface roughness could be affected by the degree of brittle fracture and band saw vibration. And they both have relation with speed rate. On the one hand, the chip separation of cortical bone is more brittle fracture tendency with increasing feed rate. Hence, by increasing feed rate, the surface roughness Ra increases. On the other hand, according to the effective value (RMS) of vertical cutting Fc, the vibration energy transferred from the saw blade to the bone also reduces with increasing feed rate. Then, the surface roughness Ra first decreases and then stabilizes. In summary, when the feed rate is less than 20 mm/s, the surface roughness could be mainly affected by brittle fracture. When the feed rate is more than 20 mm/s, the surface roughness could be mainly affected by vibrational energy.
As shown in Figure 9, the SEM images of cortical bone surface show that small defects and shallow plowings appeared on the cut surface with feed rate 55 mm/s (Figure 9(c)). And more cracks and plowings were generated with feed rate 5 mm/s (Figure 9(a)). Meanwhile, it can be observed that some big residual defects of the osteons were caused by this tearing along the sawing direction. When feed rate is 20 mm (Figure 9(b)), obvious defects and many burrs on the cut surface were observed, which produced by the osteon fracture. Obviously, the fracture surface damage trend of cortical bone under different feed rate is consistent with the experimental results.

fracture surface damage of cortical bone for various conditions: (a) 8.46 mm–5 mm/s; (b) 8.46 mm–20 mm/s; (c) 8.46 mm–55 mm/s; (a–c) the first number represent tooth pitch, the second number represent feed rate.
Relationship between tooth pitch and bone-surface roughness
As shown in Figure 10, the SEM images of cortical bone surface show that few cracks and shallow plowings appeared on the cut surface with tooth pitch 4.20 mm (Figure 10(c)). And more cracks and plowings were generated with tooth pitch 8.46 mm (Figure 10(a)). Meanwhile, it can be observed that some residual defects of the osteons were caused by this tearing along the sawing direction. When tooth pitch is 6.35 mm (Figure 10(b)), obvious defects and burrs on the cut surface were observed, which produced by the osteon fracture. Obviously, the fracture surface damage trend of cortical bone under different tooth pitch is consistent with the experimental results. As the tooth pitch increases, the bone surface roughness first increases and then decreases.

Fracture surface damage of cortical bone for various conditions: (a) 8.46 mm–55 mm/s; (b) 6.35 mm–55 mm/s; (c) 4.20 mm–55 mm/s; (a–c) the first number represent tooth pitch, the second number represent feed rate.
Analysis of variance for bone surface roughness
As above, bone surface roughness has relationship with by feed rate and tooth pitch. However, the significance of each factor and the prediction of bone surface roughness need to be further determined by analysis of variance (ANOVA).
For mathematical modeling of bone surface roughness, firstly analysis of variance (ANOVA) was carried out using the statistical software of Design Expert. According to the results, when the feed rate is greater than 5 mm/s and less than 20 mm/s, the quadratic model was found to be the most appropriate for modeling the bone surface roughness, when the feed rate is greater than 20 mm/s, the cubic model was found to be the most appropriate for modeling the bone surface roughness. Figure 11 show 3D graph fitting of bone surface roughness in sawing. The results of ANOVA analysis are given in Table 4.

3D graph fitting of bone surface roughness in sawing: (a) 5 mm/s ≤ feed rate ≤ 20 mm/s and (b) 20 mm/s ≤ feed rate ≤ 55 mm/s.
ANOVA results for bone surface roughness in sawing.

Df: degree of freedom; F: test statistics; p: probabilities of test statistics.
According to the ANOVA, the p-values of feed rate and tooth pitch are less than 0.05. There are some terms having a p-value more than 0.05 and hence are insignificant on surface roughness. Therefore, these insignificant terms were ignored in order to increase the accuracy of the mathematical model. The regression equation for surface roughness is given by equation (3).
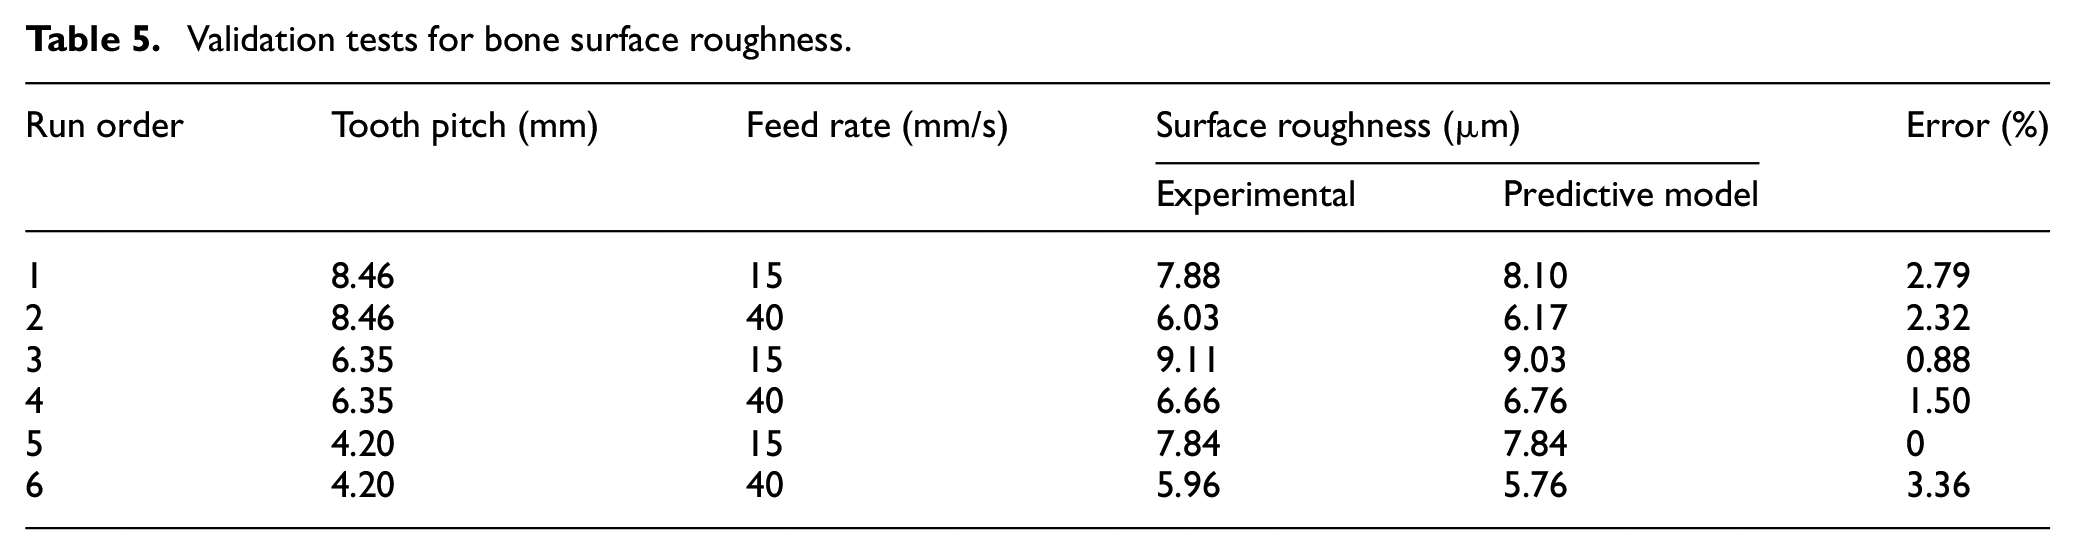
In order to validate the regression predictive model, six confirmation tests were carried out and the results of the experimental tests and the regression model were compared. The comparison results for surface roughness are summarized in Table 5. As shown in this table, the maximum relative error between the experimental finding and the predictive model is 3.36% for surface roughness.

Validation tests for bone surface roughness.
Conclusion
In this study, the effect of band sawing parameters on sawing temperature and surface roughness was experimentally investigated. Among them, the band sawing parameters had been selected three kind of tooth pitch and nine level of feed rate. And the prediction model of cortical bone sawing temperature and cortical bone surface roughness was also established based on experimental results. The following conclusions were drawn from the present study.
During sawing 4 mm thick natural bovine cortical bone and using sawing velocity of 15 m/s, according to the prediction model of temperature and roughness, it is recommended to use the tooth pitch of 8.46 mm, and proper feed rate (30–40 mm/s).
By increasing feed rate, the sawing temperature first decreases and then increases. And, the sawing temperature decreases with increasing tooth pitch.
The feed rate and tooth pitch both have relationship with sawing temperature. But the impact of feed rate on it is more significant. This is because as the feed rate increases, the separation mode of bone chip has changed. And the tooth pitch is mainly related to heat transfer efficiency.
The surface roughness is mainly affected by feed rate. By increasing feed rate, the roughness increases first, then decreases, and finally stabilizes.
Footnotes
Handling Editor: Chenhui Liang
Author contributions
Jing Ni: conception of the work, critical revision of the title and abstract, final approval of the version to be published. Jun Cai and Yang Wang: data collection (Force, Temperature, Surface roughness and microscopy), data analysis and interpretation, drafting the article. Zhen Meng: design of the experiment, critical revision of the Introduction, discussion and conclusion.
Declaration of conflicting interests
The author(s) declared no potential conflicts of interest with respect to the research, authorship, and/or publication of this article.
Funding
The author(s) disclosed receipt of the following financial support for the research, authorship, and/or publication of this article: This research was supported by National Natural Science Foundation of China (Grant No. 51775153), China; Science Fund for Distinguished Young Scholars of Zhejiang Province (LR20E050002), China; this research was financially supported by the Fundamental Research Funds for the Provincial Universities of Zhejiang “GK199900299012-005.”
Consent to participate and consent for publication
All presentations of case reports have consent for publication and have consent to participate.
Informed consent
Informed consent was waived with the permission of institutional review board.
Availability of data and material
All data generated or analyzed during this study are included in this article.