
Abstract
At present, research on the characteristics of pumps as turbine (PATs) during the start-up process is still insufficient. To reveal the transient characteristics of a centrifugal PAT during the atypical start-up process, a test rig for the transient performance of the PAT was built; in addition, experiments on the transient hydraulic performance of three kinds of steady speed and three kinds of steady flow were conducted. Through these experiments, the evolution characteristics of the transient performance parameters of the PAT during the atypical start-up process were analyzed over time. Moreover, three dimensionless coefficients were employed to deeply reveal the transient characteristics of the PAT during atypical start-up. Results showed that the rise curves of flow rate and outlet static pressure exhibited shock phenomena. With the increase in the stable running speed after start-up, the impact phenomenon of the outlet static pressure presented a delayed trend. The dimensionless head and flow coefficients reached the maximum value at the initial stage of the atypical start-up process and then rapidly dropped to the minimum value before slowly rising to the final stable value. The dimensionless power coefficient had a maximum value at the initial stage of atypical start-up and then rapidly dropped to the final stable value.
Keywords
Introduction
In the petrochemical, oil refining, and seawater desalination industries, numerous high-pressure fluids are transformed to low pressure fluid through pressure-reducing valves or by direct discharge. If the energy is not recovered and discharged directly, serious energy waste occurs. At present, using the existing centrifugal pump reverse rotation as a hydraulic turbine (referred to as pump as turbine, PAT) is a crucial means to achieve the recovery and utilization of liquid pressure energy.
Current research on the performance of PATs is mainly focused on the parametric design of improving energy conversion efficiency. For example, Wang et al. 1 designed four types of forward-curved impellers with different blade inlet and outlet angles and found that the efficiency curve of the forward curved impeller flattens further, and its maximum efficiency is greatly improved in comparison with the backward-curved impeller. Chen et al. 2 focused on the effects of three different outer diameters of impellers on the performance of forward-bending hydraulic turbines. With the increase in the outer diameter of the impeller, the high-efficiency point shifts to the large flow area; in the large flow area, the head is greatly reduced, the shaft power is slightly increased, and the efficiency is significantly improved; in the small flow area, the head rises, the shaft power slightly decreases, and the efficiency remarkably decreases. Doshi et al. 3 and Derakhshan et al. 4 changed the shape of the inner side, namely that the inner side of the front and rear covers of the PAT impeller and the blade inlet were rounded. Hydraulic loss can be effectively reduced, and transmission efficiency can be improved. Furthermore, the modification of the installation angle of the curved blades was proposed, and hydraulic loss can be reduced by 5%–10%. The essence of the above approach is to reduce the impact loss of the impeller inlet. The above results provide a good reference for the improvement of the energy conversion efficiency of existing products.
Singh and Nestmann 5 focused on experimental research on the influence of blade height and blade number on the hydraulic performance of axial flow pumps in turbine operation mode. As the number of blades increases, the efficiency sharply decreases. This finding can be attributed to the change of the relative flow vector at the exit of the impeller. Such change directly leads to a decrease in rotational momentum and an increase in axial speed. The results also demonstrated that the reduction of blade height directly reduces hydraulic loss through the impeller but does not considerably affect hydraulic performance. Therefore, the number of blades is considered the main influencing factor. This study provides a good reference for the improvement of the efficiency of axial flow pumps in reverse operation mode. Yang et al. 6 focused on the effect of the gap between the impeller and the volute on the performance and pressure pulsation of the pump. With the increase in gap, the efficiency of the pump turbine shows a gradual increase after the optimal point. Moreover, the amplitude of the high-frequency pressure pulsation in the volute shows a decreasing trend, whereas that of the low-frequency pressure pulsation in the impeller remains basically unchanged. The essence is that the upstream influence of the incoming flow is large, and the downstream influence is small. Yang and Wang 7 designed three different blade shapes according to different blade inlet and wrap angles. When the small blade inlet angle and the large blade wrap angle are used, the efficiency of the optimal point is the highest; when the flow rate is greater than the design flow rate, the larger the wrap angle and the more evident the decrease in turbine efficiency become. This study provides an important reference for the selection of a double-volute centrifugal pump used as a hydraulic turbine.
Most research on the influence of PAT performance parameterization are conducted with the geometric parameters of the flow components as the research object. In addition, the change of conveying medium is an important factor that affects or even determines the performance of PATs. At present, research on this aspect is limited. Li et al.8,9 is currently one of the few publicly reported studies on the influence of the characteristics of the conveying medium on the performance of PATs. The flow rate and energy consumption of the turbine under the optimal working conditions increase with the increase in viscosity, whereas hydraulic efficiency shows a decreasing trend, and the output shaft power is mainly determined by the liquid density. Furthermore, viscosity affects the performance of turbines more considerably than that of pumps. The necessary cavitation allowance of PATs increases with the increase in liquid viscosity, but the amplitude is relatively small; at the same viscosity, it was only 50%–80% of the necessary cavitation allowance of the pump; the NPSH determined by 3% reduction of shaft power was basically consistent with that determined by 1% reduction of hydraulic efficiency.
Although scholars have conducted numerous studies on the hydraulic performance of PATs on the basis of geometric parameters, the viscosity of the conveying medium, and other parameters, they have found that these studies were all conducted under stable working conditions, and the transient hydraulic performance during the start-up process was not involved.
Internal flow characteristics are the fundamental reason for determining external characteristics. The rapid development of computational fluid dynamics (CFD) provides the possibility to master the complex flow characteristics of PATs. CFD has also become an important research method for many scholars.10–16 The author of this paper previously carry out numerical calculations to found that as the viscosity of the liquid increases, the shape and size of the cavities on the blade’s outlet side do not change remarkably under various working conditions, but the length of the cavities at the tip of the discharge cone gradually becomes shorter. 9 The flow in the draft tube seems to be uniform, but the streamline is a spiral, and the direction of rotation is opposite to that of the impeller. The smaller the flow is, the larger the helical angle is. The larger the flow is, the smaller the helical angle is. In the case of cavitation, the streamlines in the volute and the impeller are basically the same as the single-phase flow, and the flow of the draft tube is relatively uniform along the circumferential direction; however, the helical angle is increased.
In summary, almost all of the current analyses on the internal flow of PATs are conducted under stable working conditions. Research on start-up performance is insufficient, and the influence of characteristic parameters, such as high-pressure inflow on the start-up performance of PATs, has yet to be revealed. In this study, a kind of pump was used as a turbine model to conduct a transient performance experimental study during the atypical start-up process. The study focused on obtaining the transient performance evolution law under different incoming flow rates and different stable speeds. Through dimensionless analysis, the transient characteristics of the PAT during the atypical start-up process were further revealed.
The test bed and physical model
Test-bed
The built test-bed of pump as turbine is shown in Figure 1, which is an open loop. The test-bed is mainly composed of a booster pump unit, a tested pump as turbine unit, a water tank, a pipeline system, and a testing system. The driving device of the booster pump is a three-phase asynchronous motor, and the rotational speed is able to be adjusted by a frequency converter. The pump as turbine unit is mainly composed of a pump as turbine, a dynamic torque sensor, and a three-phase asynchronous motor for frequency conversion and speed regulation. Table 1 show the instrument specification. The photoelectric encoder is mounted on the dynamic torque sensor. The three-phase asynchronous motor for variable frequency speed regulation is mainly used to absorb the shaft power generated by the pump as turbine. The model type is YVF2-132S-4, rated absorption power is 5.5 kW, rated rotational speed is 1440 r/min, and the maximum rotational speed is 3000 r/min. The rated torque is 35.0 N m, rated voltage is 380 V, and the rated current is 12.0 A. The flowmeter is an electromagnetic type.

Test-bed (a) prototype (b) three dimensional model.
Instrument specification.

The basic working process of the pump as turbine test-bed is as follows. We open each valve, start the booster pump, and pressurize the fluid from the water tank. Part of the pressurized water flows back to the water tank, and another part flows into the pump as turbine. After the pump as turbine operates, the water flows back to the water tank. The impeller of the pump as turbine begins to rotate after being worked by the pressurized water flow, and it drives the torquemeter and the three-phase asynchronous motor for variable frequency speed regulation to rotate. The three-phase asynchronous motor for variable frequency speed regulation can consume the power generated by the pump as turbine and control the rotational speed of the motor.
The conveying medium is the clear water medium at room temperature, the density is 998.2 kg/m3, and the dynamic viscosity is 1.0069 × 10⁻³ Pa s.
Physical model
This experiment mainly involves two pumps, that is, the booster pump and the pump reversal as turbine, referred to as the pump as turbine. The booster pump unit is a direct-coupled pipeline centrifugal pump, model ISW-65-160(1). The rated parameters are as follows. The flow rate is 50 m3/h, the head is 32 m, and the rotational speed is 2900 r/min.
The prototype pump of the pump as turbine is a centrifugal water pump, as shown in Figure 2, model IS80-50-200J. Its parameters are showed in Table 2. Wherein blade is twisted, and the inlet blade angle in Table 2 is located at the flow line in the middle of the blade. Its specific speed ns = 3.65nQ0.5/H0.75 = 66, wherein n, Q, and H are the rated rotational speed (r/min), flow rate (m/s), and head (m), respectively.

Pump as turbine (a) volute (b) impeller (c) assemble model.
Specification of physical model.

Experimental methods and scheme
The testing scheme in this paper is shown in Table 3. The startup process of the pump as turbine can be divided into two types. One is to close the discharge valve, and after the startup of the booster pump ends, the discharge valve is quickly opened to a certain opening. Given that the flow pressure entering the pump as turbine is high, it will start quickly, which is called the typical startup process. The other is to open the discharge valve to a certain opening prior to starting the booster pump, and then start the booster pump. In this process, the flow rate and the pressure that entering pump as turbine rise slowly with the startup of booster pump. In other words, the pump as turbine starts slowly, which is called an atypical startup. In this paper, the latter atypical startup experiments are carried out to get the transient hydraulic performances of pump as turbine.
Testing scheme (value after startup).

The basic testing steps of transient performance of the pump as turbine during an atypical startup process are showed in Figure 3. On the basis of the testing step, until finish all the testing scheme shown in Table 3.

Basic testing step of atypical startup.
Result analysis
Speed effect
After the start-up, when the stable flow rate was 45 m3/h, the atypical start-up performance of the pump was tested at expected stable speeds of 1000 (low speed), 1200 (moderate speed), and 1450 (high speed) r/min.
Speed
The instantaneous speed under the same stable flow rate measured by the speed torque sensor is shown in Figure 4. The average values of the three stable speeds measured in this experiment were approximately 1046, 1204, and 1436 r/min after the start-up. Some differences were observed between the actual test speed and the expected speed due to voltage instability during the experiment. In the atypical start-up process, the increase in speed generally shows a change process of slow, then fast, and then slow. At the initial stage of atypical start-up, the speed increase was slow. After approximately 1.0 s, the speed increased considerably. The slow increase in speed can be attributed to two aspects: (1) the incoming flow pressure and flow were relatively small at the initial stage of atypical start-up, and (2) the initial static friction of the bearing and other parts of the pump must be overcome as a turbine. In the subsequent rapid rise process, the speed rose fastest in the low-speed state, followed by the moderate-speed state, and the slowest in the high-speed state. For example, at 3.0 s, the corresponding instantaneous speeds at low, moderate, and high speeds were 460, 359, and 306 r/min, respectively; the ratios to the final stable speed were approximately 0.44, 0.30, and 0.21, respectively. Furthermore, the lower the stable speed after the start, the faster the speed increase rate, and vice versa. Under the three states, the time required for the speed to rise to their respective stable values was approximately 8.60, 10.60, and 10.90 s. With the increase in stable speed after starting, the time required to complete the starting process showed a prolonged trend.

Instantaneous speed under the same steady flow.
Flow
The instantaneous flow in the three start states measured by the electromagnetic flowmeter is shown in Figure 5. In this experiment, the stable flow after starting was controlled in advance by the outlet valve; thus, the actual measured stable flow was almost the same, that is, 45.026, 45.038, and 45.107 m3/h. Given that the experiment in this study is an atypical start-up process, the flow rate increase in the pipeline system mainly depended on the start-up characteristics of the booster pump and the pipeline resistance. The flow rate rose slowly as a whole, especially in the early stage of atypical start-up. After 2.5 s, the rate of increase in flow rate became remarkably faster. Under the three stable speed states, a flow shock phenomenon occurs, that is, the flow first rose to their respective maximum values and then gradually decreased to the final stable value. Under low, moderate, and high stable speed states, the maximum flow rate was 46.617, 45.961, and 46.051 m3/h, which are considerably higher than the final stable flow value; the corresponding time was 32.0, 24.4, and 22.7 s, respectively. In the case of the same valve opening, when the stable speed of the PAT was high, the traffic shock phenomenon appeared to be ahead of time in the process of atypical start-up. Under the three stable speed states, the impact flow (defined as the difference between the maximum value and the stable value) was 1.591, 0.923, and 0.944 m3/h. This result shows that in the low-speed state, the flow shock phenomenon was the most severe; for the moderate- and high-speed states, the flow shock was almost the same.

Instantaneous flow rate under different stable speed conditions: (a) overall rising characteristics and (b) local rising characteristics.
Although the final steady flow rate was the same, some differences in the flow rate increase were observed. For the low- and moderate-speed states, most of the flow rate increases were almost the same, and changes only occurred at the end of the rising process. For the moderate-speed state, the flow curve directly rose rapidly to the maximum flow value of 45.961 m3/h and then gradually decreased to the final stable value. As for the low-speed state, at the end of the ascending process of the flow curve, the ascent rate became slower and then continued to slow down until it rose to the maximum flow value of 46.617 m3/h.
Static pressure
The instantaneous static pressure curves at the inlet and outlet of the PAT were measured by the WIKA pressure sensor, as shown in Figure 6. In this study, the static pressure at the PAT inlet (Figure 6(a)) is the static pressure at the outlet of the booster pump minus the flow hydraulic loss in the pipeline. Therefore, the static pressure curve at the inlet of the PAT reflects to some extent the evolution characteristics of the outlet static pressure during the start-up of the booster pump. In theory, for any atypical start-up process, the static pressure curves of the pump and turbine inlet should be exactly the same. The test results show that after the atypical start-up process, the final static pressure values under the three stable speed states were approximately 239.875, 243.341, and 241.653 kPa. The slight fluctuation of inlet static pressure is mainly caused by the local voltage instability during the experiment. Under the three stable speed states, the static pressure at the initial moment of the atypical start-up process was 12 kPa; the reason is that in this study, the free surface in the water tank was approximately 1.2 m higher than the installation position of the PAT’s inlet pressure sensor. During the atypical start-up process, the overall static pressure curve of the PAT inlet showed a slow rise, and both rose to the final stable value at approximately 23.0 s.

Instantaneous static pressures under the same steady flow: (a) inlet and (b) outlet.
Figure 6(b) shows the evolution curve of static pressure at the outlet of the PAT; this curve was obtained by experimental measurement during the atypical start-up process. Moreover, the static pressure at the initial moment of the atypical start-up process was approximately 12 kPa in the three stable speed states because the free surface in the water tank was approximately 1.2 m higher than the installation position of the outlet pressure sensor. The static pressure curves under the three states showed an evolution characteristic of rising first and then falling, that is, an impact phenomenon occurred in the outlet static pressure. Under the low, moderate, and high stable speed states, the maximum static pressure values were 115.053, 104.424, and 70.562 kPa, and the corresponding moments were approximately 22.4, 23.0, and 24.0 s, respectively. With the increase in the pump’s stable operation speed of the turbine, the impact phenomenon of the outlet static pressure presented a delayed trend. The final static pressure values after start-up were approximately 105.723, 97.798, and 66.961 kPa. Under the three stable speed states, the impact static pressure (defined as the difference between the maximum value and the stable value) was 9.330, 6.625, and 3.601 kPa. This result shows that in the low-speed state, the static pressure shock phenomenon was the most severe; with the increase in the pump’s stable operation speed, the outlet static pressure shock phenomenon also showed a weakening trend. Given the dynamic and static interference between the rotor and the stator in the turbine, the static pressure at the outlet fluctuated to a certain extent. Before 4.0 s of the start-up process, the outlet static pressure rose extremely slowly; then, the rising rate gradually increased. For example, at 10.0 s, the instantaneous outlet static pressure values in the three states were 27.311, 25.423, and 19.916 kPa; at 20.0 s, the values were 97.594, 90.957, and 60.346 kPa.
Head
In accordance with the static pressure and flow values measured by the pressure sensor of the inlet and outlet of the PAT, the head of the PAT can be calculated. For pumps, the outlet static pressure was generally much higher than the inlet static pressure because of the impeller’s work effect; thus, the pump head was generally determined by the outlet static pressure. For PATs, its inlet static pressure must be higher than its outlet static pressure, and the head is usually determined by the turbine’s inlet and outlet static pressure. Figure 7 shows the instantaneous head evolution curve during atypical start-up under three stable speed conditions. In the low, moderate, and high stable speed states, the corresponding stable heads after the start were 13.19, 14.39, and 17.13 m, respectively. During the atypical start-up process, the instantaneous lift rise curve generally showed a quadratic parabolic law, which gradually rose to their respective stable values at approximately 23.0 s. Under the low, moderate, and high steady speed states, the three head rise curves are almost the same, indicating that in the current test scheme, the change of the steady speed of the PAT has no considerable influence on the instantaneous head rise evolution. For example, at 10.0 s during the start-up process, the instantaneous head values under the three states were 1.80, 2.13, and 2.09 m, and the ratio to the final stable head was approximately 0.137, 0.148, and 0.122; at 20.0 s, the instantaneous head values under the three states were 7.70, 7.68, and 7.90 m, and the ratio to the final stable head was approximately 0.584, 0.534, and 0.461.

Instantaneous head under the same steady flow.
Shaft power
The instantaneous speed and torque of the PAT were measured by the NH-901 strain gauge torque sensor. The calculated instantaneous shaft power is shown in Figure 8. The average values of the stable shaft power after the three atypical start-up processes were approximately 0.641, 0.697, and 0.776 kW. Under the same flow, the higher the stable running speed after the start, the higher the shaft power of the PAT. The instantaneous speed and torque were measured by the same sensor; thus, the instantaneous speed in Figure 4 and the rise characteristics of the instantaneous shaft power in Figure 8 were similar. Under the low, moderate, and high stable speed states, the characteristics of shaft power rise and speed rise were basically the same, and the shaft power first rose slowly, then rapidly, and then slowly. At the initial stage of atypical start-up, the shaft power rose slowly. Similarly, after approximately 1.0 s, the shaft power increased remarkably.

Instantaneous shaft power under the same steady flow.
In the quick rising phase, the speed rising rate in the low-speed state was the slowest, followed by the moderate-speed state, and the fastest was the high-speed state. For example, at 2.0 s, the corresponding instantaneous shaft power at low, moderate, and high states were 0.138, 0.079, and 0.050 kW, respectively; the ratios to the final stable speed were approximately 0.215, 0.113, and 0.064, respectively. At 4.0 s, the corresponding instantaneous shaft powers at low, moderate, and high states were 0.490, 0.415, and 0.339 kW, respectively; the ratios to the final stable speed were approximately 0.764, 0.595, and 0.437, respectively. The lower the stable speed after starting, the faster the shaft power rise rate, and vice versa. Consistent with the speed characteristics, the time required for the shaft power to rise to their respective stable values under the three stable speed states was also approximately 8.60, 10.60, and 10.90 s.
Flow effect
When the stable speed after the start was 1200 r/min, the atypical start-up performance of the PAT at the stable flow of 30, 35, and 40 m3/h was studied and called low, moderate, and high flow start states. Three flow rates corresponded to three valve openings, namely, small, moderate, and large openings, respectively.
Flow
In the case of the same stable operating speed, the instantaneous flow rate rise curve measured during atypical start-up is shown in Figure 9. After the pump was started as a turbine, the stable working condition flow rate was achieved by adjusting the outlet valve opening; this adjustment was an active one. Therefore, the actual measured stable flow rate is not much different from the target value. In the case of three outlet valve openings, the actual measured steady-state flow rates were 30.183, 35.047, and 39.930 m3/h. The difference from the target setting values of 30.0, 35.0, and 40.0 m3/h was small. During the atypical start-up process, the three flow curves generally showed similar upward evolution characteristics. Before 4.0 s, the actual test flow rates were 0.474, 0.474, and 0.408 m3/h under three stable flow conditions of low, moderate, and high. At the initial stage of start-up, the flow rate rose slowly. Subsequently, the flow curve showed a gradual and rapid upward trend. At 10.0 s after starting, the test flow rates under the three valve opening conditions were 9.166, 9.557, and 10.384 m3/h, and the ratios to the stable flow rate after starting were 0.304, 0.273, and 0.260; at 20.0 s after starting, the test flow rates under the three valve opening conditions were 26.892, 29.480, and 32.205 m3/h, and the ratios to the stable flow rate after starting were 0.891, 0.841, and 0.807. The smaller the outlet valve opening is, the faster the flow rise is. Under the three valve openings, the three flow curves quickly rose to their respective maximum values and then slowly decreased until they fell to their respective stable values. Furthermore, a flow shock phenomenon occurred when the flow rate rose. The appeared maximum flow values were 32.088, 35.342, and 40.571 m3/h, the ratios to the stable flow rate after the start-up were 1.063, 1.008, and 1.016; and the corresponding time was 26.0, 26.5, and 26.9 s. As the opening of the outlet valve increased, the flow shock phenomenon showed a slight lagging trend. Under the three valve opening situations, the impact flow rate (defined as the difference between the maximum value and the stable value) was 1.905, 0.295, and 0.641 m3/h. This result showed that in the case of small valve openings, the flow shock phenomenon was the most severe; for medium and high valve openings, the flow shock phenomenon was insignificant.
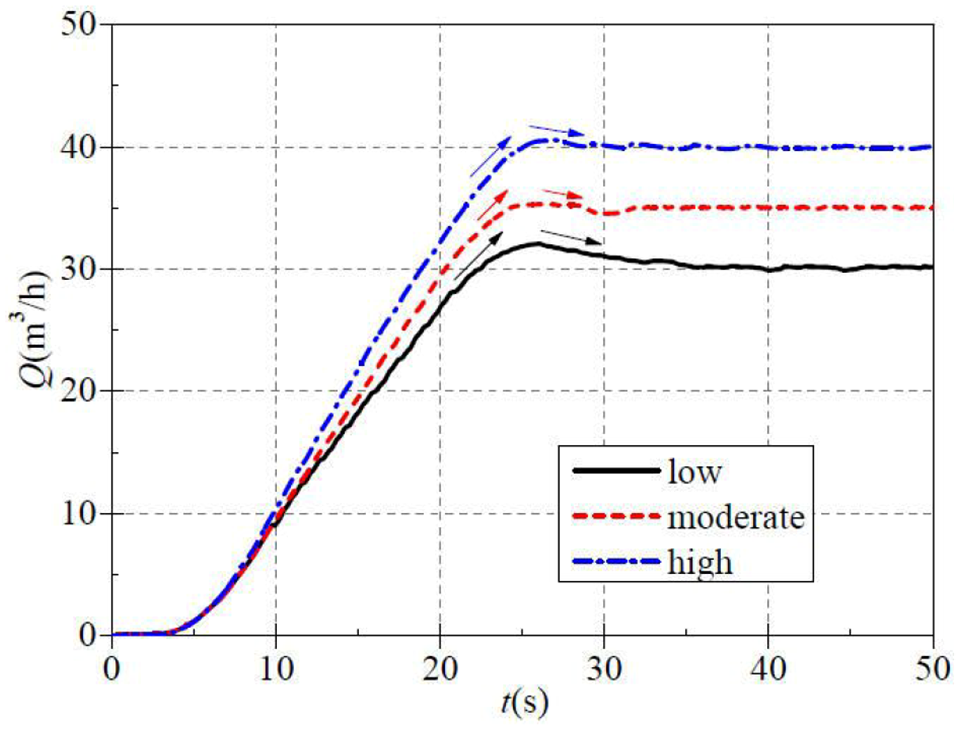
Instantaneous flow at the same stable speed.
Speed
Figure 10 shows the evolution of the instantaneous speed over time during the atypical start-up process under three valve opening situations. Under small, medium, and large outlet valve openings, the three speed rise curves had similar evolution characteristics: first, they rose slowly, then rose quickly, and then rose slowly to stable values, that is, two slow rises and one rapid rise occurred. Before approximately 1.20 s, the speed increase was extremely slow. For example, at 1.0 s, the corresponding instantaneous speeds were 3.2, 5.7, and 4.4 r/min. During the rapid rise process under medium and large valve openings, the speed rise was considerably higher than that of the small valve opening. For example, at 5.0 s, the corresponding instantaneous speeds were 657.5, 791.7, and 775.9 r/min in the case of small, medium, and large outlet valve opening. This result was obtained because under medium and large valve openings, the passing flow was larger; hence, the torque acting on the PAT was larger due to the faster speed rises. At approximately 8.0 s, the speed rise became slow again. After approximately 20 s, the speed rose gradually to the final stable value, and the corresponding stable values were 1193.4, 1197.8, and 1195.3 r/min. Similarly, the difference between the actual test speed and the expected speed was caused by voltage instability during the experiment.
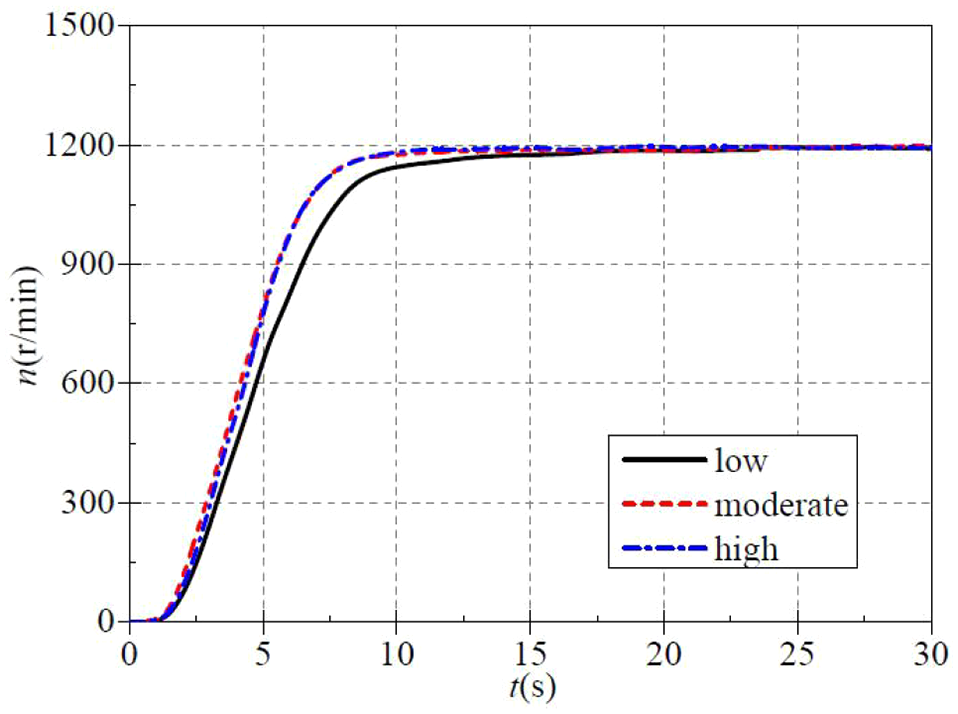
Instantaneous speed under different steady flows.
Static pressure
The instantaneous static pressure curves measured at the inlet and outlet of the PAT in the case of small, medium, and large valve openings are shown in Figure 11. The test results in Figure 11(a) show that the static pressure at the initial moment of the atypical start-up process was approximately 12 kPa. With the continuous advancement of the start-up process, the speed of the booster pump gradually increased, and the static pressure of the pump as the turbine inlet also showed a gradual increase trend. With the increase in the outlet valve opening of the PAT, that is, the increase in the steady flow rate after start-up, the increase in the static pressure at the inlet of the PAT slowed down during the start-up process. In the case of small, medium, and large valve openings, when the start-up time was 10.0 s, the corresponding instantaneous inlet static pressure of the PAT was 138.035, 110.525, and 103.012 kPa, respectively; when the start-up time was 20.0 s, the corresponding instantaneous inlet static pressure of the PAT was 237.153, 200.326, and 186.348 kPa, respectively. In the case of small, medium, and large valve openings, the corresponding steady static pressure values of the PAT’s inlet static pressure after the start-up process were 306.782, 288.882, and 269.356 kPa, and the corresponding rise time was 22.3, 22.9, and 24.6 s, respectively. As the opening of the outlet valve increased after start-up, the time required for the static pressure at the inlet of the PAT to rise to the stable value presented a slightly prolonged trend.

Instantaneous static pressures at the same stable speed: (a) inlet and (b) outlet.
The test results in Figure 11(b) show that the static pressure at the initial moment of the atypical start-up process was approximately 12 kPa. In the case of small, medium, and large valve openings, the three static pressure curves as a whole first rose slowly, then rose rapidly, and then fell to a stable value, that is, the static pressure at the outlet of the PAT had a common impact phenomenon during the atypical start-up process. Before 5.0 s of the atypical start-up process, the outlet static pressure rose extremely slowly; then, the rising rate gradually increased. In the case of small, medium, and large valve openings at 5.0 s, the instantaneous outlet static pressure values were 12.375, 13.268, and 12.790 kPa, respectively; at 10.0 s, the instantaneous outlet static pressure values were 38.579, 36.015, and 30.107 kPa, respectively; at 15.0 s, the instantaneous outlet static pressure values were 92.820, 84.012, and 66.630 kPa, respectively; at 20.0s, the instantaneous outlet static pressure values were 174.575, 155.998, and 124.776 kPa, respectively. In the case of small, medium, and large valve openings, the measured maximum instantaneous static pressure values were 225.512, 192.218, and 154.019 kPa, and the corresponding time was approximately 23.1, 23.1, and 23.2 s, respectively. The time of the impacted static pressure did not change with the change of the pump’s outlet valve opening, that is, the impact phenomenon of the outlet static pressure had minimal connection with the valve opening. The final static pressure values after start-up were approximately 205.248, 174.986, and 142.159 kPa. In the case of small, medium, and large valve openings, the impact static pressure (the difference between the maximum value and the stable value) was 20.263, 17.232, and 11.860 kPa, respectively. This result shows that in the case of a small valve opening, the static pressure impact phenomenon was the most severe; as the outlet valve opening of the PAT increased, the impact of static pressure of the PAT at the outlet also showed a weakening trend. The static pressure at the outlet of the PAT also fluctuated to a certain extent due to the interference of movement and static.
Head
Figure 12 shows the instantaneous head evolution curve during atypical start-up under three valve openings. In the case of small, medium, and large valve openings, the corresponding stable heads after the start-up process were 10.31, 11.50, and 12.30 m, respectively. During the atypical start-up process, the instantaneous heads gradually rose to their respective stable values at approximately 28.0 s. In the case of a small valve opening, the head rise curve changed most drastically during atypical start-up. In any case, as the opening of the PAT’s outlet valve increased (i.e. the steady flow rate increased), the head of the PAT showed an increasing trend, which is completely opposite to the trend of the pump head with the flow rate.
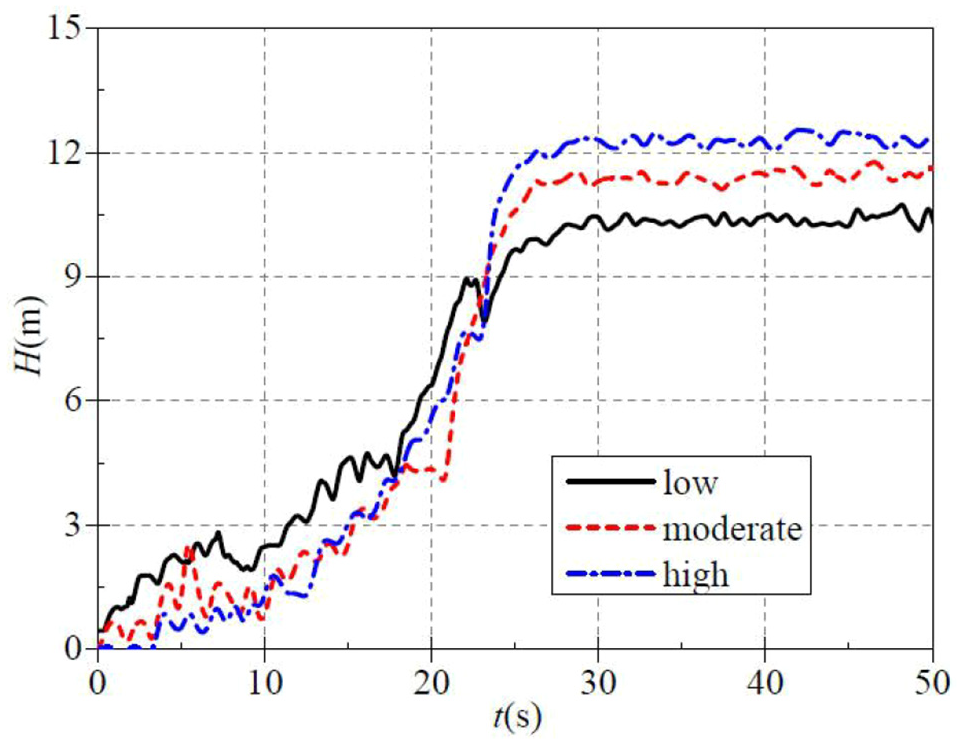
Instantaneous head at the same stable speed.
Shaft power
The instantaneous shaft power tested in this research scheme in the case of small, medium, and large valve openings is shown in Figure 13. The average values of the stable shaft power after the three atypical start-up processes were approximately 0.252, 0.372, and 0.519 kW. Under the same speed, the higher the stable running flow after the start, the higher the shaft power of the PAT. Compared with the influence of speed on shaft power, the influence of working condition flow on shaft power was more critical. Similarly, the shaft power first rose slowly, then rose rapidly, and then rose slowly, that is, two slow rises and one rapid rise occurred. Similarly, after approximately 1.0 s, the shaft power increased remarkably; before 1.0 s, the shaft power rise was slow. During the rapid ascent phase, the rising rate of each valve opening varied. At 5.0 s, the corresponding instantaneous shaft powers at small, medium, and large opening valves were 0.159, 0.287, and 0.383 kW, respectively; the ratios to the final stable speed were approximately 0.632, 0.771, and 0.738, respectively. This result shows that the shaft power rise rate was the fastest in the case of a medium valve opening, followed by the case of a large valve opening; the slowest was in the case of a small valve opening.

Instantaneous shaft power at the same stable speed.
Dimensionless analysis
During the atypical start-up process of the PAT, the flow and pressure of the incoming flow into the PAT gradually increased, resulting in drastic changes in various performance parameters, such as speed, head, and shaft power. To reveal the transient characteristics of the PAT during the atypical start-up process, the influence caused by speed change should be eliminated. The dimensionless volume flow, dimensionless head, and shaft power with time were used to describe the atypical start-up process. The three are defined as

where u2(t) is the instantaneous circumferential speed at the exit of the impeller, and its expression is u2(t) = πD2n(t)/60. Figures 14 to 16 show the evolution of instantaneous dimensionless flow, head, and shaft power over time during atypical start-up.

Dimensionless flow coefficient: (a) speed influence and (b) flow influence.

Dimensionless head coefficient: (a) speed influence (b) flow influence.

Dimensionless power coefficient: (a) speed influence (b) flow influence.
Dimensionless flow coefficient
Figure 14 shows that in any case, the dimensionless flow coefficient had a maximum value at the initial stage of atypical start-up of the pump, then rapidly dropped to the minimum value, and then slowly rose to the final stable value; the time required to drop to the minimum was different.
Under the same working flow (45 m3/h), when the stable speed was 1000, 1200, and 1450 r/min after the start, the time required for the dimensionless flow coefficient to drop to the minimum value was approximately 1.20, 2.20, and 3.10 s, and the corresponding minimum values were approximately 0.002, 0.009, and 0.026. This result shows that speed change has a certain influence on the dimensionless flow coefficient. When the start-up finally ended and entered a stable state of normal operation, the corresponding dimensionless flow coefficients were approximately 0.198, 0.172, and 0.145. With the increase in the starting stable speed, the dimensionless flow coefficient showed a gradually decreasing trend.
Under the same stable speed (1200 r/min), when the stable flow was 30, 35, and 40 m3/h after the start, the time required for the dimensionless flow coefficient to drop to the minimum value was approximately 3.10, 3.0, and 3.0 s, and the corresponding minimum values were approximately 0.0033, 0.0025, and 0.0018. The time required for the dimensionless flow coefficient to drop to the minimum value was approximately 3.0 s, and the corresponding minimum values were all small. When the start-up finally ended and entered a stable state of normal operation, the corresponding dimensionless flow coefficients were approximately 0.116, 0.135, and 0.154. With the increase in the stable flow after start, the dimensionless flow coefficient showed a gradually increasing trend.
In any case, the speed and flow rate had a certain effect on the dimensionless flow, that is, the dimensionless flow was related to the speed and flow.
Dimensionless head coefficient
A comparison between Figures 14 and 15 reveals that during the atypical start-up process of the pump as turbine, the dimensionless head coefficient and dimensionless flow coefficient generally had an approximately consistent evolutionary trend, that is, both reached the maximum at the earliest atypical start-up, then quickly dropped to their minimum values, and slowly rose to their final stable values. The reason for the maximum is due to the pressure impact at the earliest atypical start-up. As we know, the fluid medium in whole loop system is static before startup. When the impeller of booster pump is abruptly rotated, which cause pressure impact on the static fluid.
Under the same working flow (45 m3/h), when the stable speed was 1000, 1200, 1450 r/min after the start, the dimensionless head coefficients corresponding to stable operation after the start-up were approximately 2.11, 1.73, and 1.46, respectively. This result shows that with the increase in the stable speed after start, the dimensionless head coefficient showed a gradually decreasing trend.
Under the same stable speed (1200 r/min), when the stable flow was 30, 35, and 40 m3/h after the start, the dimensionless head coefficients after start were approximately 1.26, 1.41, and 1.51, respectively. With the increase in the stable flow after start, the dimensionless flow coefficient also showed a gradually increasing trend.
The speed and flow rate had a certain effect on the dimensionless flow, that is, the dimensionless flow was also related to the speed and flow.
Dimensionless power coefficient
The calculation results in Figure 16 show that during the atypical start-up process of the PAT, the dimensionless power coefficient showed a different evolution trend from the dimensionless flow coefficient and the dimensionless head coefficient. The dimensionless power coefficients all had the maximum values at the initial stage of atypical start-up and then rapidly dropped to the final stable values.
Under the same working flow (45 m3/h) and three stable speed conditions (1000, 1200, and 1450 r/min), the coefficients all dropped to the same final stable value (0.016) at approximately 5.0 s. Under the same stable speed (1200 r/min) and three stable flow conditions (30, 35, and 40 m3/h), the coefficients all dropped to the same final stable value (0.012) at approximately 5.0 s. The steady speed change and steady flow change after the start-up had no considerable influence on the dimensionless power coefficient.
The influence of speed and flow on the dimensionless power was small, that is, the dimensionless power was independent of the speed and flow.
Discussion
Under the same working and flow conditions, experiments were conducted to study the effects of three stable speeds on the transient hydraulic performance of the PAT during atypical start-up; similarly, under the same stable speed, experiments were performed to study the effects of three stable flows on the transient hydraulic performance of the PAT during atypical start-up. However, the differences among the three stable speeds and the three stable flow rates (especially the latter) were small; thus, defining the three states as low, moderate, and high flows was wrong. Therefore, a systematic discussion on the effect of considerable speed and flow differences on transient hydraulic performance will be the next step.
Conclusions
The flow and outlet static pressure curves showed a trend of first rising and then slightly decreasing, that is, flow shock and outlet static pressure shock occurred. With the increase in the stable operation speed of the PAT, the impact phenomenon of the outlet static pressure presented a delaying trend.
The dimensionless head and flow coefficients had a maximum value at the initial stage of the atypical start-up process and then rapidly dropped to the minimum value before slowly rising to the final stable value. The dimensionless power coefficient had a maximum value at the initial stage of atypical start-up and then rapidly dropped to the final stable value.
The dimensionless head and flow coefficients were related to the speed and flow rate, whereas the dimensionless power was independent of them.
Footnotes
Handling Editor: Chenhui Liang
Author contributions
Yu-Liang Zhang carried out the performance experiments and wrote the manuscript; Yan-Juan Zhao analyzed the turbine characteristics. All authors have read and agreed to the published version of the manuscript.
Declaration of conflicting interests
The author(s) declared no potential conflicts of interest with respect to the research, authorship, and/or publication of this article.
Funding
The author(s) disclosed receipt of the following financial support for the research, authorship, and/or publication of this article: The research was financially supported by the National Natural Science Foundation of China (Grant Nos. 51876103, 51976202).
Data accessibility
The data used to support the findings of this study are available from the corresponding author upon request.