
Abstract
This study employed different molding parameter combinations, the Taguchi method, ANOVA, and response surface methodology to perform experiments. Finite element analysis was executed to find the optimum molding parameters and increase the depth of drawing molding. The material is aluminum alloy 6016, and the servo press was adopted for the experiments. The factors influencing the drawing molding including punch fillet radius, die fillet radius, die clearance, molding curve, and mold temperature were determined. To find the optimum combination of parameters and to design 16 experimental combinations, the L16 orthogonal array of the Taguchi method was employed. According to the experimental results, the optimum parameters include punch fillet radius of 8.5 mm, die fillet radius of 8.5 mm, clearance of 1.5 t, curve 3, and the mold temperature of 20°C. Using the optimum parameter combination the molding depth could be increased greatly and the thickness ratio could be improved.
Introduction
The drawing die can be used for mass production. This method reduces the machining time and is cost-effective. In recent years, many 3C products are made by punch forming. The punch forming is classified into shearing, folding, drawing, compression, and crimping types. Many metal products have been replaced by plastic products due to the lower costs. To improve the current condition the quality of products and the manufacturing technology must be upgraded.
This study employed DEFORM 3D for finite element analysis, the Taguchi method, and response surface methodology to work out the combination of optimization parameters. According to this study, the strain condition of the material bottom fillet in the drawing process is known, and the parameters are optimized. Reduce production problems in the stretching process and avoid product fracture and necking, saving time, and product cost.
Differing from the conventional punch press, variable motion stroke is set up through the servo press. The variation trend of material thickness and ultimate draw ratio are observed and the tensility higher than connecting rod actuation is obtained.1–3 Then, the moldability for material draw ratio in different conditions is analyzed. The flow of material, drawing ratio, and load are discussed. It is substituted in Coulomb friction coefficient for simulation and the necking and fracture behaviors of sheets are predicted.4–6 The conditions which influence molding in the deep drawing process are discussed by finite element analysis to find out the optimum molding parameters.7–9
Theoretical background
This research mainly uses finite element analysis and servo punch press to carry out the research of drawing forming, and the difference between servo punch press and the conventional punch press, variable motion stroke is set up through the servo press. The variation trend of material thickness and ultimate draw ratio are observed and the tensility higher than connecting rod actuation is obtained.1–3 Then, the moldability for material draw ratio in different conditions is analyzed. The flow of material, drawing ratio, and load are discussed. It is substituted in Coulomb friction coefficient for simulation and the necking and fracture behaviors of sheets are predicted.4–6 The conditions which influence molding in the deep drawing process are discussed by finite element analysis to find out the optimum molding parameters.7–9
Research method
The SOLIDWORKS was employed to draw the molds in different parameter conditions. Then the DEFORM 3D is used for finite element analysis simulation. The Taguchi method and response surface methodology are used to study the servo drawing curve parameter optimization. Molding factors are modified according to the necking ratio of the end product section. The obtained S/N ratio is used for subsequent ANOVA and the response surface methodology is used for analyzing the mold. The obtained optimum geometric parameters of mold are used for mold unloading. The test mold is stamped to validate the prediction feasibility of analytical software. The finished product design diagram is shown in Figure 1. The round cup drawing simulation die is shown in Figure 2.

Finished product design diagram (mm).

Round cup drawing simulation die.
Punch fillet (rp)
In the drawing process, when the fillet at the bottom of the punch is small, the drag at the fillet is increased and the drawn sheet corner is thinned even fractured. 10 However, if the punch fillet is too large, the flange crumpling plate constraint is increased and the blank sidewall is likely to wrinkle. The punch fillet is calculated by the following equation:

t = Sheet thickness (mm), rp = punch fillet (mm).
Die fillet (Rd)
The size of the die fillet can influence the quality of the end product. 10 When the radius is small, the sheet is deformed and can be fractured in the drawing process. The die fillet radius is calculated by using the following equation:

t = sheet thickness (mm), D = material diameter (mm), d = die cavity diameter (mm), Rd = die fillet (mm).
Die clearance
The diameter difference between the punch and die is the clearance between them. 10 To enable the material to flow in the clearance smoothly, the clearance is usually larger than the sheet thickness. The general clearance value is 1.05–1.25 t.
Servo stamping curve
The stamping speed and travel time of the conventional crank punch press cannot be specified by the user. Therefore, the optimal punch stroke curve cannot be provided for different products. The servo press can implement the fast-to-slow drawing action. Fast SPM (strokes per minute) is given in the initial stage of drawing and the slow SPM is given when the forming depth of drawing is approached. It is favorable for increasing the forming depth and accuracy. The traditional drawing curve and servo drawing curve are shown in Figures 3 and 4.3,11

Constant velocity stamping curve.

Variable speed stamping curve.
Finite element analysis
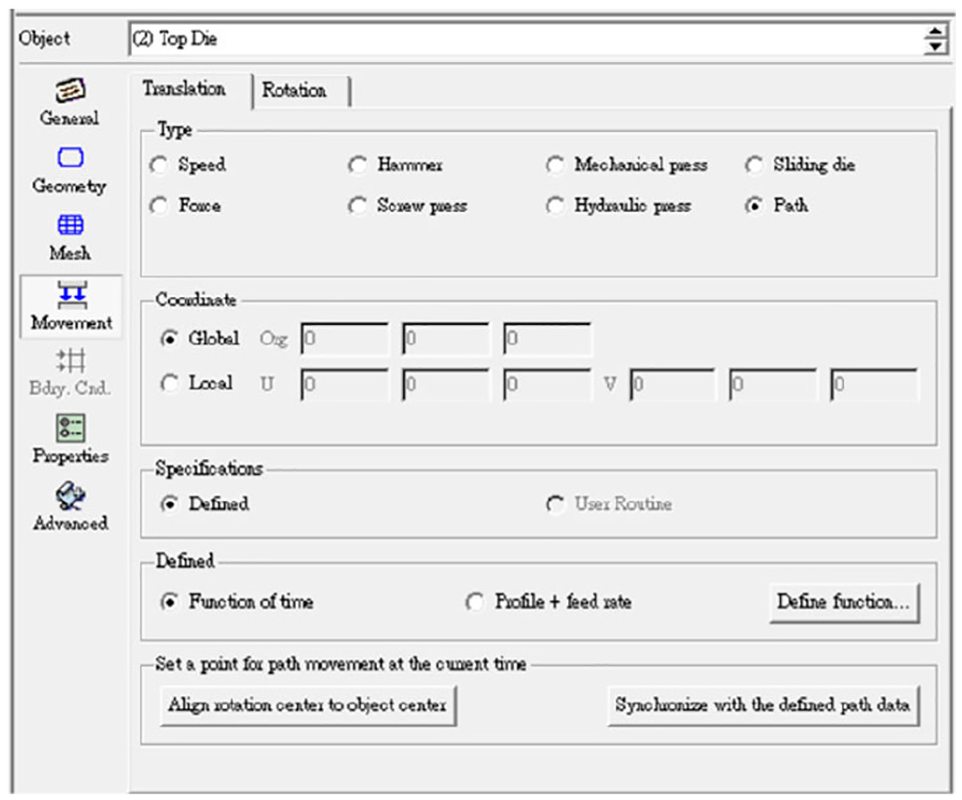
Before performing wired element analysis, it is necessary to draw the analysis model with SOLIDWORKS drawing software, and import the STL file of the model. This time the analysis model list is shown in Figure 5, and the material property of the workpiece is set to plastic. The analysis of plastic processing is shown in Figure 6, and the mesh setting value is appropriate. When the number of meshes is increased but the analysis value does not change, continuing to increase the number of meshes will increase the analysis time. Here we take 80,000 as the mesh shown in Figure 7. Except for the workpiece, the rest of the material properties are rigid. The blessing curve setting of the punch is the function of using the path, and the custom coordinate function is shown in Figures 8 and 9. The action mode of pressure plate (object 4) is constant, the value is 817 N, as shown in Figure 10. The friction setting uses Coulomb friction and the value is 0.01, as shown in Figure 11. Plastic processing uses Coulomb friction, and constant shear friction is suitable for the analysis of forging processing. After the part is defined, the simulation setting is performed. According to the number of steps designed to define the total number of steps for analysis. The set value is 12 steps, and each 0.5 s is one step, as shown in Figure 12. And stop setting the use time definition, when the set value is 6 s, it stops as shown in Figure 13. The mold temperature setting value is 20°C as shown in Figure 14, and the simulation setting can be completed.

Analysis model list.

Material property of the workpiece.

Workpiece mesh.
Sevro curve setting.

Path function.

Pressure plate setting value.

Coulomb friction value.

Simulation setting(a).

Simulation setting(b).

Mold temperature setting.
Results and discussion
The selection of quality characteristics can indirectly influence the quality of products. The ideal drawing depth closer to the predetermined target value is better. Minimal material strain shall be reached to avoid the material being fractured before the target value is reached. In this study, the quality objective is to have a smaller material wall thickness strain of aluminum alloy round cup. The quality characteristic used in this study is the Small-the-Best characteristic. The Small-the-Best characteristic is expressed as follows:

Referring to Dwivedi and Agnihotri,
12
five control factors and four levels are selected. The orthogonal array L16
Material properties.

Control factor level. 11

Drawing curve.

Strain and S/N ratio.

The response value of each factor to the S/N ratio and the factor response diagram can be obtained indirectly according to the values presented in Table 4. The response table and response diagram of each factor to S/N ratio are shown in Table 5 and Figure 15. According to the Taguchi quality Small-the-Best characteristic, the larger the value of the S/N ratio is, the better is the quality of products. According to the response table of Table 5, the optimal factor levels are A3, B4, C4, D3, and E1. The punch fillet is 7.2 mm, the die fillet is 8 mm, the die clearance is 1.5 t, the drawing curve is Type 3, and the mold temperature is 20°C.
Response table of each factor to S/N ratio.

optimal factor levels are in bold.

Response diagram of each factor to S/N ratio.
As the Effect in Table 5 is the factorial effect analysis value, the influence of each factor on the experimental results can be calculated. The larger the value of the effect has the greater influence on the entire experiment. Therefore, Factor B (die fillet radius) has a greater influence on the strain of drawing, and the Factor E mold temperature has a milder influence on the strain.
In the experiment for evaluating errors, the factors with less contribution are disregarded. The S/N ratio variation analysis is performed for influential factors, and then the second S/N ratio variation analysis is performed. Table 6 shows the result of the first S/N ratio variation analysis. According to the Variance in Table 6, the value of Factor E (mold temperature) is lower than the other factors. Therefore, Factor E is classified as unimportant and then the second ANOVA is performed. The assay values are shown in Table 7.
First S/N ratio variation analysis.

Second S/N ratio variation analysis.

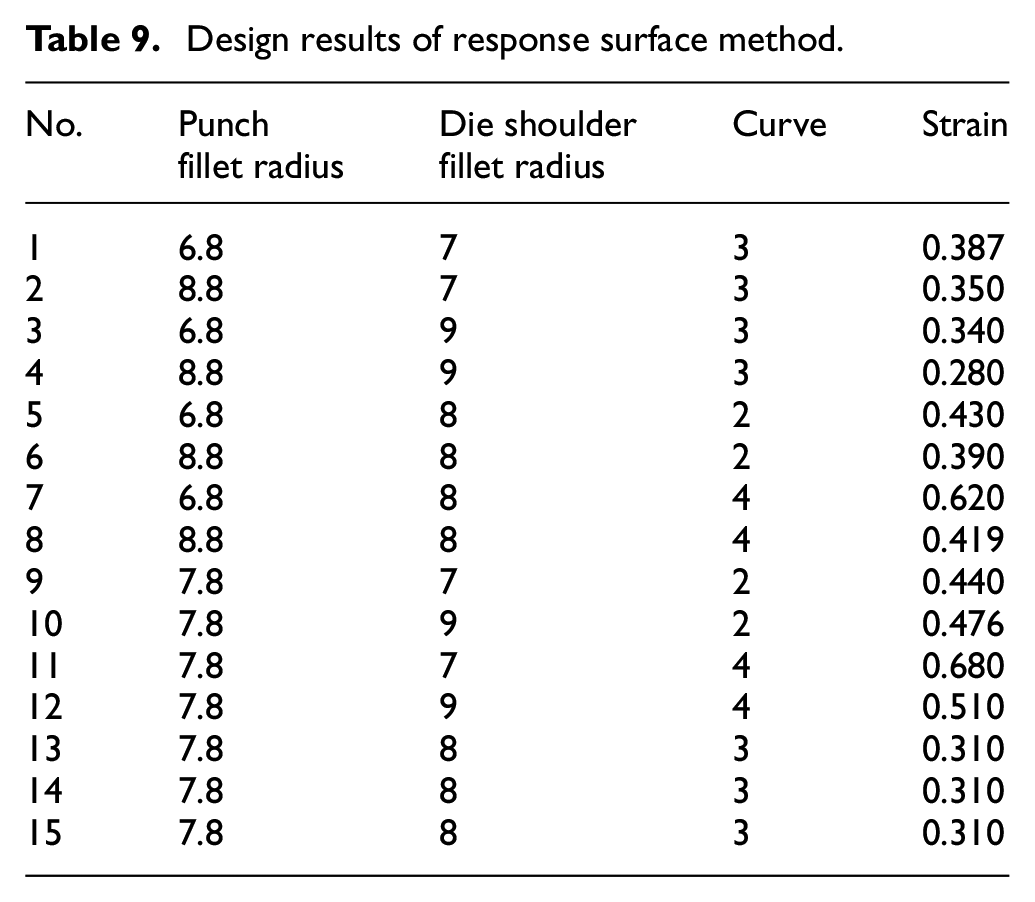
According to ρ%, the Factor B (die fillet) has a greater influence on the overall experiment and the least influential factor is Factor C (die clearance). Factor A, Factor B, and Factor D conform with 98% confidence. This means that these factors are very influential. According to the result of the second variation analysis, three factors with the highest F value are used as the design criteria of response surface methodology. These factors are Factor A punch fillet (X1), Factor B die fillet (X2), and Factor C curve (X3). The three factors are designed as three levels. Box-Behnken Design (BBD) is used for experimental design, as shown in Table 8. The experiment data are shown in Table 9.
Response surface method (RSM) level parameter design.

Design results of response surface method.
The variables and interactive variables in Table 10 are added up to obtain the multiple regression equation, expressed as follows. The p-value can be observed in Table 10 regression model coefficients. When the p-value is smaller than 0.05, meaning the variable has a relatively significant influence on the overall experimental results. The p-values of X1 × X3 and X2 × X3 are smaller than 0.05. This means that the interaction between X1 (punch fillet) and X2 (die fillet) and the interaction between X2 (die fillet) and X3 (curve) are significant for the overall experiment. The contour line that is, response surface diagram is drawn according to the regression model coefficients, as shown in Figure 16.
Y = 1.56 + 0.338X1 − 0.612X2 + 0.104X3 − 0.016X1 × X1 + 0.046X2 × X2 + 0.171X3 × X3 − 0.006X1 × X2 − 0.040X1 × X3 − 0.052X2 × X3
Regression model coefficients.

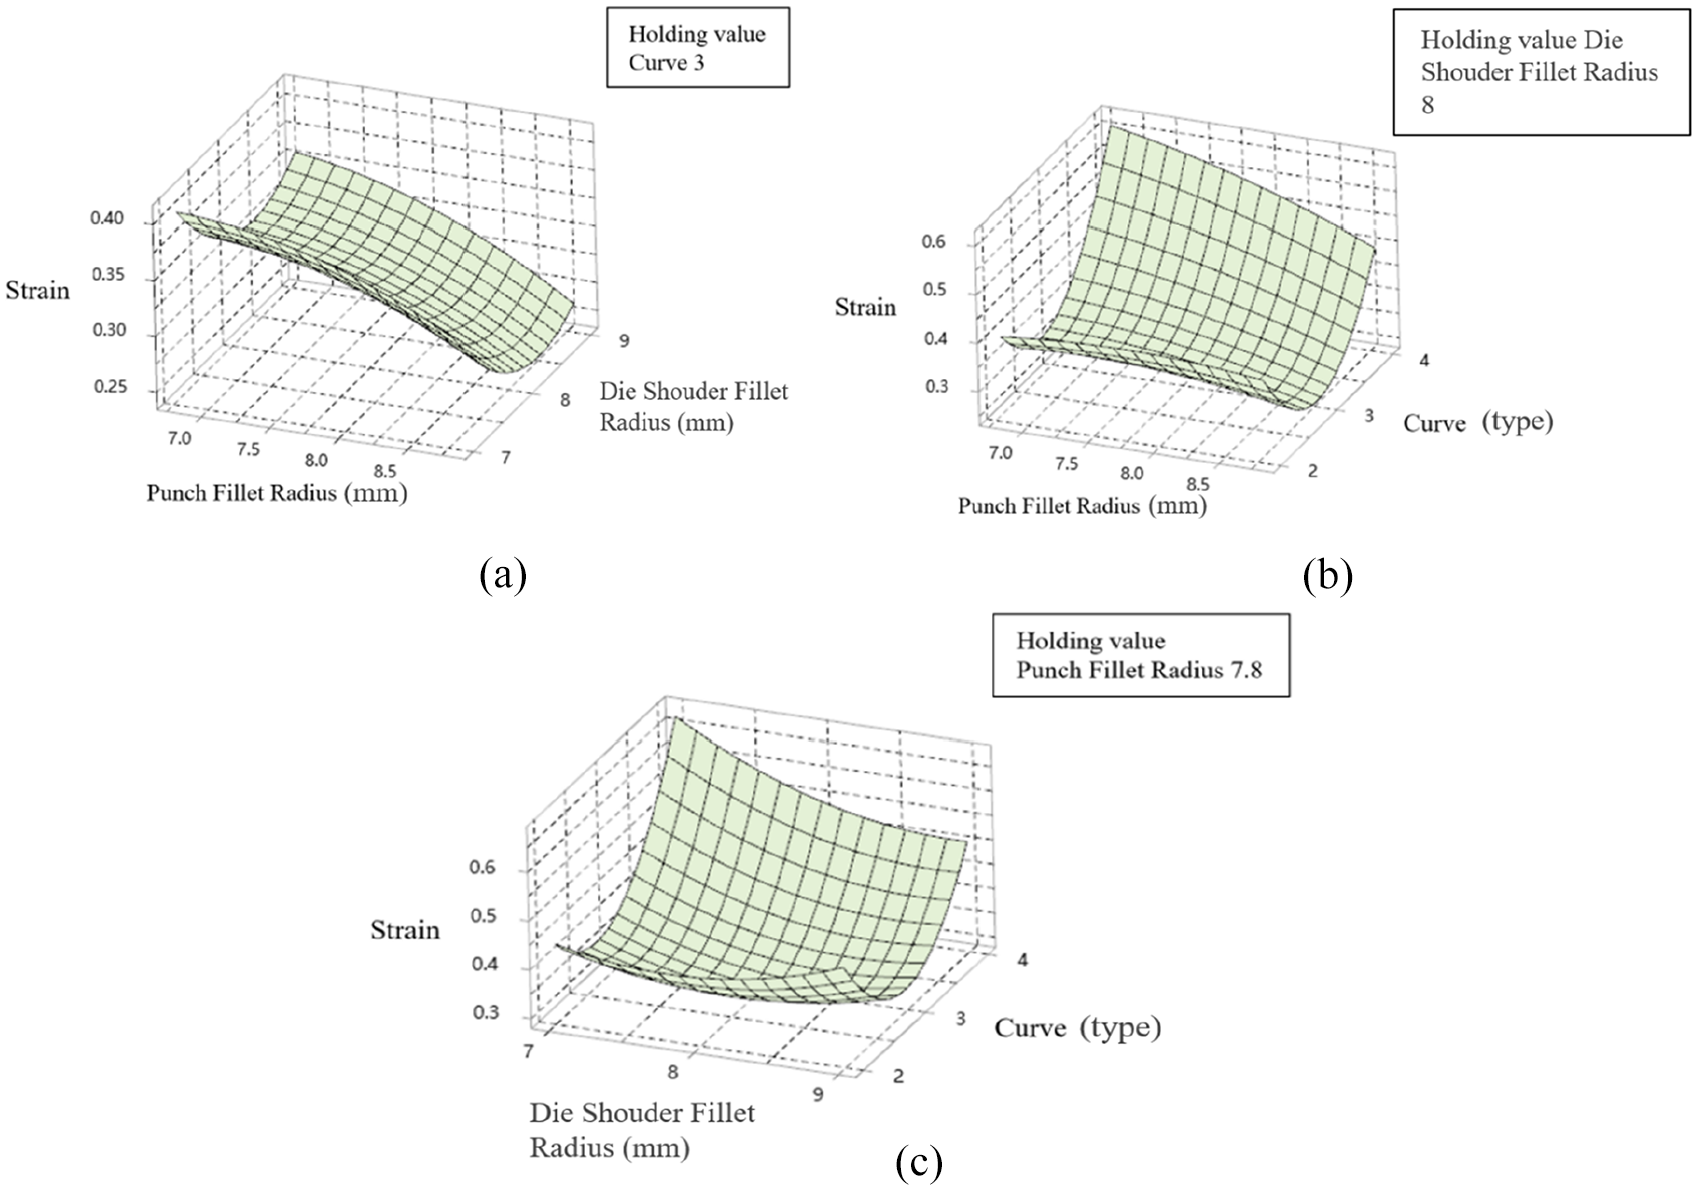
Factor contour diagrams: (a) strain, punch fillet radius, die shouder fillet radius; (b) strain, punch fillet radius, curve; and (c) strain, die shouder fillet radius, curve.
As shown in Figure 16(a), the strain is at its minimum when the holding value is a drawing curve. The die fillet is at 8 mm and the punch fillet is at 8.5–9 mm. As shown in Figure 16(b), the strain is at its minimum when the holding value is die fillet. The curve is between 2 and 3 and the punch fillet is between 7 and 7.5 mm. The strain increases as the curve approach 4. As shown in Figure 16(c), the strain decreases when the holding value is punch fillet and the die fillet is at 7.8–8 mm, but after 8 mm the strain increases with fillet.
Figure 17 shows the strain of optimum parameters of RSM. These optimum parameters of RSM are used for mold unloading, the mold is shown in Figure 18. Molding parameters of RSM are used for drawing, as shown in Figure 19. The drawing parameters of RSM are shown in Table 11. After the drawing process is completed, the finished product is cut open from the midst. This is to measure the variance in the sheet thickness of the transverse section, as shown in Figures 20 and 21. The measured values of the actual drawing are compared with the analysis result, as shown in Table 12.

Effective strain diagram.

Mold assembly diagram.

Actual drawing.
Response surface method parameter table.


Section view.

Actual measurement point.
Thickness comparison table.

Conclusion
The influence of various factors on the experiment can be worked out according to the orthogonal array of the Taguchi method and S/N ratio. The influential factors are found out by ANOVA. According to the experimental results, the main influential factors include A punch fillet, B die fillet, and D curve. The contributions are 31.9 %, 32.9 %, and 25 %, respectively.
According to the results of the Taguchi method and RSM, the optimum parameters of RSM are better than the optimization parameters of the Taguchi method alone. The parameters of RSM will be used for drawing tests during mold testing. The strain resulted from optimization parameters is 0.231. It is compared with the measured value, proving the parameters of RSM are reliable.
According to the research results, using the servo stamping curve with appropriate punch fillet and lower die fillet for extension can effectively reduce the change in product thickness. It can be found that when the number of changes in the punch speed curve increases, the strain will decrease. When the number of changes reaches the fourth time, the strain begins to increase again, because the more the number of changes, the stroke (SPM) of the punch will gradually decrease, and the friction between the pressure plate and the workpiece will increase, resulting in the material cannot flow smoothly. Into the mold cavity, the material begins to be stretched and becomes thinner.
Based on the above conclusions, it can be known that the contribution of mold temperature and mold clearance to the entire experiment is relatively low. Therefore, the important factors of the drawing are the punch fillet, the die shoulder fillet, and the drawing curve. And because ANOVA and RSM use the values obtained by Taguchi method and further analysis and simulation, the result parameters will be better than Taguchi experiment method, and finally use the parameters obtained by RSM for actual experiment and verification, the results are reliable.
Footnotes
Handling Editor: Chenhui Liang
Declaration of conflicting interests
The author(s) declared no potential conflicts of interest with respect to the research, authorship, and/or publication of this article.
Funding
The author(s) received no financial support for the research, authorship, and/or publication of this article.