
Abstract
It is a trend to implement weight reduction in parts in recent years when developing a new car. This trend is because weight reduction is essential to respond to tightening environmental regulations. In other words, parts manufacturers of body, chassis, and power train systems have made considerable efforts to reduce weight from the proto design stage. This study performed structural analysis and optimization for weight reduction of a propeller shaft for a passenger car. The natural frequency and the durability of the developing propeller shaft were examined through finite element analyses and tests. Then, optimization was accomplished by focusing on the weight reduction of the tubes made of given steel material. In this process, the metamodel-based optimization technique, kriging interpolation, was applied, and the weight was reduced by 5.3% based on the propeller shaft and 14.1% based on the tube. ANSYS Workbench was used for structural analysis, an in-house program was used to build the kriging model, and MATLAB was used for optimization.
Introduction
In the recent development of new cars, eco-friendly vehicles such as EV (electric vehicle), HEV (hybrid EV), PHEV (plug-in HEV), and FCV (fuel cell vehicle) are attracting attention to respond to the strengthening regulation of each country. However, internal combustion engine cars still occupy a high proportion. According to the International Energy Agency(IEA), 1 some developed countries are expected to phase out internal combustion vehicles from 2030 to 2050, but according to a recent Wood Mackenzie report, 2 the share of internal combustion engine (ICE) vehicles is still expected to account for 44% of the world in 2050. Therefore, carmakers manufacturing ICE vehicles should respond in design and manufacturing to meet the strengthening laws and regulations.
This study proposes a lightweight design process included as part of the development phase of a propeller shaft to be installed on an ICE vehicle. The weight reduction of vehicles is directly linked to fuel economy improvement and plays a crucial role in reducing harmful gases. The propeller shaft transmits the driving torque generated from the engine to the wheels by connecting the transmission and the front/rear axles in rear and four-wheel drive vehicles.
Recent studies on propeller shafts suggest designs by applying case studies or optimization techniques that consider vibration and strength performance. Li et al. 3 used a reliability-based optimal design technique that considers structural performance and suggested the discrete design of the tube. Hu et al. 4 combined the anisotropic properties of composite materials and analyzed the force conditions of the drive shaft made of composite materials with classical mechanics considering torque direction. James Prasad Rao et al. 5 investigated the strength through finite element analysis when steel materials were replaced with composite materials such as carbon-reinforced plastics (CFRP) and glass fiber reinforced plastics (GFRP). In addition, there are several studies6–8 that try to reduce the weight of the propeller shaft or the drive shaft using composite materials. Kuk et al. 9 performed research on improving vibration characteristics at its initial design stage, and Moon et al. 10 and Sim et al. 11 proposed a design considering the strength of the spider and yoke components of the propeller shaft system. Each study has contributed but does not include durability, which is one of the critical performances.
The propeller shaft, which is the subject of this study, is a component of a five-seater passenger car. 12 This propeller shaft is made of steel and consists of a front tube, a rear tube, a center bearing assembly, etc. The front and rear shafts of the propeller shaft are made of tubes, which are hollow shafts for weight reduction. A part supplier that manufactures this product has empirically determined these tube’ thicknesses and investigated structural performances through tests. The propeller shaft reviewed in this study focuses on the front and rear tubes for its lightweight design. The conventional approach first designed the propeller shaft, and then finite element analyses and tests for structural performances such as natural frequency and durability were performed in parallel. This process belongs to the prototype development phase. Besides, a lightweight design was proposed that sets the lengths and thicknesses of the front and rear tubes of the propeller shaft as design variables and satisfies the specified criteria for natural frequency and fatigue life.
The finite element model of the propeller shaft is composed of solid elements. The design variables are the thicknesses and lengths of the tubes, so this corresponds to the shape optimization category that is very difficult to perform optimization. The optimization technique applied in this process is the metamodel-based optimization method13–17 called the kriging interpolation method. The weight of the proposed optimal solution was reduced by 5.3% to the total weight of the propeller shaft and 14.1% when considering the tube alone. ANSYS Workbench was used for natural frequency and fatigue analyses, an in-house program was used to build the kriging model, and MATLAB was used for optimization.
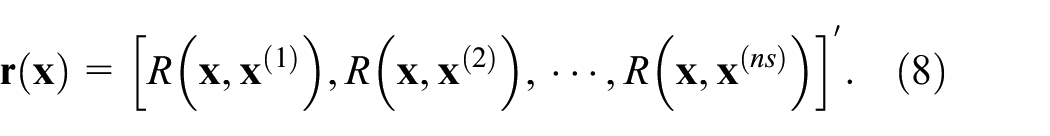
Initial design and flow of this research
The propeller shaft consists of a front tube, a rear tube, a center bearing assembly, a swaged tube, a sliding outer, forks, and yokes. The propeller shaft rotates at high speed while receiving a load, so the tubes are made of steel pipe, and the sliding outer and the yoke are made using high-frequency heat treatment to increase the strength. The center bearing assembly in contact with the inner yoke is attached to the vehicle body. It serves to improve ride comfort in bouncing mode while maintaining the front and rear tubes horizontally. Friction welding is used to connect each part, which may affect durability depending on the weldability, but this study did not consider this. The initial CAD model of the propeller shaft is shown in Figure 1(a). The finite element model in Figure 1(b) consists of 1,515,770 nodes and 917,727 elements with the ANSYS element types of solid186 and solid187 using the Hex Dominant Method of ANSYS Workbench. The element size is about 4 mm. The inner contact with the center bearing and tube yoke is treated as contact elements to allow the shaft to rotate. Then, the element type CONTA174 and the element type TARGE170 are used to consider the contacts in ANSYS.
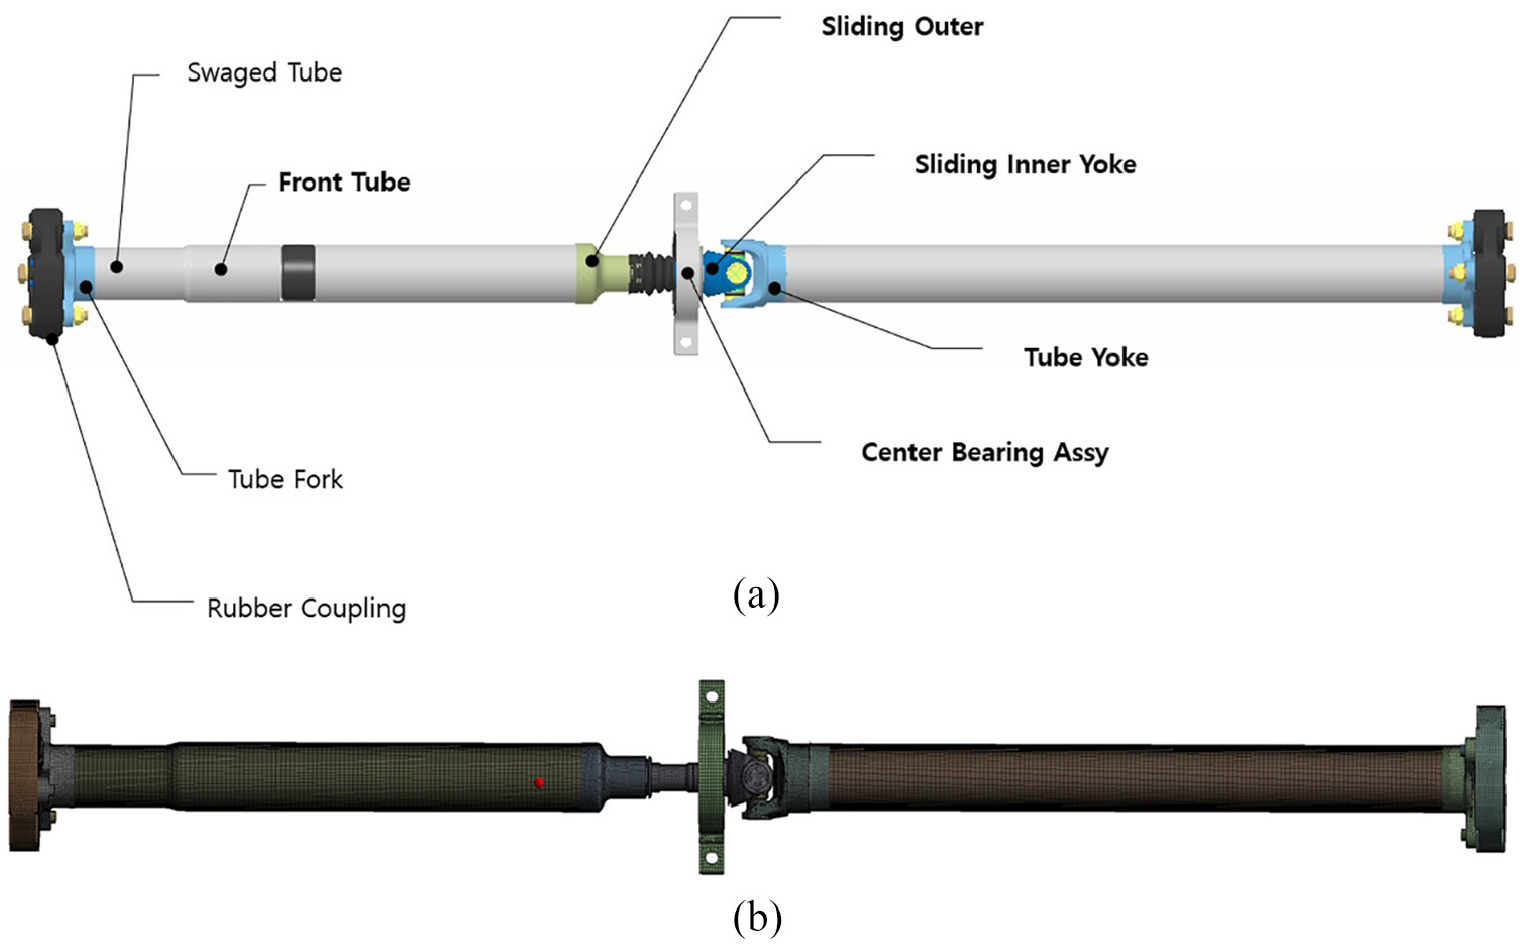
CAD and finite element models of the propeller shaft: (a) CAD model and (b) FE model.
The overall procedure of this research is shown in Figure 2. The initial design is completed as shown in Figure 1(a) using CATIA. The part manufacturer that has developed and produced propeller shafts for many years determined the base design empirically. When the prototype design is suggested, finite element analysis is performed based on this. The structural performances to be reviewed are the natural frequency and durability. At the same time, a prototype is made, and the natural frequency and durability tests are performed. The finite element analysis and test results are compared and investigated, and if the two results do not differ within the acceptable range, the finite element model is confirmed. As a final step, an optimization is performed to minimize the weight of the propeller shaft with the validated CAE model. In this process, a metamodel-based optimization technique was applied. 12

Overall research process.
Structural analysis and test
The structural responses reviewed in the prototype design phase of the propeller shaft are the natural frequency and durability. In a structure, the natural frequency is a unique property determined by the distribution of mass and stiffness. It must be examined to decide whether or not it is close to a resonant frequency. In a passenger car equipped with a four-cylinder and four-stroke engine, the frequency at the idle speed is 25 Hz at 750 rpm, and if the maximum speed is 6000 rpm, the corresponding frequency is 200 Hz. The finite element analysis for predicting the natural frequency of the prototype of the propeller shaft was performed using ANSYS/Workbench, and the impact hammer test was carried out. 12
The propeller shaft is consistently subjected to torsional loads while driving a car. Therefore, it is essential to review the durability performance against a cyclic load of torsional load in the development stage. The laboratory durability test condition applied by the part manufacturer was used to obtain the fatigue life. ANSYS/workbench was used for the fatigue analysis of the propeller shaft, and the durability test machine owned by the part manufacturer was used for the fatigue test.
Natural frequency analysis and test
As boundary conditions for natural frequency analysis and test of the propeller shaft, all degrees of freedom of the outer surfaces of both ends of the coupling were constrained, and the degrees of freedom of displacements of the central bearing were fixed. In the test, the accelerometers were attached to 10 places from P1 to P10, as shown in Figure 3(a). The frequency response function through the test was obtained as shown in Figure 3(b), from which it can be seen that the first frequency is 36.8 Hz, the second frequency is 231.2 Hz, and the third frequency is 308.8 Hz. And the mode shape corresponding to each natural frequency is sequentially displayed in Figure 3(c). 12

Test for natural frequency: (a) accelerometer mounting location, (b) frequency response function result (first frequency 36.8 Hz, second frequency 231.2 Hz, third frequency 308.8 Hz), and (c) mode shape of each frequency.
In Figure 3(c), the mode shape corresponding to the first frequency is the bounce mode, a rigid body motion. The displacements at both ends and center bearing are different in the rigid body motion due to the difference in stiffness of the rubbers attached in the couplings and the center bearing. Therefore, excluding the first frequency corresponding to the rigid body motion, the second frequency becomes the first natural frequency. In this frequency, as shown in the second of Figure 3(c), the front tube and the rear tube have bending mode in the vertical and opposite direction around the center bearing that serves as the nodal point. The third frequency, which becomes the second frequency, is that the front tube and the rear tube have bending mode in the same vertical direction. The specified design criterion for the first natural frequency is 200 Hz or more, so the initial design satisfied this.
ANSYS/Workbench was used to calculate the natural frequency of the propeller shaft, and the same boundary condition as the test condition is given. The results from finite element analysis are summarized in Figure 4. 12 Like the test, the second natural frequency becomes the first natural frequency actually, except for the first natural frequency of Figure 4(a), which is a rigid body mode. In the first mode of Figure 4(b), the front tube and the rear tube are vibrating alternately up and down, respectively, while the second mode in Figure 4(c) vibrates in the same direction based on the center bearing. All three modes have the same shapes as the test results. If the test result is regarded as an exact solution, the second frequency, which is the actual first frequency, has an error of 3.5%, and the third frequency, which is the actual second frequency, has an error of 6.3%. Since this is an acceptable error, it can be concluded that the CAE model of this study is valid considering the natural frequency.

CAE result for natural frequency: (a) first frequency (45.8 Hz), (b) second frequency (239.2 Hz), and (c) third frequency (328.2 Hz).
Fatigue analysis and test
If the propeller shaft does not meet the durability requirement and is fractured, it may damage other parts or cause a significant accident. Therefore, it is essential to investigate the durability performance in the development stage. In this study, test and finite element analysis were conducted in parallel to confirm the durability performance. The load condition for the rig test is to apply a torsional load of 100–1460 N m at a constant frequency. 12
The torsional fatigue test machine is shown in Figure 5(a). The test machine is a device that applies a cyclic load to the other end while fixing the coupling of the propeller shaft at one end using a jig, also fixing the center bearing. Fatigue tests were performed on three prototypes, and the fatigue lives were recorded as 5.1951 × 10⁵ cycles, 5.7523 × 10⁵ cycles, and 5.0715 × 10⁵ cycles, respectively. 12 The fractured prototypes are shown in Figure 5(b) to (d). The left part of the front tube was damaged for the propeller shafts in Figure 5(b) and (d), while the left part of the rear tube was injured in the propeller shaft in Figure 5(c). 12 All three prototypes are at the level that satisfies the criterion for durability.

Torsion test machine and test results for durability: (a) test machine, (b) fatigue life (5.1951 × 10⁵ cycles), (c) fatigue life (5.7523 × 10⁵ cycles), and (d) Fatigue life (5.0715 × 10⁵ cycles).
In this study, the propeller shaft’s fatigue analysis was carried out using the strain-life approach. A fatigue test on the specimens for torque-twist angle hysteresis loop according to ASTM E606 18 should be performed to predict the fatigue life of a propeller shaft. Figure 6 shows the fatigue specimen for the materials such as STKM13B, SM45C, and heat-treated SM45C used in the propeller shaft for the tubes, the fork, and the sliding outer, respectively. Through a series of the performance for cyclic strain-controlled incremental step test and constant strain-amplitude test, the cyclic stress-strain curves and the strain-life curves were obtained. 19
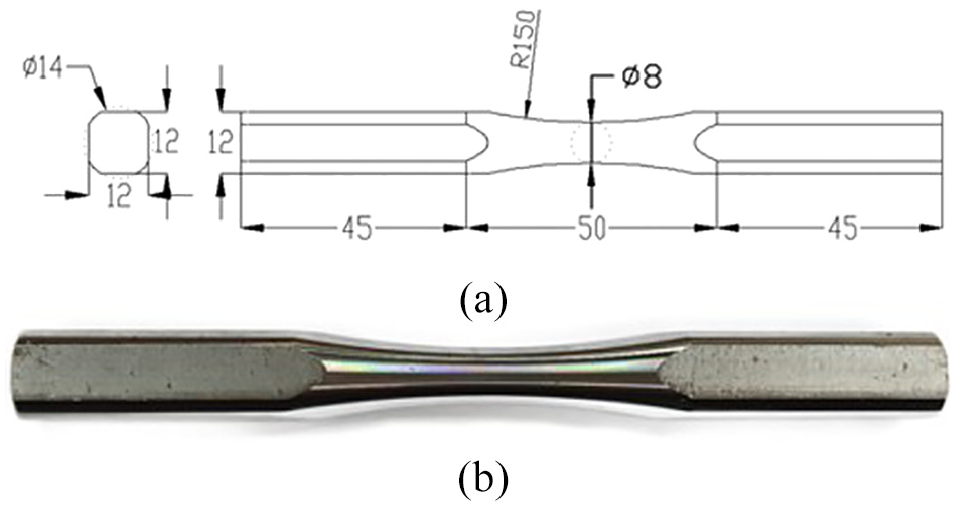
Configuration of specimen (unit: mm): (a) dimension and (b) photo.
The cyclic stress-strain curve subject to torsion is defined by connecting the peaks of the stabilized hysteresis loops for different levels of amplitudes, which is described as20–23
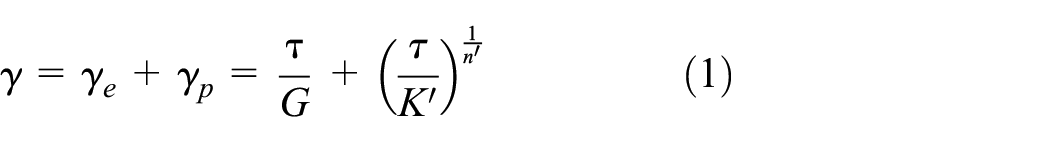
where

where

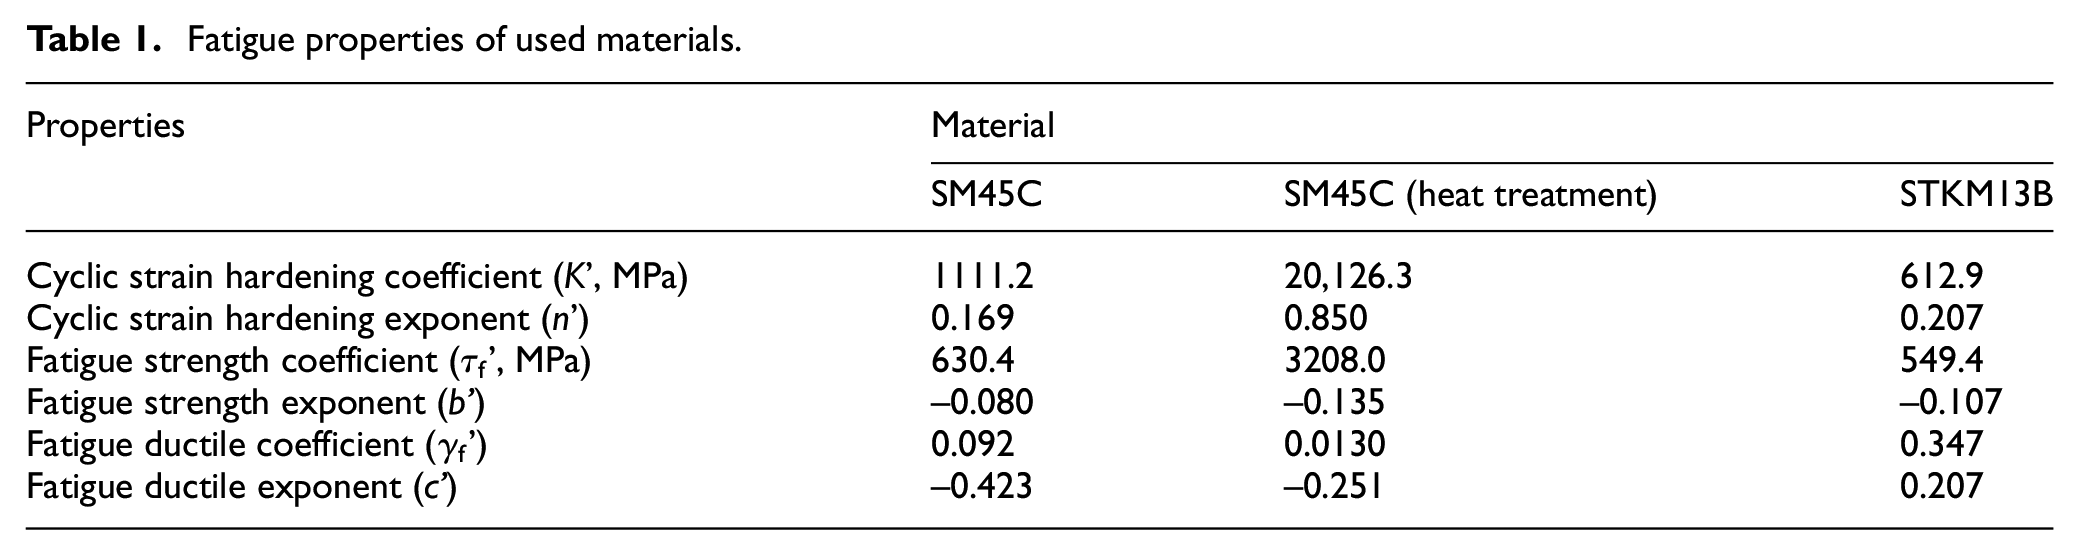
Figure 7 shows an example of the test results for the material of SM45C, and the fatigue properties obtained from the cyclic stress-strain curves and the strain-life curves for each material are listed in Table 1.
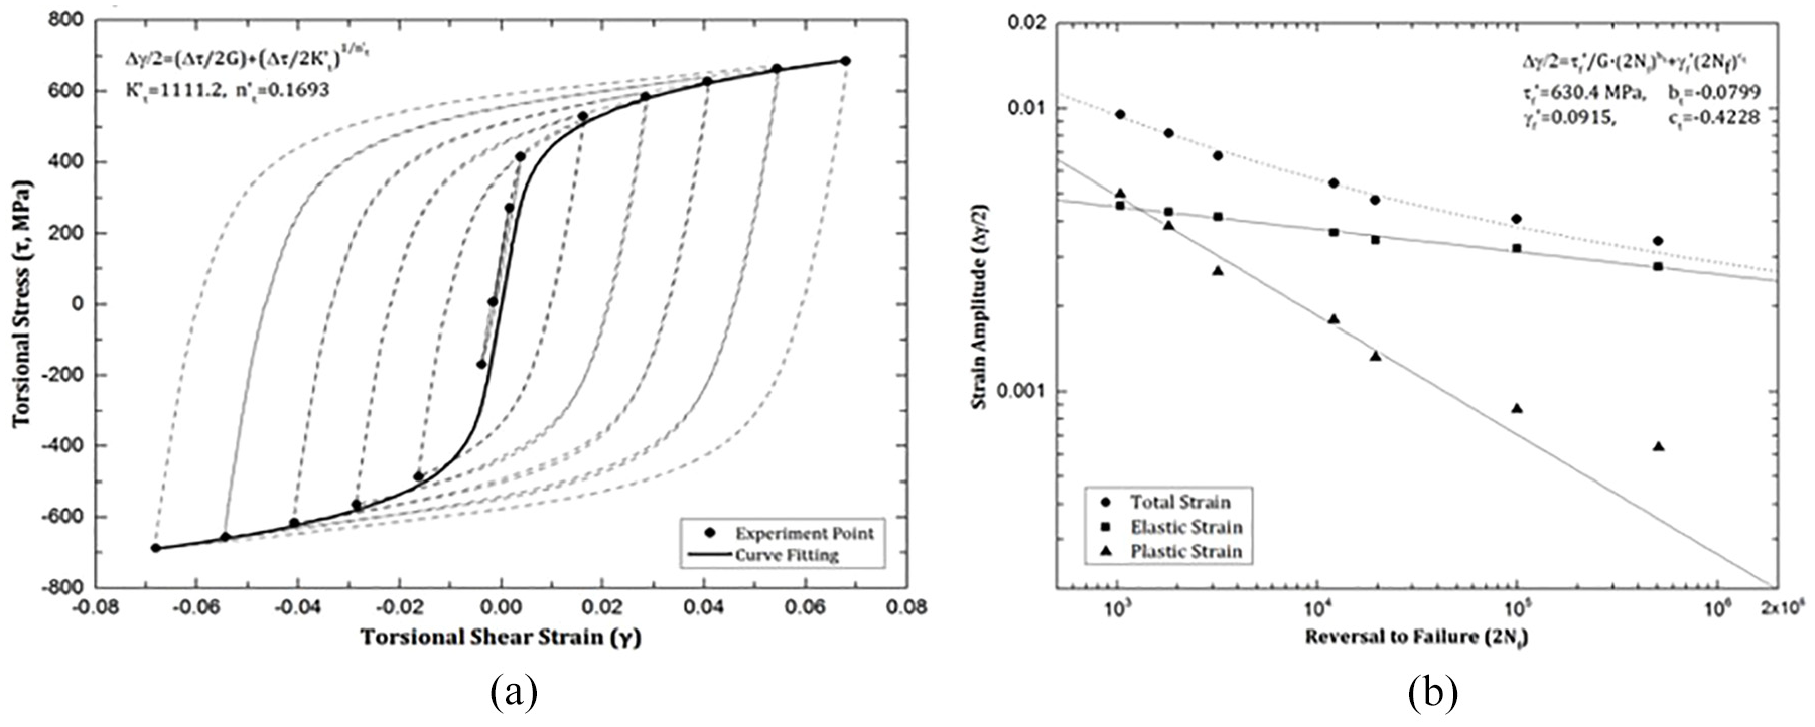
Fatigue test results of SM45C: (a) cyclic stress-strain curve and (b) strain-life curves.
Fatigue properties of used materials.
Fatigue analysis was performed using ANSYS/Workbench, and the load was the same as the test, which was the torsional load of 100–1460 N m at a constant frequency. The boundary conditions of the analysis were also assigned the same as the boundary conditions of the test conditions. In the ANSYS/Workbench option, strain life was set as the analysis type, SWT theory as the average stress method, and equivalent von Mises stress as the stress component was set.
Figure 8 shows the results of fatigue analysis. The fatigue life of the entire assembly shown in Figure 8(a) is 4.4202 × 10⁵ cycles, which is fractured by the spider cap. On the other hand, the tube in Figure 8(b) is fractured at 5.5945 × 10⁵ cycles, the spider in Figure 8(c) is fractured at 7.2061 × 10⁵ cycles and the fatigue life of the inner yoke in Figure 8(d) is 8.8783 × 10⁵ cycles. 12 A roller bearing is mounted around the spider cap on the propeller shaft. In fact, at this time, if the spider is not replaced for an extended period, it will be damaged. However, in the fatigue test of the propeller shaft, the spider cap was assembled in the center bearing assembly, so this could not be confirmed. Except for the spider cap, the test and the simulation show similar results, in which the tube is broken. From the test result in Figure 5, it was found that the crack progressed from the tube side based on the part where each unit was joined to each other in the propeller shaft, that is, the friction welded point. The analysis results in Figure 8 also show similar patterns.
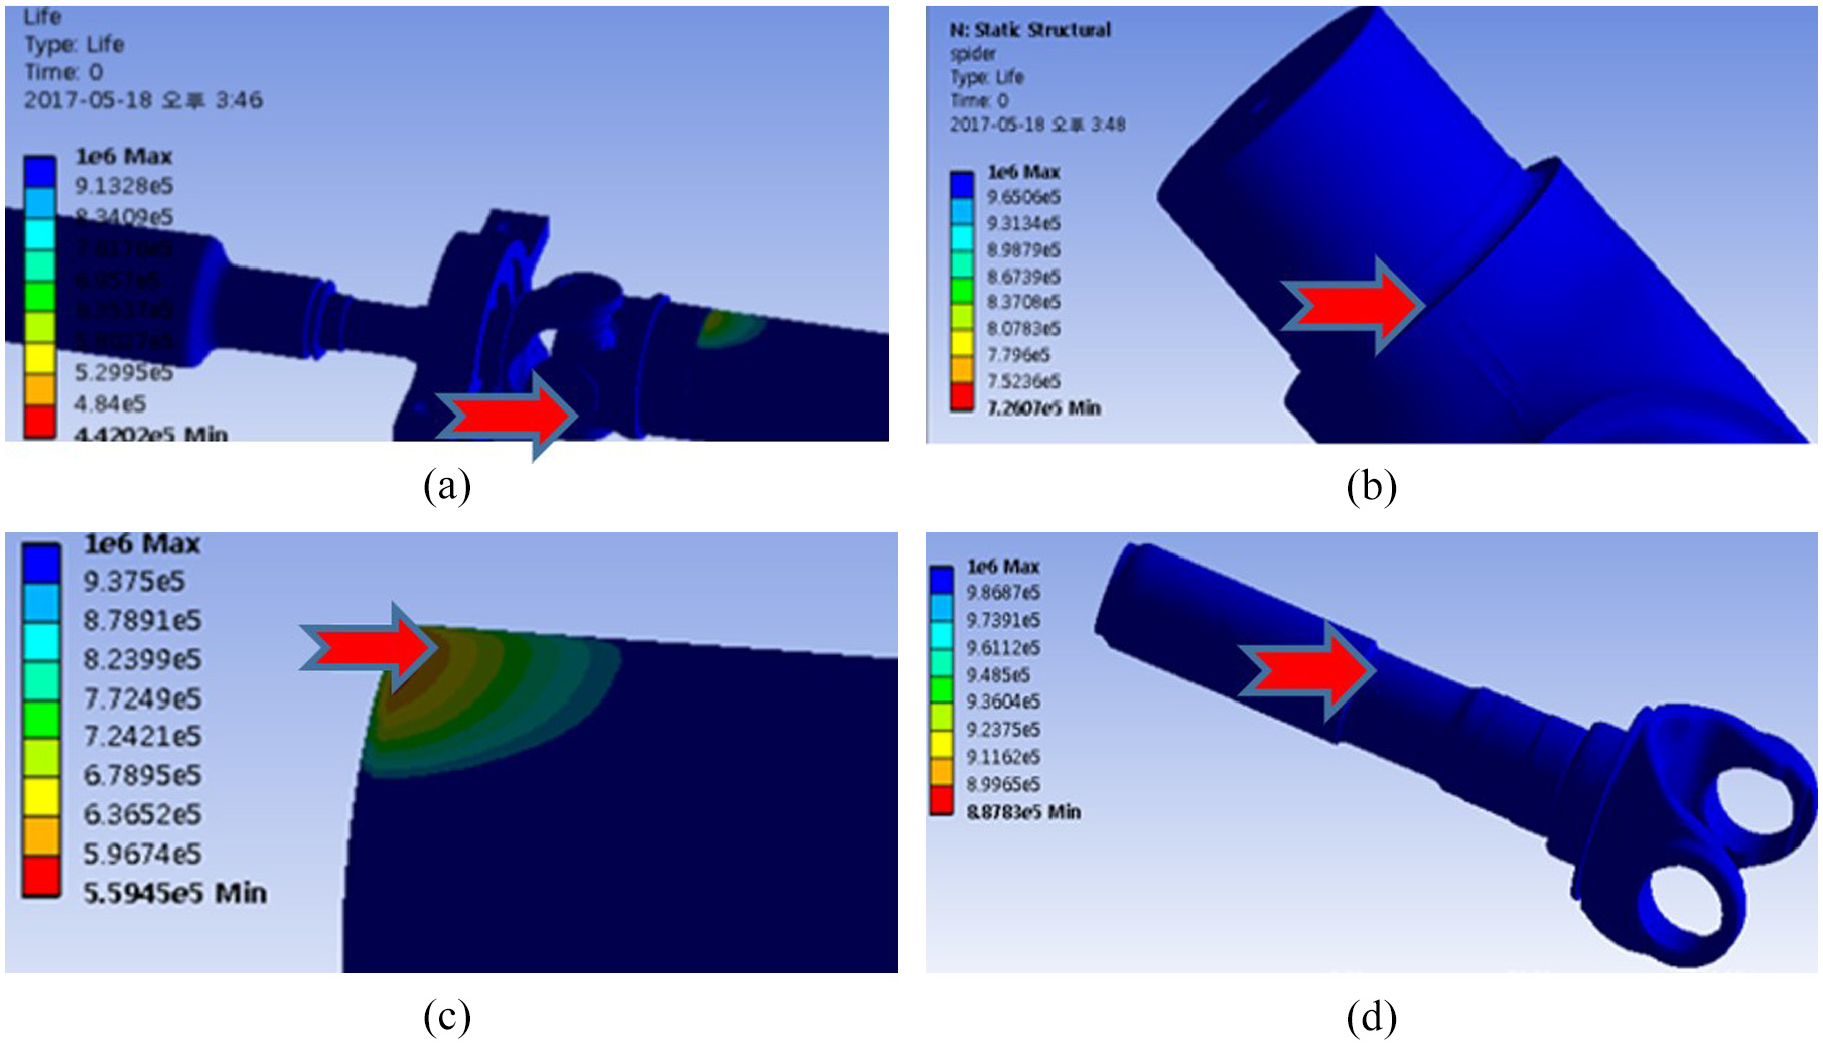
CAE results for durability: (a) assembly (4.4202 × 10⁵ cycles), (b) fatigue life of tube (5.5945 × 10⁵ cycles), (c) fatigue life of spider (7.2061 × 10⁵ cycles), and (d) fatigue life of inner yoke (8.8783 × 10⁵ cycles).
The above-mentioned natural frequency analysis and test results have an error of 3.5% from the first mode. In addition, the analysis and test results of the fatigue life all show similar results: the tube is damaged, and their fatigue lives are about 500,000 cycles except for the spider cap. Therefore, since the analysis model in this study does not show a significant difference from the test result, it can be said that the validity of the finite element model for optimization is secured.
Optimization using kriging interpolation method
It is popular to design the cross-sectional shape of a propeller shaft as a hollow shaft in recent years. The hollow shaft has the advantage of significantly reducing the weight without sacrificing torsional strength significantly compared to the solid shaft. On the other hand, to maintain the same torsional strength as the solid shaft, the outer diameter of the hollow shaft must be increased compared to the diameter of the solid shaft. For this reason, there may be a limit to increase the outer diameter of a tube in consideration of interference between automobile parts. Therefore, in this study, the thicknesses of the front tube and the rear tube and the position of the front tube and the rear tube were selected as design variables to bring more weight reduction.
Since the finite element model of this propeller shaft is composed of solid elements, the structural optimization considering the above three variables belongs to shape optimization. In this study, a metamodel-based optimal design technique was applied to implement an efficient shape optimization. In this process, the kriging interpolation method was selected as a metamodel technique, and the optimization module of MATLAB was used.
Definitions of design variables and design formulation
In the process of optimizing the propeller shaft, the parameters that determine the thicknesses of the front tube and the rear tube, and the lengths of the front tube and the rear tube, which have a significant influence on the weight, were selected as design variables. In Figure 9, the design variable, x1 is the thickness of the front tube, the design variable x2 is the thickness of the rear tube, and the design variable x3 is the length from the reference point,

Design variables for weight reduction.
The formulation for the weight reduction is defined as


where w is the weight of the propeller shaft, f1 is the first frequency, L is the fatigue life, the subscript, a means an allowable value, the design variable vector,
All the design variables affect weight, natural frequency, and fatigue life. Each design variable’s lower and upper bounds were determined by considering interference with other parts and manufacturability. In equation (4), the allowable values for natural frequency and fatigue life were set to 231.2 Hz and 500,000 cycles by considering the responses of the base model, respectively. The allowable value for fatigue life is related to a design requirement set by the company that develops this propeller shaft. The design variable vector of the base model is [1.75 1.6 100] mm, and its weight is 8.701 kg.
Kriging interpolation method and results
Sensitivity analysis is complex, and finite elements may be distorted when using a gradient-based algorithm directly linked with finite element analysis in a shape optimization problem with complex shape variables. Therefore, it is common to solve shape optimization in recent years by applying a metamodel-based optimization technique. In the strategy, the structural responses of interest, such as displacement, stress, natural frequency, etc., are generated as surrogate models called the metamodels. The optimal solution is calculated by linking them with the existing gradient-based algorithm or heuristic algorithm. In this study, the kriging models replaced the weight, natural frequency, and fatigue life of the propeller shaft.
Kriging is an interpolation method named after a South African mining engineer named D. G. Krige, who developed the technique while increasing the accuracy in predicting ore reserves.13–17 Kriging interpolation for an approximate model is well documented in the references. In general, a response function, y(

where δ is a constant, and z(
If

where superscript, ^ means an estimator,

where n is the number of design variables set to 3 in this study, θi (i = 1,…, n) is the unknown parameter, and ns is the number of sample points. By differentiating the log-likelihood function with


When the correlation parameters are determined, an approximated model can be constructed. Similarly to previous estimators, the unknown correlation parameters of θ1, θ2,…, θn are calculated from the formulation as follows13–17:

where θi (i = 1, 2,…, n) > 0. In this study, the lower and upper bounds of each θi are set to 0.01 and 20, respectively. The above process was implemented using the in-house program. The formulation of equation (4) is replaced as
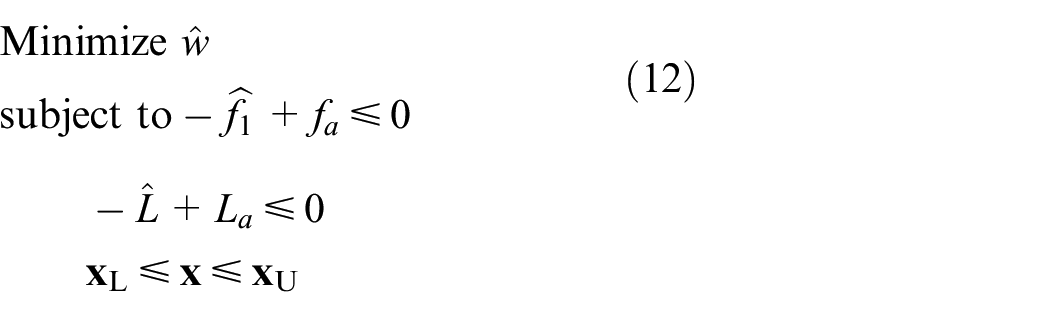
where ^ means an estimator of each response value, and it is obtained by the kriging interpolation method.
Figure 10 summarizes the process of generating an approximate kriging model and finding an optimal solution based on it. MATLAB was used to generate sample points, an in-house program was used to create kriging models, and the genetic algorithm in MATLAB was used for the optimal solution of equation (12). In the genetic algorithm, the default option was selected in MATLAB. To build a metamodel, sample points must be defined first. In this study, the command of MATLAB, lhsdesign (30,3, “Criterion,”“Maximin”), a method of Latin hypercube design, was used. Table 2 shows 30 sample points, which are design points determined through the Latin hypercube design within the range of design variables in equations (4) and (12) using the lhsdesign. The number of sample points was determined empirically by referring to existing studies.14–16 For each sample point, natural frequency analysis and fatigue analysis were performed through finite element analysis, and the results are summarized in Table 2.

Interface between in-house program and MATLAB.
Design of experiments using the Latin hypercube design.

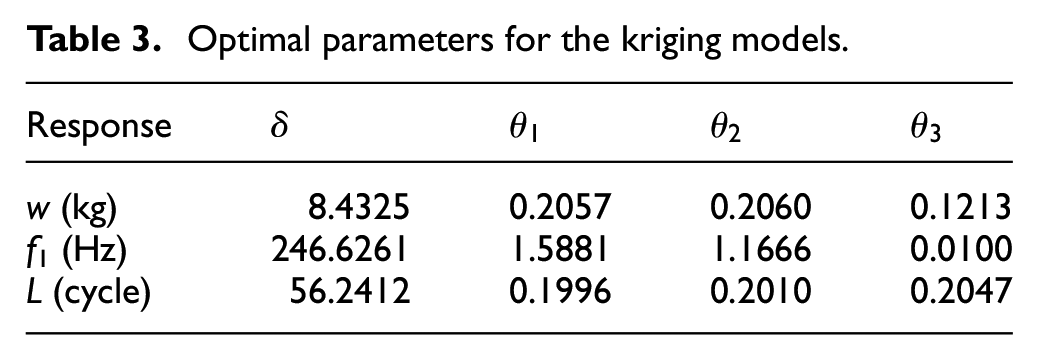
Based on the analysis results of these 30 sample points, the kriging models were created for the weight, the natural frequency, and the fatigue life of the propeller shaft, respectively. The FE model in each case was manually generated. Table 3 summarizes the optimal values of parameters in each kriging model included in equation (6). The reliability of the kriging model, which is an approximate model, can be predicted using the root mean square error, maximum absolute error, and cross-validation index.13,15,17 This study used the cross-validation index as in equation (13), which does not require finite element analysis for additional test points.

Optimal parameters for the kriging models.
where
With the kriging approximation models for the three responses, an optimal solution to equation (12) was calculated using the genetic algorithms in MATLAB. When applying MATLAB’s genetic algorithm, default values of 0.001 and 1 × 10⁻⁶ were used for “ConstraintTolerance” and “FunctionTolerance,” options that affect convergence. The optimum values of x1, x2, and x3 are determined as [1.42, 1.55, 187.4 ]mm. The weight in the optimal solution is 8.237 kg, resulting in a weight reduction of 464 g compared to the weight of the base design. The first natural frequency and fatigue life at the optimal design are calculated to be 255.4 Hz and 50.9 × 10⁴ cycles, respectively.
Conclusions
In this study, a design process that can be applied in the development stage of the propeller shaft is presented. A CAE model was constructed from the base design of a propeller shaft, and a reliable model was determined by comparing it with the test results. Then, optimization for weight reduction of the propeller shaft was performed. In the prototyping stage of the hollow shaft propeller shaft developed for weight reduction, finite element analyses and tests for the main performances of natural frequency and fatigue life were performed in parallel.
In natural frequency analysis, the first natural frequency of interest was calculated as 231.2 Hz for the test and 239.2 Hz for the finite element analysis. This shows an error of about 3.5%. On the other hand, in fatigue analysis, the finite element analysis result of the tube part is 5.6 × 10⁵ cycles, which is very similar to the test result of 5.3 × 10⁵ cycles on average. As a result of comparing the finite element model and the test results, it was found that the CAE model is highly reliable. With the validated finite element model, the optimization for weight reduction of the propeller shaft was performed using a metamodel-based optimization technique. As a result, the weight of the propeller shaft was reduced by 5.3% compared to the base model while satisfying the design criteria. When comparing the tube weight alone, the weight was reduced by 14.1% compared to the base model.
Footnotes
Handling Editor: Chenhui Liang
Declaration of conflicting interests
The author(s) declared no potential conflicts of interest with respect to the research, authorship, and/or publication of this article.
Funding
The author(s) disclosed receipt of the following financial support for the research, authorship, and/or publication of this article: This work was supported by the Dong-A University research fund.