
Abstract
A general compression refrigeration system consists of a compressor, condenser, pressure-reducing valve, and evaporator to induce phase changes in the refrigerant. The performance of the compression refrigeration system strongly depends on the type and characteristics of the refrigerant. However, synthetic refrigerants such as chlorofluorocarbon, hydrochloro-fluorocarbon, and hydrofluorocarbon directly affect the environment as greenhouse gases and indirectly affect the environment by generating substances as they decompose. Thus, researchers have been focusing on developing refrigerants with a low or zero global warming potential. R718 (i.e. water) is an ecofriendly refrigerant, but its specific volume rapidly changes between the liquid and gas phases. This requires making the components of the compression refrigeration system larger than normal to accommodate these volume changes, which is inefficient for manufacturing prototypes. In this study, an alternative refrigerant was applied to the design of a centrifugal compressor that uses R718 as the working fluid. To address the volume change of R718, a numerical analysis was conducted by using the similarity method, where the size of the impeller was reduced and the rotational speed was controlled. To ensure the reliability of the similarity model, its results were compared against the experimental data of the original model for verification.
Introduction
A compression refrigeration system takes heat from a target space or object by using external energy and is applicable to various industrial fields such as cooling buildings, freezing food, and industrial cooling. The market demand and development potential are very high. A compression refrigeration system comprises a compressor, condenser, pressure-reducing valve, and evaporator to induce phase changes in the refrigerant. The compressor is a core component of a compression system and has three types: centrifugal, Roots, and screw. Centrifugal compressors are being continuously developed through conventional design methods, and recent studies have focused on optimizing the design by using computational fluid dynamics (CFD).1,2 Many researchers have focused on improving the durability and aerodynamic performance and analyzing the characteristics of the internal flow field.3–5
The refrigerant is another essential component of a compression refrigeration system, and its type and characteristics greatly affect the system performance.6,7 However, synthetic refrigerants are intertwined with global environmental problems. Chlorofluorocarbon-, hydrochlorofluorocarbon-, and hydrofluorocarbon-based refrigerants directly affect the environment as greenhouse gases and also have an indirect effect because of the substances generated when they decompose.8,9 These problems led to the establishment of the Montreal Protocol, which is an international treaty for phasing out the use of synthetic refrigerants. Thus, interest has increased in the application of ecofriendly refrigerants to compression systems to comply with regulations.
Many researchers have focused on replacing existing refrigerants with refrigerants having a low global warming potential (GWP). 10 Singh and Somvanshi 11 studied the effect of synthetic refrigerants on the environment. They derived ecofriendly refrigerants that could replace existing refrigerants and explained their characteristics. Sonawat et al. 12 investigated the properties of several low-GWP refrigerants as potential replacements for the refrigerant R134a. Their results showed that R1234zd and R1234ze are suitable alternatives but have lower coefficients of performance (COPs) than R134a because of flow loss. Al-Joudi and Al-Amir 13 evaluated the performance of a small-scale air-conditioning system using R22 and the alternative refrigerants R290, R407C, and R410A. They conducted experiments to determine the effects of the alternative refrigerants on the air conditioner performance under certain conditions. Kalla and Usmani 14 applied various ecofriendly refrigerants to a vapor compression refrigeration cycle using R22 and R134a. Their thermodynamic analysis showed that R290 and M90 were suitable alternatives. However, R290 generates a large amount of hydrocarbon, so it cannot be used in industrial fields that require a large amount of refrigerant. Meanwhile, M90 had a lower COP than R134a.
Other researchers have started focusing on developing ecofriendly refrigerants with zero GWP rather than low GWP. Sarevski and Sarevski 15 compared one- and two-stage refrigeration cycles using the refrigerant R718 (i.e. water) and found that the two-stage refrigeration cycle had a 9% higher COP than the first-stage refrigeration cycle. Lachner et al. 16 investigated the economic feasibility of a compressor using R718 as a replacement for existing refrigerants. They found that the most effective method was to configure the compressor with inter-cooling, a two-stage compression system, and a direct-contact heat exchanger. Hu et al. 17 investigated the characteristics, advantages, and disadvantages of centrifugal, screw, and Roots steam compressors using R718. Their results showed that the centrifugal compressor is suitable for compression systems with a maximum volume flow rate and a minimum compression ratio owing to the advantage of the large volume flow rate and disadvantage of a high discharge temperature. The Roots compressor has low vibration and a simple structure, but it has a lower compression ratio than a screw compressor. The screw compressor has excellent stability and a large compression ratio but a small volume flow rate. Thus, it is suitable for a refrigeration system requiring a small volume flow rate and large compression ratio. They also investigated the characteristic applications of steam compressors, which include mechanical vapor recompression systems, heat pumps, and refrigeration systems.
In summary, researchers have focused on developing low- or zero-GWP refrigerants to replace synthetic refrigerants that harm the environment. Most researchers who have applied R718 as a refrigerant to compression-type refrigeration systems investigated the system configuration and characteristics of the vapor compressor. However, the specific volume of R718 rapidly changes between the liquid and gas phases, so the main components of the compression system need to be increased in size to accommodate these volume changes. This makes it quite inefficient to manufacture prototypes in terms of production time and cost.
If a similar model using an alternative refrigerant having performance characteristics similar to that of the refrigerant used in the compressor is developed, the problem of inefficiency can be solved. When the similarity law is applied to a centrifugal compressor whose working fluid is air, and the working fluid of the compressor is replace with R134a, a recent study found that the performance was similar when the number of Mach was below the critical point. 18 In another study, after analyzing the general specifications of a centrifugal compressor, the most efficient operating point of the compressor is identified with a speed diagram for each pressure ratio using the law of similarity to effectively design a compressor. 19 Therefore, using the law of similarity, the performance is similar even if the geometry and rotation speed of the impeller is different.
This study focused on resolving the inefficiency of manufacturing prototypes of compressors using R718 as the refrigerant. First, an alternative refrigerant was applied as a working fluid to a centrifugal compressor using R718. Second, the aerodynamic performances of R718 and the alternative refrigerant were compared through numerical analysis based on the similarity law. Third, the numerical results were compared with experimental data to verify their reliability. Finally, the internal flow fields were investigated to ensure the reliability of the methodology.
Problem description
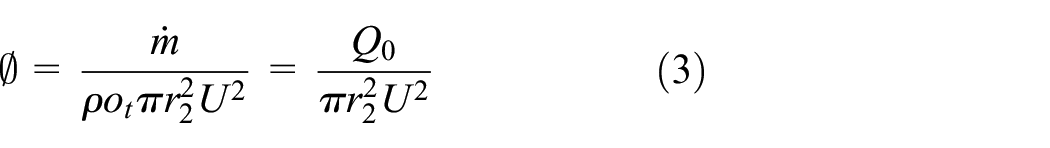
Centrifugal compressor
Centrifugal compressors have the same designation as turbo compressors. After high-speed rotation of the impeller increases the speed of the refrigerant, the pressure energy increases as the flow moves along the diffuser. Then, the refrigerant exiting the diffuser rotates along with the volute corresponding to the case area of the compressor, which further increases the pressure energy. In commercial and industrial centrifugal compressors, the specific speed NS and specific diameter DS are correlated with the head H, rotational speed N, flow Q, and diameter D:
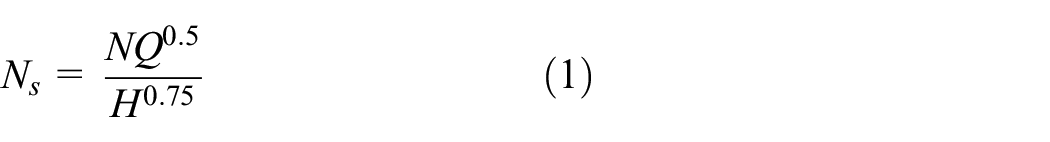

The specific speed and specific diameter can be used to classify the geometry and types of the main rotating components. A centrifugal compressor with a specific speed of 0.807 [rad/s, m3/s, m] and specific diameter of 110.07 [m, m, m3/s] was selected as the subject of this study. 20 Table 1 presents the detailed design specifications of the centrifugal compressor using R718 as the refrigerant. The flow coefficient Ø is a non-dimensional number related to the volume flow rate and is mainly used in industrial fields to evaluate the performance of the compressor. 20 It is defined as follows:
where
Design specifications of the compressor using R718 as a refrigerant.

The velocity at the impeller tip can be obtained by multiplying the number of revolutions of the impeller with the diameter. The flow coefficient is independent of the actual rotational speed and operating Mach number of the compressor. Therefore, while factors such as the flow rate and discharge pressure change depending on the working fluid, rotational speed, and inlet conditions, the flow coefficient remains almost constant for a fixed impeller geometry. In other words, if the scale of the centrifugal compressor is changed but the impeller geometry is kept the same, the flow coefficient remains the same as that of the original model.
The head coefficient is related to the increase in enthalpy at each stage of the centrifugal compressor and is defined as follows:


where
Original and similarity models
The similarity law and an alternative refrigerant were used to address the inefficiency of manufacturing prototypes for centrifugal compressors using R718. The aim of this study was to develop a similarity model using an alternative refrigerant with similar performance characteristics as a compressor using R718. A centrifugal compressor using R718 has a two-stage design. This study focused on the low-pressure stage, which comprises the impeller, diffuser, and return band. Figure 1 shows the geometry of the centrifugal compressor using R718. The problem with R718 is that water has a relatively low specific gravity. Accordingly, prototypes need to be large, which is inefficient to manufacture. To solve this problem, the working fluid of the centrifugal compressor was changed to carbon dioxide (CO2), which has a high specific gravity. The compressors using R718 and CO2 as the refrigerants were designated as the original and similarity models, respectively. The scale of the similarity model was reduced and the rotational speed was increased to obtain the same performance as the original model. Table 2 and Figure 2 compare the original and similarity models.

Geometry of the centrifugal compressor using R718 as the refrigerant.
Comparison of the original and similarity models.


Meridional planes of the original and similarity models.
Numerical analysis methods
The commercial code ANSYS CFX package ver. 19.2 (BladeGen, TurboGrid, ICEM CFD and ANSYS CFX) was used for the numerical analysis. Figure 3 shows the computational domain. The 3D geometry of the inlet was modeled to account for the hub cap. Tetrahedral and prism grids were constructed for the inlet. In the remaining domains such as the main blade, splitter, and diffuser, a hexahedral grid system was created for a single-flow passage. The grid dependence test was carried out in an earlier study 21 on the difference between the numerical analysis results and design specifications of a compressor using R718. The scale-down function in ANSYS CFX was used to create grid systems for both the original and similarity models.
Computational domain and meridional plane of the first stage.
Three-dimensional steady-state Reynolds-averaged Navier–Stokes equations were discretized to predict the performance and internal flow field. To reduce the calculation time and enhance the convergence criteria, a periodic condition was applied to the rotation direction for a single-flow passage. The main blade, splitter, and diffuser have periodicity around the axis of rotation. The stage-average method was applied to the boundary condition between the rotor blade and the stator diffuser, where the physical quantity of the flow averaged in the circumferential direction was transferred in the flow direction. The frozen-rotor method was applied to the rest of the interface. A k–ω based shear stress transport (SST) model was applied to the turbulence. The SST model is a hybrid that applies the advantages of the k–ω and k–ε models in the near-wall and free-flow regions, respectively. This model is able to adequately predict phenomena such as flow separation and is suitable for fluid analysis in machines. The total pressure and total temperature conditions were applied to the inlet, and the mass flow rate condition was applied to the outlet. The working fluids of the original and similarity models were R718 and CO2, respectively. The information on the refrigerants was taken from REFPROP 22 9.1 developed by the National Institute of Standards and Technology (NIST). Table 3 presents the detailed information and boundary conditions used for the performance analysis. Simulations were performed on a 30-core dual-processor Xeon (1.82 GHz) central processing unit. Under the steady-state condition, the calculation times for the original and similarity models were about 3 h 30 min and 3 h, respectively.
Boundary conditions of the original and similarity models and the working fluid properties.

Results and discussion
Validation of numerical results
An experiment was conducted to verify the prediction performance of the similarity model. The experiment was conducted in the first stage (i.e. low-pressure stage), and CO2 was used as the refrigerant. Figure 4 shows a schematic diagram of the experimental apparatus. The experiment was conducted twice at different rotational speeds. The numerical analysis was performed under the same conditions as the experiment. In the experiment, the pressure was measured at the rear end of the diffuser, and the mass flow rate was measured by an orifice flow meter at the compressor inlet. In the numerical analysis, the pressure and mass flow rate were taken at the same locations. The compression ratio was calculated as the ratio of the total pressure at the rear end of the diffuser to the total pressure at the inlet of the compressor. For the compressor inlet, the analysis considered two conditions: the mass flow rate and pressure. This was to reduce the convergence and calculation times.

Schematic diagram of the experimental apparatus for the similarity model.
In the numerical analysis, the mass flow rate and total temperature at the inlet changed because of the pressure. To correct the mass flow rate and rotational speed, the following correction calculation formulas were used:


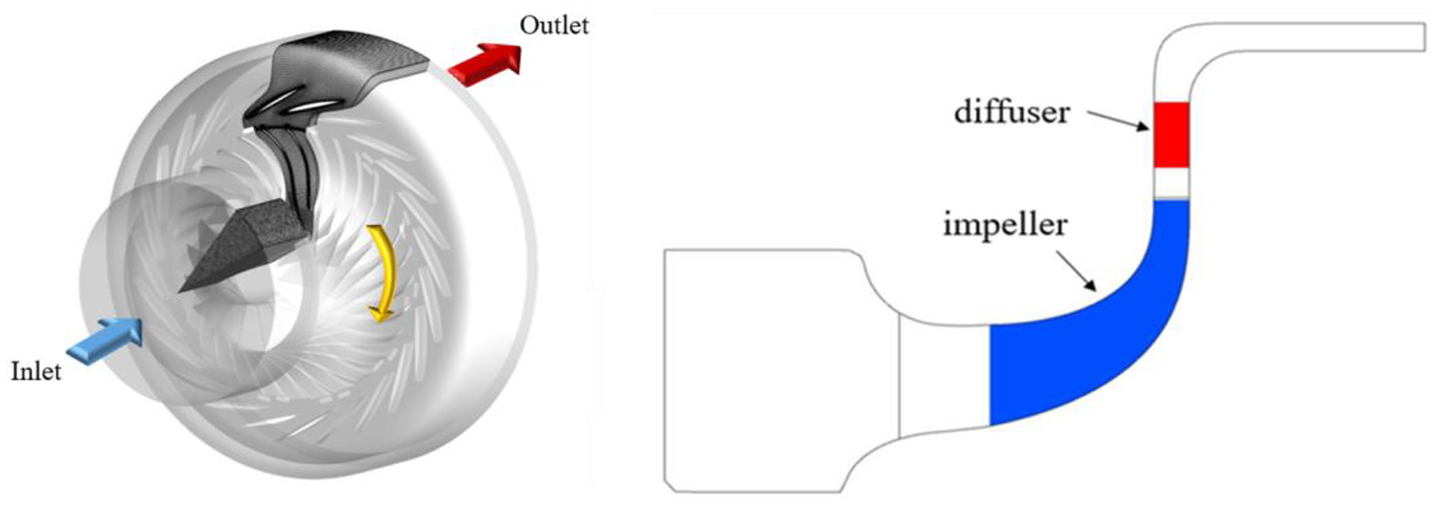
where P, T, W, N, δ, and θ are the stagnation pressure, stagnation temperature, real mass flow, real shaft speed, reference pressure, and reference temperature, respectively. 20 The resulting mass flow rate and compression ratio at the measurement locations were made dimensionless for an accurate comparison between the experimental and numerical results. The vertical axis in Figure 5 is the ratio of the total pressure ratio at the actual operating point to the pressure ratio at the design point, and the horizontal axis is the ratio of the flow rate at the actual operating point and the design point. Figure 5 shows a maximum error of about 7% between the experimental and numerical results under the different operating conditions, which indicates good agreement.
Comparison of the numerical and experimental results.
Comparison of the original and similarity models
The results of the original and similarity models were compared by using dimensionless coefficients because they have the same geometry but differ in impeller size, working fluid, and number of revolutions. Therefore, the numerical analysis results were made dimensionless by using the head and flow coefficients previously described in equations (3) and (4), and the performances of the two models are compared in Figure 6. Figure 6(a) shows the flow coefficient and head coefficient of each operating point and (b) shows the isentropic efficiency at the flow coefficient of each operating point. And in the operating range of each model, it can be confirmed that the flow coefficient is from about 0.024 to about 0.031 for R718 model, and from about 0.022 to about 0.028 for the CO2 model. The performances of the low-pressure stage in the original model and the similarity model matched well with a maximum error of about 5%–6%. The error can be attributed to the different working fluids and inlet temperatures. The results indicate that the similarity model predicts the performance of the original model with acceptable reliability because the error is not large. Therefore, the similarity model can be used to design a centrifugal compressor using a refrigerant with a low specific gravity more efficiently. Figure 6 also compares the efficiencies of the original and similarity model. For both models, choking occurred when the flow coefficient was more than 0.03. The original model had slightly higher efficiency at a high flow coefficient than had the similarity model, and choking occurred at a higher flow coefficient in the original model than in the similarity model. These differences can be attributed to the scale effect and properties of the refrigerants used in the two models.
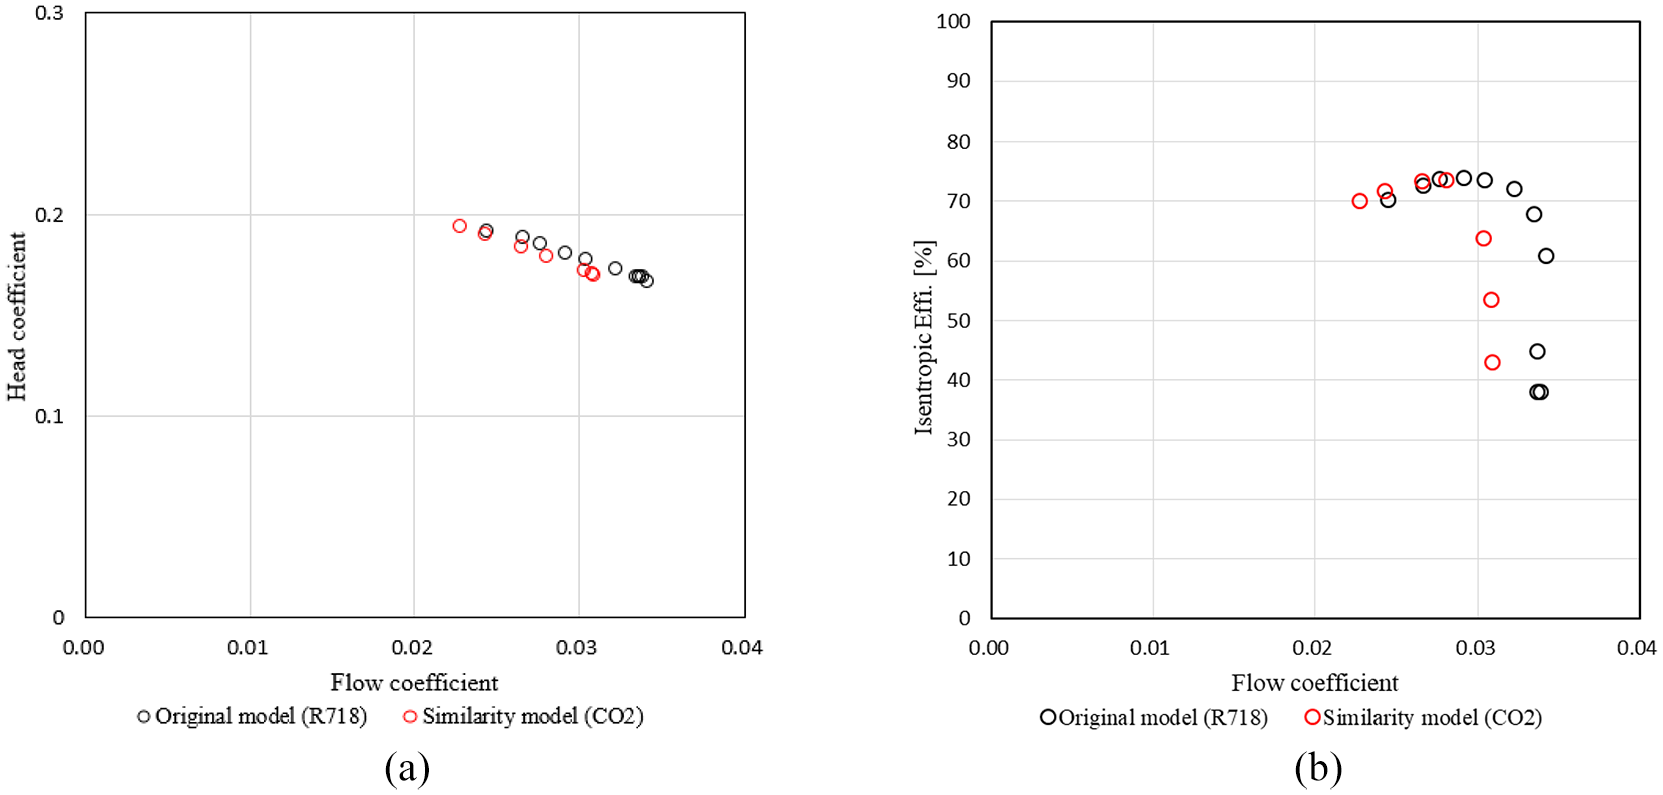
Comparison between performances of the original and similarity models: (a) flow coefficient versus head coefficient and (b) flow coefficient versus isentropic efficiency.
Internal flow fields of the original and similarity models
The internal flow fields of the original and similarity models were compared to evaluate the effects of the scale effect, different refrigerants, and different rotational speeds. The analysis focused on not only comparing the two models but also identifying problems with existing model features and finding ways to improve the design. Figure 7 compares the pressure distributions at the best efficiency point and choking line. The horizontal axis shows the position from the inlet to the diffuser outlet, the vertical axis is the ratio of the total pressure and static pressure at each position to the total pressure and static pressure at the diffuser outlet. The flow coefficients at the best efficiency point and choking line were about 0.026 and 0.034, respectively, for the original model and about 0.026 and 0.031, respectively, for the similarity model. The pressure distributions were normalized by the pressure at the outlet of the diffuser. The pressure distributions of the original and similarity models showed similar trends overall. Therefore, the similarity model was confirmed to predict the internal flow field of the original model with relatively good accuracy.
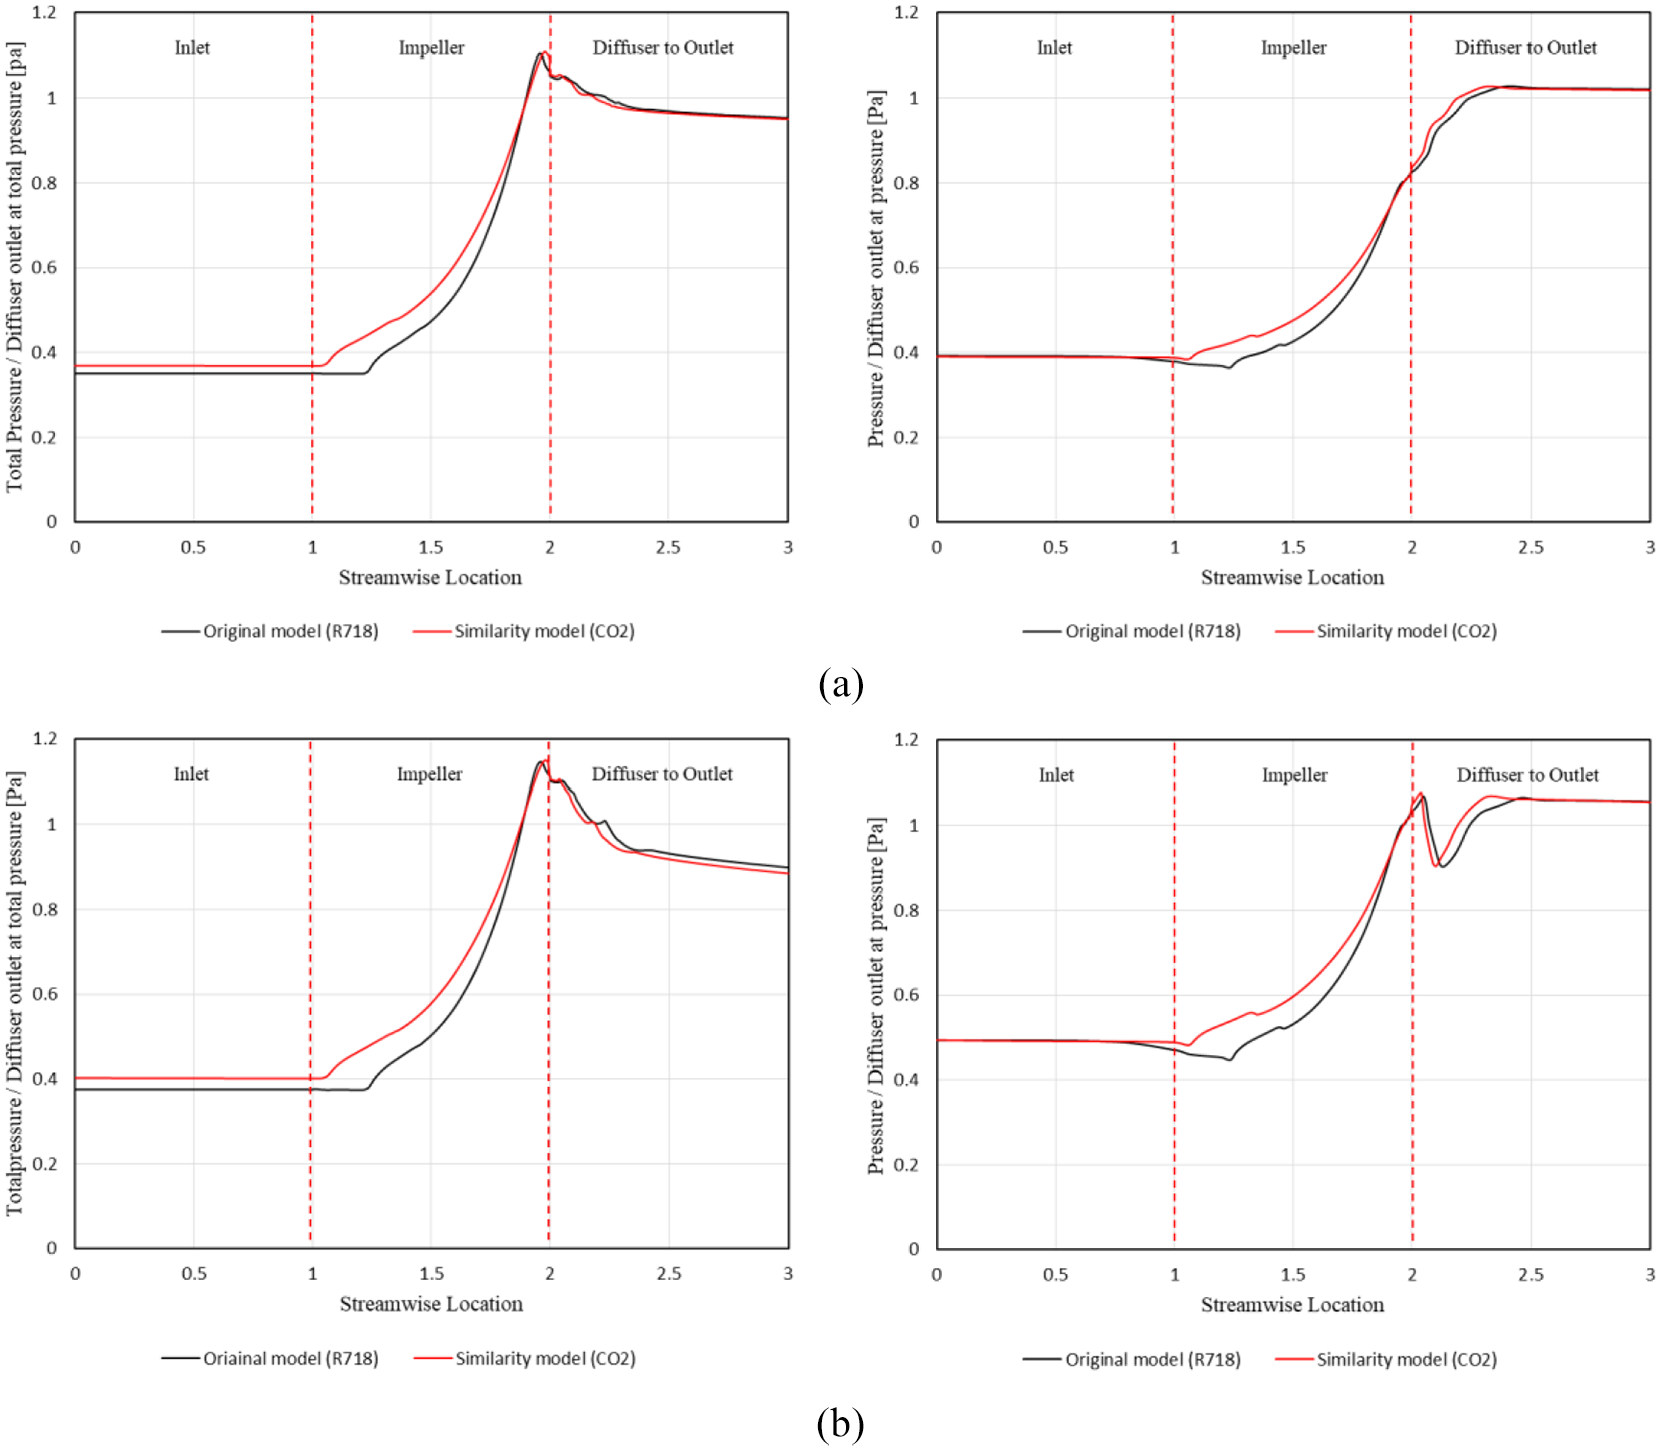
Pressure distributions of the original and similarity models at the: (a) best efficiency point and (b) choking line.
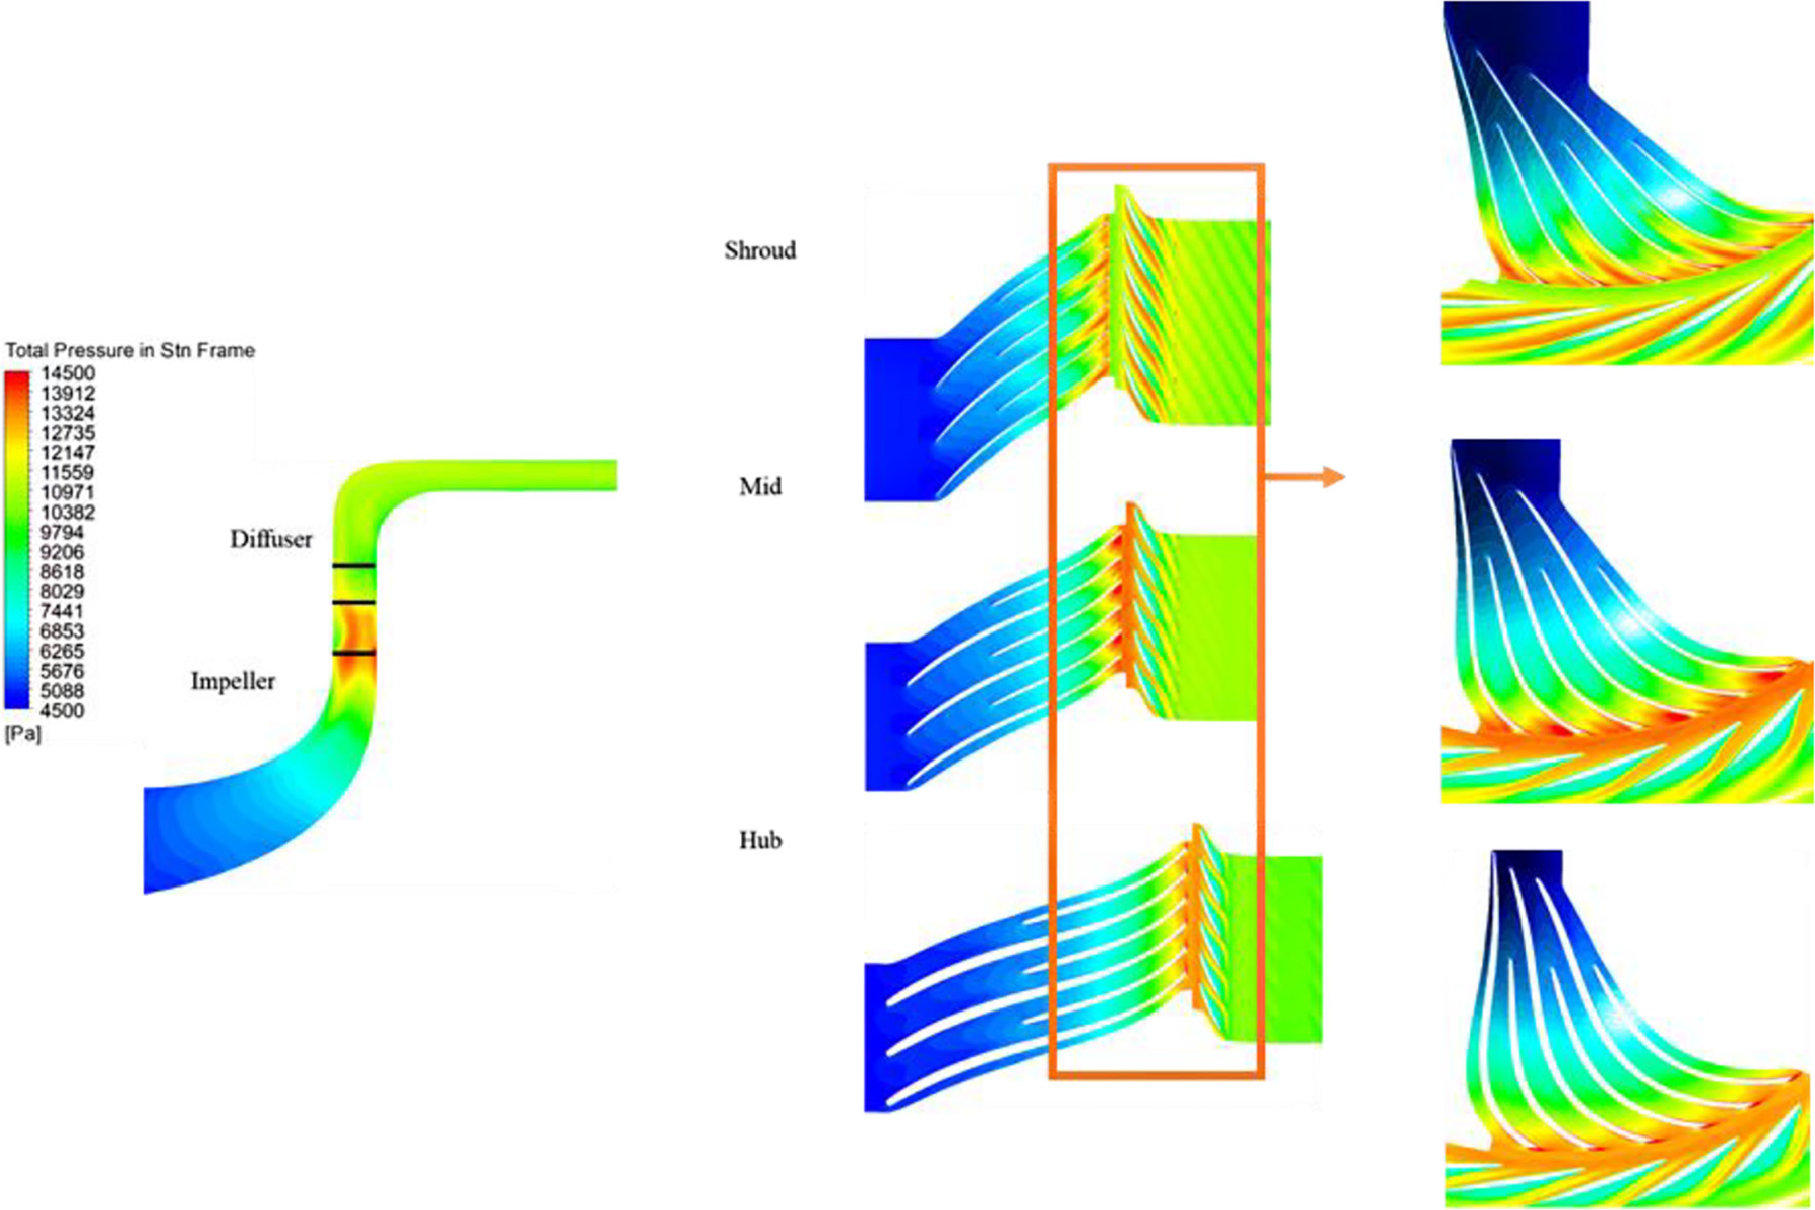
Figure 8 shows the total temperature distribution between the original model and the similarity model. Since there is a difference in the thermodynamic properties of the working fluid, it can be seen that the range of contour is slightly different. Overall, the temperature distribution of each span and the meridional plane indicate that the temperatures of the two models show similar trends. Figures 9 and 10 show the pressure and velocity contours of the original model, respectively, and Figures 11 and 12 show the pressure and velocity contours of the similarity model, respectively. Figure 9 shows the total pressure distribution inside the original model. A non-uniform pattern can be observed along the streamwise direction. Especially, the total pressure was lower downstream of the impeller shroud span than for other spans, and a low-pressure region was observed downstream of the diffuser hub and shroud spans because of the no-slip condition. The pressure was confirmed to rapidly decrease through the trailing edge of the diffuser. Therefore, the static pressure did not recover properly. Figure 10 shows the velocity and streamline distributions of the original model. The velocity distribution at the leading edge of the impeller indicates that the flow angle did not coincide with the blade angle at each span. of incidence was not optimal. This phenomenon was more pronounced in the hub and shroud spans than at mid-span. The streamline distribution shows that the flow was blocked at the impeller pressure surface for each span. In addition, the splitter of the hub and shroud span requires changes in the angle of incidence and camber line. The elbow of the return band downstream of the diffuser induced the non-uniform distribution.

Total temperature of the: (a) original and (b) similarity models.

Pressure contours of the original model.

Velocity contours and streamline distribution of the original model: (a) meridional plane and each span and (b) leading edge of the impeller at each span.
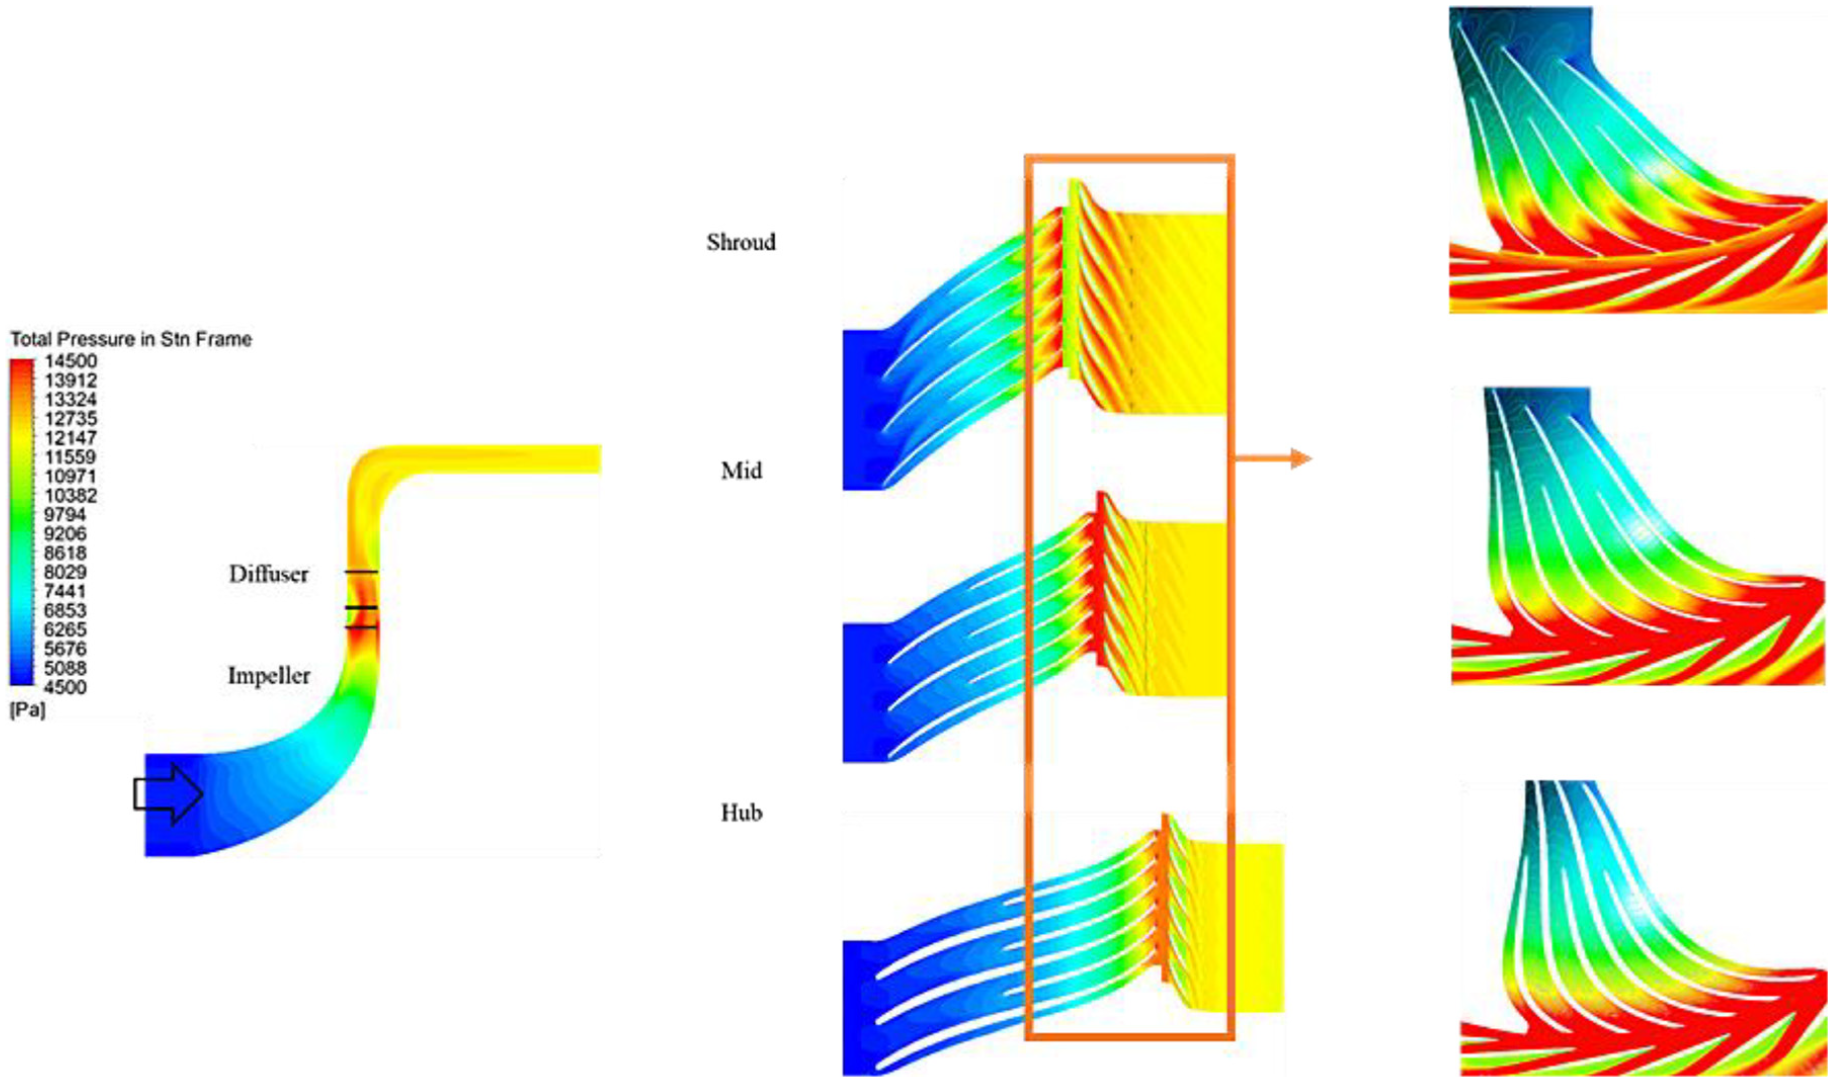
Pressure contours of the similarity model.

Velocity contours and streamline distributions of the similarity model: (a) meridional plane and each span and (b) leading edge of the impeller at each span.
Figure 11 shows the total pressure distribution of the similarity model. Although the magnitude of the absolute pressure varied because of the scale effect, rotational speed, and refrigerant, the overall trend was similar to that of the original model along the meridional plane. The total pressure downstream of the impeller shroud span was lower than that of other spans, and a low-pressure region was downstream of the diffuser hub and shroud spans. Figure 12 shows the velocity and streamline distributions of the similarity model. The velocity distribution was non-uniform at the leading edge of the impeller, and the velocity was relatively high in the shroud region and low in the hub region. The flow stagnation point was on the suction surface, and the flow was blocked on the pressure surface; these trends are similar to those observed for the original model. This phenomenon was attributed to the mismatch between the blade angle at the inlet and the angle of the incoming flow. Furthermore, the velocity was non-uniform because the width of the impeller caused the flow to concentrate in the shroud region, which confirms that the impeller width needs to be corrected. Flow separation was observed in the impeller and diffuser regions, which indicates that the angle of incidence between the impeller and the diffuser was not optimal. Similar to the original model, the similarity model had a high-velocity region in the diffuser region that caused the pressure and speed to rapidly decrease.
Figure 13 shows the Mach number distributions of the original and similarity models at the meridional plane and mid-span. The distribution along the meridional plane indicates that the Mach number increased in front of the impeller shroud. Flow blockage occurred at the trailing edge of the diffuser, which indicates that the performance of the compressor can be improved by modifying the diffuser design.

Mach number contours of the original and similarity models at the: (a) meridional plane and (b) mid-span.
The analysis of the internal flow fields confirmed that similar problems arose in both models. The designs of the impeller and diffuser can be modified to improve the compression ratio and efficiency of the original model. The internal flow fields of the original and similarity models showed similar trends. This confirmed that, even if the scale and working fluid are changed, the performance and internal flow distribution remain similar if the geometry is kept the same. Figures 14 and 15 show the pressure and velocity distributions at the choking line of the original model, respectively. At the choking line, the internal pressure increased because the internal flow rate of the compressor increased. This caused the region of the flow separation in the diffuser to expand. The increased pressure lowered the overall velocity distribution. Similar to the pressure distribution, the velocity distribution indicated that the region of the flow separation in the diffuser expanded. Figures 16 and 17 show the pressure and velocity distributions at the choking line of the similarity model, respectively. The results were similar to those of the original model. The difference between the internal flow and velocity distributions at the highest efficiency point and choking line was similar to that of the original model. This confirmed that the similarity model results in almost the same performance as the original model even though the scale and working refrigerant are different and that it can be used to predict the internal flow distribution.

Pressure contours of the original model at the choking line.

Velocity contours of the original model at the choking line.
Pressure contours of the similarity model at the choking line.

Velocity contours of the similarity model at the choking line.
Conclusion
This study evaluated the feasibility of applying the similarity method to resolve the inefficient prototype manufacturing of centrifugal compressors using R718 as a refrigerant.
The numerical analysis and experimental results showed that the maximum error between the similarity model using CO2 as a refrigerant and the original model using R718 as the refrigerant was about 7%. This confirmed the reliability of the similarity model.
The validity and reliability of the similarity model were verified through a comparison with the original model. The models were compared by using the flow coefficient and head coefficient, which are non-dimensional numbers related to the volume flow rate and enthalpy increase in the compressor. The error was within 5%–6%, and the models showed similar performance trends. This confirmed the reliability of the similarity model. Both models indicated that choking occurred when the flow coefficient was over 0.03. The main difference was that the original model showed choking at a higher flow coefficient than did the similarity model.
The internal flow fields of the models were analyzed at the best efficiency point to identify differences between the models and any problems with the compressor geometry. The results confirmed that the models had similar internal flow distributions. In addition, the impeller design did not have the optimal angle of incidence because the flow distribution was non-uniform at the front end of the impeller. Flow separation and a transonic speed region were observed in the diffuser region, which caused the velocity to rapidly decrease downstream of the diffuser region. This indicates that the diffuser design should be modified. The results confirmed that the impeller and diffuser designs should be modified to improve the performance of the original model.
The internal flow field was analyzed to compare the differences in performance at the highest efficiency point and choking line. For the original model, the internal pressure was higher at the choking line than at the highest efficiency point, which caused the flow separation region in the diffuser to expand. The velocity distribution confirmed that the velocity was lower at the choking line than at the highest efficiency point. The overall trends of the similarity model were similar to those of the original model.
The results confirmed that the similarity model can be applied to verifying the performance of compressors using R718 as the refrigerant in the prototype production stage. The reliability of the similarity model was confirmed experimentally. Future work will involve performing numerical analysis to optimize the aerodynamic performance.
Footnotes
Appendix
Handling Editor: Chenhui Liang
Declaration of conflicting interests
The author(s) declared no potential conflicts of interest with respect to the research, authorship, and/or publication of this article.
Funding
The author(s) disclosed receipt of the following financial support for the research, authorship, and/or publication of this article: This paper was conducted with the support of the Ministry of Trade, Industry and Energy, and supported by the Manufacturing-Based Industrial Core Technology Development Project (Development of Compression Cooling Technology with 350kW Class Natural Refrigerant (R-718), Project No. 20000187).