
Abstract
In this paper, the dewatering and screening process of vibrating-dewatering screen is studied by the combination of simulation test and physical experiment. The simulation model of dewatering screening process is established by the method of computational fluid dynamics (CFD) and discrete element method (DEM). Subsequently, the screening efficiency and processing efficiency are defined as evaluating indexes for performance of dewatering and screening. Four parameters of amplitude, vibration frequency, vibrating direction angle and slope angle of screen surface are selected for single factor simulation test, and the variation of dewatering and screening performance under different parameters is obtained. Finally, the reliability of the simulation results is verified by the physical experiment platform, and significant factors affecting the evaluation index of the vibrating-dewatering screen parameters and the optimal parameter combination are obtained by orthogonal test.
Keywords
Introduction
The main function of vibrating-dewatering screen is to dewatering, desliming the materials such as sand aggregate, fine coal slime, and mineral ore, so as to improve the quality of the products and the effect of the products. It is widely used in industries such as washing sand in sand and stone plants, coal slime recovery in coal preparation plants, and tailings dry discharge in mineral processing plants etc. Excellent dewatering and sieving performance are the guarantee of improving economic benefits. For the research of vibrating-dewatering screen, domestic and foreign scholars have done a lot of work in the following aspects.
In improving dewatering performance, Dong et al.1,2 developed a vibrating-dewatering screen with a unique structure that uses side plate beam excitation. Shi 3 studied the high-frequency coal slime vibrating-dewatering screen, and analyzed the parameters selection method and structural design characteristics of the machine. In optimizing structural strength, Zhou and Liu 4 replaced the frame screen plate with a flat screen plate structure to improve the structure of the biaxial vibrating-dewatering screen. This solved the difficulty of replacing the screen plate, prolongs the service life of the screen plate, and greatly improves the economic benefits. Cao and Xu 5 based on ANSYS, the performance analysis of high frequency vibrating-dewatering screen is carried out, and the structural system of the screen is optimized, which provides reliable technical parameters for the design and safe use of the equipment. In the study of the mechanism of dewatering, Ettmayr et al. 6 introduced the effect of water absorption medium on water residue. The tests showed that the material height, residence time, vibration frequency, and acceleration have certain effects on the dewatering effect, and the production capacity can be increased by 5 t/h. Keller and Stahl et al.7–10 described the dynamic of vibrating-dewatering screen by introducing a physical model. They further elaborated on all the problems of vibration dewatering in mathematics and physics. Ng 11 proposed a method for determining the performance of vibrating and dewatering, which can be designed to meet the requirements of displacement and water content.
As for the fluid-solid coupling method of CFD-DEM, in recent years, more and more people use CFD-DEM coupling method to simulate the working process of fluidized bed.12,13 EI Shamy and Zeghal 14 applied CFD-DEM coupling method to geotechnical engineering research. They simplified navier-stokes equations and used 3D CFD-DEM coupling method to solve the soil slope seepage problem. Later, they used the same method to study the vibration liquefaction of saturated soil and got good results.
In summary, the research on vibrating-dewatering screen was mainly based on mathematical calculations and physical experiments. Most of them focus on the research on dehydration efficiency, screen life, and structural strength. The research methods are too single, and less numerical simulation is used. Moreover, almost no one has used discrete element and finite element coupling methods to study the dewatering and screening performance of vibrating-dewatering screen, and this will be the innovation of this paper. In this article, the particle computing capabilities of EDEM will be used to simulate the movement of particle on vibrating-dewatering screen, and the fluid simulation advantages of FLUENT will be utilized to define boundary conditions for liquid flow. Then the motion law of each phase in the EDEM and FLUENT coupling simulation process will be analyzed. Finally, the key parameters affecting the performance of screening and dewatering can be directly sought and optimized. This research content and method can provide ideas and references for the research of the vibrating screen industry.
Modeling of simulating calculation
Volume of fluid
In the working process of vibrating-dewatering screen, there is a free liquid surface flow in the movement of the particles, which is the interface between water and air. Therefore, the change in free surface between water and air requires a suitable multiphase flow model to be expressed. The multiphase flow model used in this paper is the volume of fluid (VOF), and the VOF is a model that is generally used and has a good effect.
The fluid volume method is a calculation method proposed by Hirt and Nichols et al.15,16for dealing with complex free surface problems. The advantage of this calculation method is that only a function is needed to solve the complex process of free surface. The VOF model has been widely used in dealing with stratified flow, free surface flow, and sloshing, and has been effectively practiced in many fields of research.17,18
The VOF model uses the equations of momentum and continuous equations to simulate the motion of two or more mutually incompatible fluids, tracking the free surface, and the volume of each fluid. The VOF method requires fluids to be incompatible with one another, defining the main and auxiliary flows in the fluid, respectively. Assuming that αq represents the volume function of the qth fluid, there are three different cases:
α q = 0, The qth fluid of the unit body is empty;
αq = 1, The qth fluid of the unit body is completely full;
0 < αq < 1, There is a free surface in the unit.
Taking the qth state as an example, the transport diffusion function of the volume function is:
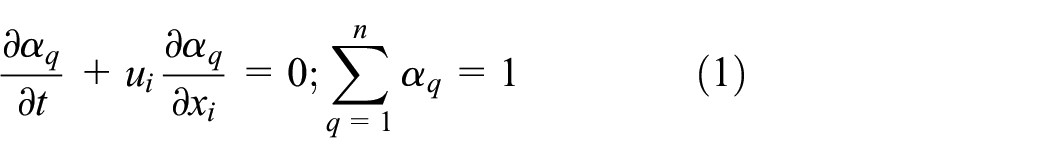
The numbers 1 and 2 are used to represent the combination of the flow parameters of the characteristic parameters of the transport equation in the two flow modes in the control body. The density of the unit body can be expressed as:

This method calculation applies to other characteristic parameters such as viscosity coefficient.
Coupling of CFD and DEM
The application of computational fluid dynamics and particle discrete elements is involved in the research of vibrating-dewatering screen. The corresponding simulation software are FLUENT and EDEM. The interaction between the particle, the water and the sieve plate exists in the simulation model of the vibration dewatering sieve. The energy exchange that simulates the action of the flow of water on the material is relatively complicated. Therefore, the method of computational fluid dynamics (CFD) and discrete element method (DEM) coupling to simulate is used in this paper, which is also a new method for the study of vibrating-dewatering screen.
CFD and DEM coupling methods are widely used to handle numerical calculations of particle and fluid interactions. FLUENT and EDEM are coupled through an API interface.19–24 The coupling process is shown in Figure 1. First, FLUENT converges within a set time step or is consistent with the set iteration step in the calculated time step. Then the data in FLUENT is transmitted to EDEM through the coupling interface. The EDEM software updates the particle motion information after receiving the flow field information, and then feeds it back to the FLUENT software for a new round of iterative calculation.

Coupling process between FLUENT and EDEM.
Building a computational domain model
As shown in Figure 2(a), this is a three-dimensional model of the experimental prototype of the vibrating-dewatering screen, which is mainly composed of vibration motors, polyurethane screen plates, rubber springs, frame, and a base. The screen surface of the experimental prototype is 1m in length and 0.5 m in width, and the gap of the screen plate is 2 mm in size. If the fluid domain of the whole prototype is used as the calculation domain, then the number of grids generated will be very large. The calculated amount is not only large, but also there are repeated calculations, and the required computer requirements are extremely high. But due to the trajectories of the points on the screen are the same, as shown in Figure 2(b), the screen surface with a width of 22 mm and a length of 500 mm is taken as a calculation domain, which not only greatly simplifies the calculation target, but also reduced calculation time. The ICEM is used to mesh the computational domain, as shown in Figure 2(c). The information of the grid of the calculation domain is: 1,222,978 total elements and 209,109 total nodes.
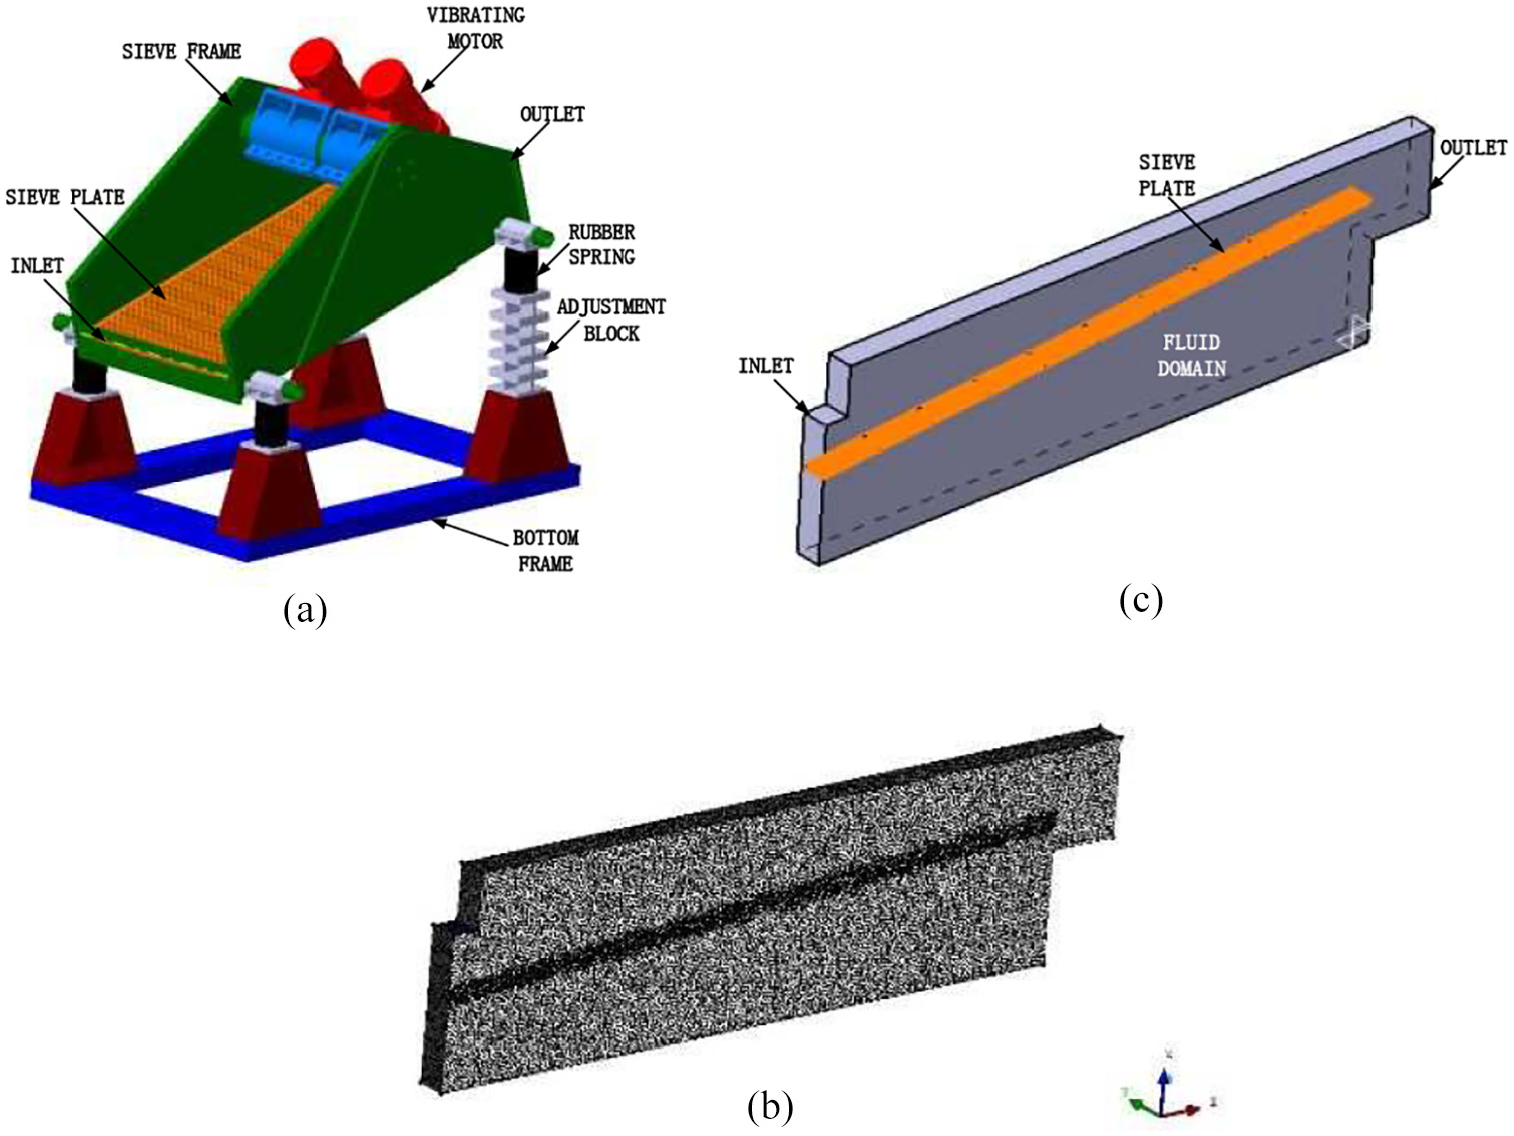
Computation model of vibrating-dewatering screen: (a) three-dimensional model of vibrating-dewatering screen, (b) computation model of fluid domain, and (c) mesh model of fluid domain.
FLUENT parameter settings
According to the actual situation of the dewatering and screening process, the inlet and outlet boundary conditions in FLUENT are set up as one velocity-inlet and two outflows, respectively, as shown in Figure 3. The VOF (volume of fluid) is used to track the free liquid surface. The red part and the blue part are the water phase and the air phase respectively. The particles enter through the inlet, climb through the screen by the vibration of the move wall, leave the water surface, and finally output from the outlet.

Boundary conditions for flow field computation of vibrating-dewatering screen.
The parameter settings in FLUENT during the dewatering and screening process are shown in Table 1.
FLUENT parameter settings. 17

EDEM parameter settings
The grid file generated by ICEM is imported into the EDEM software as a model of discrete element simulation, as shown in Figure 4. In the test process, sand is used as the material for particle modeling, the screen plate is made of polyurethane, and the particle factory is built at the inlet of the vibrating-dewatering screen. The EDEM software simulates the movement of the screen plate, and collects information such as the mass, displacement, and velocity of the particles through post-treatment to analyze the movement of the particles under different parameters.
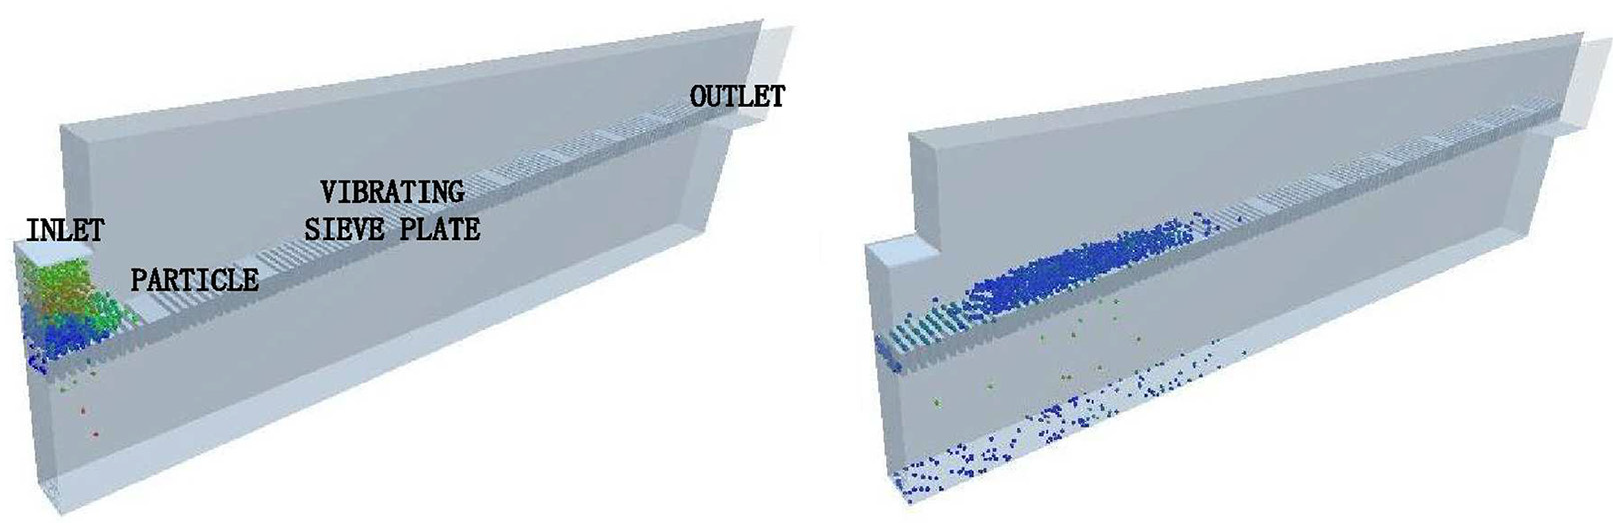
EDEM particle simulation model.
The parameter settings in EDEM during the dewatering and screening process are shown in Table 2.
EDEM parameter setting. 25

Single factor simulation test
In this paper, the amplitude (A), vibration frequency (F), vibrating direction angle (δ), and slope angle of screen surface (α) of the vibrating-dewatering screen are studied. The purpose of this paper is to study the influence of these parameters on the evaluation index and find the optimal combination of parameters, so as to provide reliable research method for the design and manufacture of industrial vibrating-dewatering screen.
Verification of parameter independence
In this paper, the single factor optimization method is used to study the influence of different parameters on the performance of dewatering and screening. The premise of the single factor optimization method is that the factors must be independent of each other and there is no interaction between the two. By analyzing the four parameters, it is known that δ and α are independent factors that are adjusted by independent structures. The A and F are changed by changing the rotational speed of the vibration motor and the excitation force of the polarization block. The carriers of both are based on the vibration motor, so it is necessary to find out whether there is interaction between the A and F.
Both A and F determine the magnitude of the vibration acceleration26,27, and the vibration acceleration determines the kinetic energy of the vibrating-dewatering screen, which plays an important role in the dewatering and screening of the vibrating-dewatering screen. Therefore, vibration acceleration is used as an index to study the interaction between the factors. The A of 1.2 and 2.0 mm, the F of 25 and 45 Hz are selected as the levels, and the interaction of A and F within this range is investigated. The kinetic simulation is performed by ADAMS. As shown in Figure 5. δ and α are fixed values, and four springs and four bushings are added at the four pillar positions respectively. The two motion with the same size and opposite direction are loaded on eccentric shaft of the vibration motor. The movement process is: first let stand under the action of gravity for 3 s, so that the spring reaches the pre-compression state, and then the vibration motor speed is gradually accelerated from 0 to 9000 or 16,200°/s from 3 to 7 s, and finally rotate from 7 s to the end, the program is: step (time, 3, 0 d, 7, F × 360 d). Set the simulation time to 20 s and the number of steps to 20,000. At the end of the motion simulation, the data file of the vibration acceleration is derived, and the final stable phase is selected to draw the acceleration change map, as shown in Figure 6.

ADAMS dynamics simulation model.
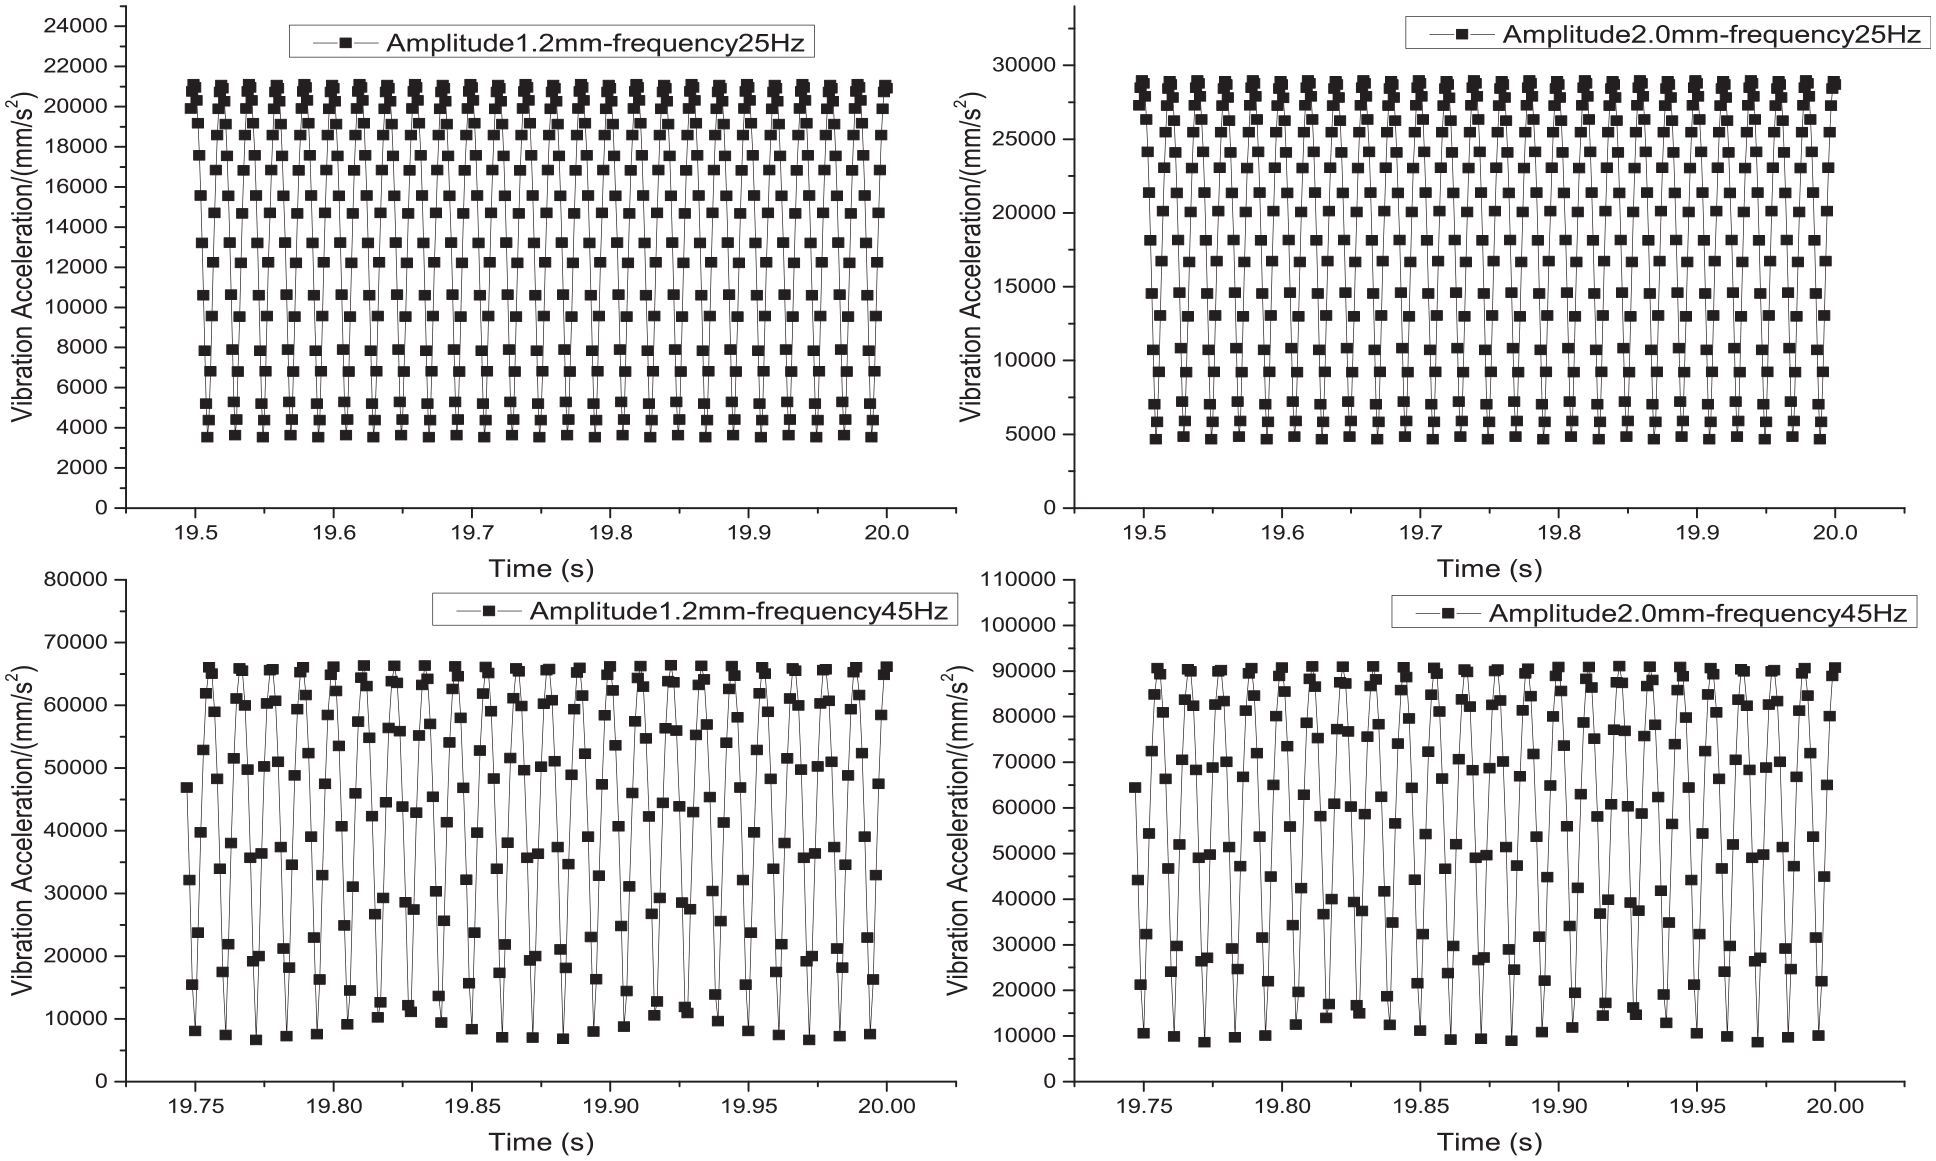
Variation of vibration acceleration.
The average maximum value is calculated from the vibration acceleration values in the selected stable stage, and the interaction between the two factors is analyzed. The results are shown in Table 3. The data in the table is described in Figure 7. It can be seen from the figure that the two straight lines do not cross, and the distance between the two lines increases as the frequency increases, and the opening becomes larger and larger.
Discriminant interaction data table.


Data description.
Definition of evaluation index
The quality of the vibrating-dewatering screen is mainly evaluated by two indexes: one is the screening efficiency that reflects the quality of the screening work.28 The other is its processing efficiency, which is an index of the amount of screening work.
Screening efficiency
According to the current situation of simulation test research, this paper proposes a screening efficiency formula based on time factor. The particle distribution of the screening process as shown in Figure 8. For the vibrating-dewatering screen, the final product is a clean sand on the screen plate that meets the particle size of the building sand, while the particle under the screen plate is mud powder, stone powder, and other impurities. The content of these impurities can objectively reflect the cleanliness of the sand. The more the particle under the screen plate, the smaller content of the impurity in the final product, and the cleaner it is. Therefore, the unit time screening efficiency of the vibrating-dewatering screen is the ratio of the total mass of the particle under the screen plate M to the total mass of the particle in the feed Q which is smaller than the size of the screen seam.

Partition of particles in screening process.
The unit time screening efficiency

Where t, Q, M, α is the working time, total mass of the particle in the feed, total mass of the particle under the screen plate and the content of the particle in the feed Q which is smaller than the size of the screen seam.
Processing efficiency
According to the current situation of simulation test research, this paper proposes a processing efficiency formula based on time factor. The particle distribution of the screening process as shown in Figure 9, For the vibrating-dewatering screen, the more the particle that larger than screen seam in final product A, the better the dewatering and screening effect. Therefore, the unit time processing efficiency of the vibrating-dewatering screen is the ratio of the total mass of the particle that larger than screen seam in final product A to the total mass of the particle in the feed Q which is larger than the size of the screen seam.


Dewatering process of vibrating-dewatering screen.
Where t, Q, A, θ, β is the working time, total mass of the particle in the feed, total mass of the final product, the content of the particle in the feed Q which is larger than the size of the screen seam and the content of the particle in the final product M which is larger than the size of the screen seam.
Research on the influence of parameters on performance
In this paper, the factors such as A, F, δ, and α are studied under the condition that the composition ratio of the particles and the size of screen seam are constant, A single factor simulation test is established to explore the relationship between the above four parameters and screening efficiency and processing efficiency. The test parameters are set based on the screening parameters that can be achieved in the actual work of vibrating dehydration screen, as shown in Table 4.
Single factor test parameter table.

Single factor simulation test results
The law of parameters and evaluation indexes is sought by single factor tests, as shown in Figure 10, and the parameter range with better dewatering and screening performance is obtained. The test shows that the screening efficiency of the vibrating-dewatering screen is the best when A is 1.4 mm, F is 40 Hz, δ is 40°, and α is 5°, and the processing efficiency is the best when A is 1.8 mm, F is 45 Hz, δ is 45°, and α is 5°.

Single factor test results: (a) relation between vibration parameter and screening efficiency and (b) relation between vibration parameter and processing frequency.
Construction of experimental platform
Manufacturing a physical device based on the 3D model of the experimental prototype, as shown in Figure 11. The motor seat of the device is specially designed, and the contact surface with the beam is a circular curved surface, so that the vibration motor seat can freely adjust the angle on the beam, thereby changing the vibrating direction angle; The amplitude can be adjusted by adjusting the angle a between the two polarization blocks on the vibration motor, or by changing the polarization blocks of different masses; The two vibration motors are equipped with frequency converters for control, so that the speed of the vibration motor can be adjusted freely; Adjust the screen inclination by replacing the adjustment block or use a full-threaded long bolt for small-scale adjustment of the screen inclination. The bottom frame is equipped with a sink, and the pump is pumped to make the water recycle, and the laboratory floor is clean and free of water. At the same time, the water tank has the function of stabilizing the bottom frame to avoid the forced vibration of the bottom frame during the experiment. The rubber spring can fully withstand the effects of tension, pressure, shearing, etc., with good performance and long service life. The vibrating dewatering screen uses a polyurethane sieve plate having a sieve size of 2 mm.
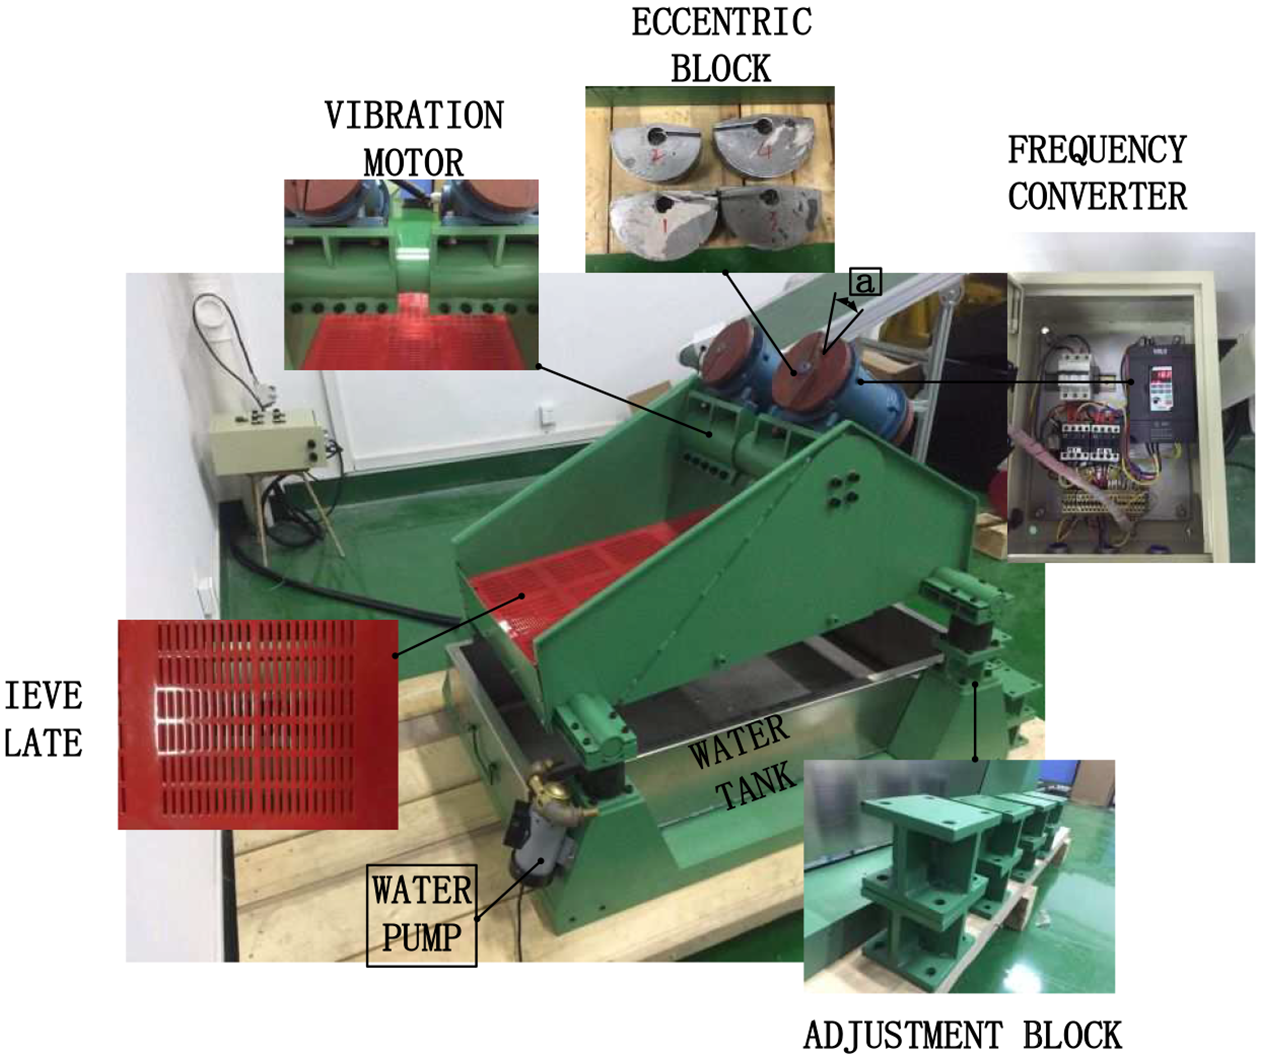
The experiment platform of vibrating-watering screen.
The screening material is quartz sand, whose particle size range is 0.6–3 mm, as shown in Table 5.
Particle size distribution.

The experimental process is shown in Figure 12. After the particles are fed, the particles are sifted by the vibration and the water is washed. The small-sized particles pass through the screen and fall into the mesh of the collected material. The material larger than the mesh particles is along the screen surface. Move up and finally output from the discharge port.

Experimental procedure.
Comparison of single-factor simulation and physical experiments
Through the single factor experiment of the experimental platform, the physical experiment results are obtained, and the experimental results are compared with the regular changes in the simulation test to verify the reliability of the influence of the parameter changes on the dewatering and screening performance in the simulation, as shown in Figure 13.

Comparison of experimental results and simulation results: (a) comparison of screening efficiency under Amplitude, (b) comparison of processing efficiency under Amplitude, (c) comparison of screening efficiency under vibration frequency, (d) comparison of processing efficiency under vibration frequency, (e) comparison of screening efficiency under vibrating direction angle, (f) comparison of processing efficiency under vibrating direction angle, (g) comparison of screening efficiency under slope angle of screen surface, and (h) comparison of processing efficiency under slope angle of screen surface.
It can be seen from Figure 13 that the experimental results are basically consistent with the overall variation of the simulation results, which proves that the simulation results are reliable. However, from the numerical point of view, the screening efficiency and processing efficiency of the experimental results are generally lower than those of the simulation results. This is mainly due to the reason that the physical experimental model and the simulation test model are not completely consistent, and the other possible reason is the influence of the accuracy of the coupling algorithm in the simulation calculation. Although there are differences in values, this difference has no effect on the change of the law, the overall trend is consistent, and can reflect the range of parameters with better performance. Therefore, it is feasible to study the dewatering and screening performance of the vibrating dewatering screen by means of simulation analysis. It is not limited by the fixed model, and it is convenient to obtain the data that is difficult to obtain in the physical experiment, which is helpful for the further study of dewatering and screening performance.
Orthogonal experimental study
The optimal value of each factor is obtained by single factor experiment, but the screening efficiency and processing efficiency of the vibrating-dewatering screen will not be the best when all optimal value of the factor are combined. It is often necessary to match each value of each factor to carry out experiments. The optimal combination of parameters of vibrating-dewatering screen can be determined only after the analysis of the experimental results. However, if each value of each factor is tested once, then for the four values corresponding to each of the four factors in this paper, the number of comprehensive tests is at least 44 = 256, such many tests will consume a lot of manpower, material resources, and time. Therefore, the orthogonal design is used to arrange experiments in this paper, which not only greatly reduces the number of trials, but also facilitates statistics of data.
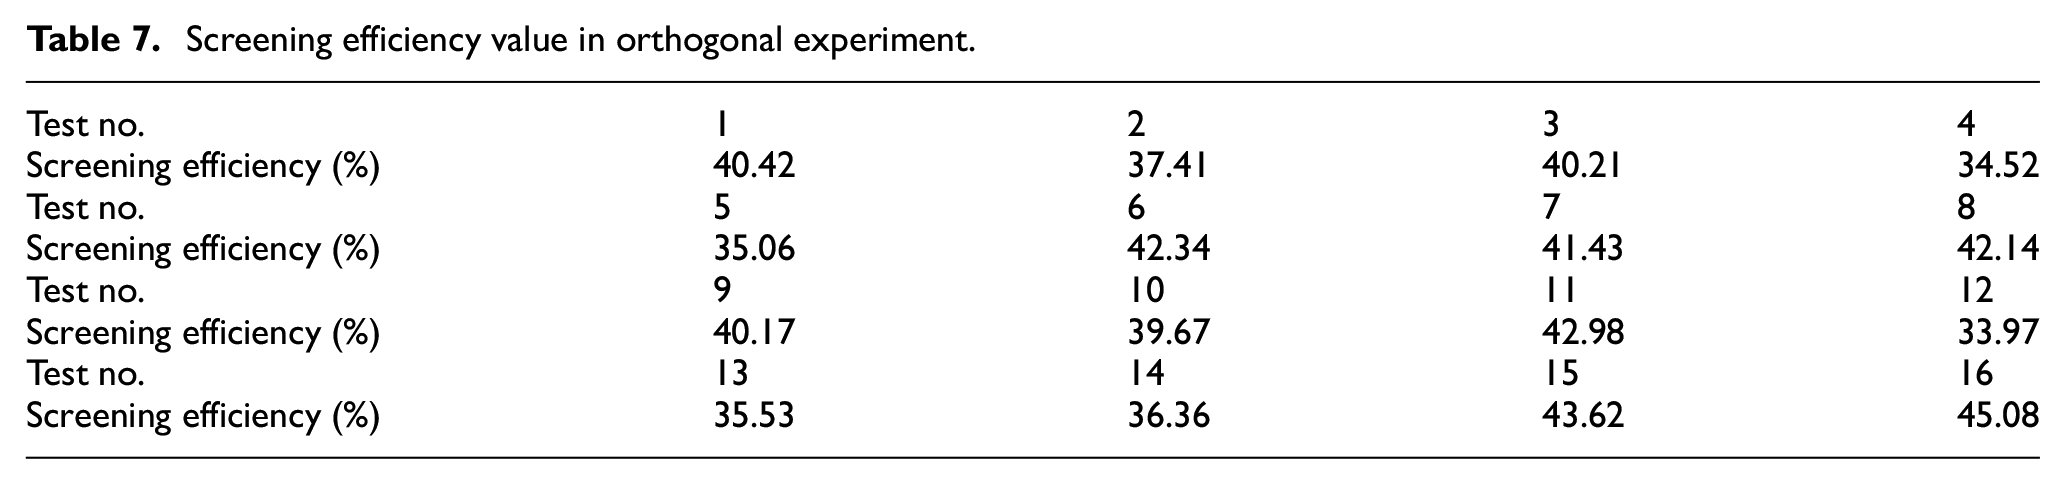
As shown in Table 6, the L16 (45) orthogonal table is used to test, and the D column is set as an empty column to study whether there are interactions among the four factors, that is, whether the factors are independent. The results of the orthogonal experiment are shown in Tables 7 and 8.
Factor level table of orthogonal experiment.

Screening efficiency value in orthogonal experiment.
Processing efficiency value in orthogonal experiment.

Through the processing of the orthogonal experimental results, the range (R) value of each parameter can be obtained, thereby analyzing the sequence factors between the parameters, and finally obtaining the optimal parameter combination, as shown in Tables 9 and 10.
Screening efficiency analysis table.

Processing efficiency analysis table.

For the experimental results, it can be seen that the range value of the empty column is the smallest among all the range values, which indicates that there is no interaction between the experimental factors, and it is verified again that the four factors studied are independent of each other. Therefore, an experimental study of the single factor of four factors is feasible.
According to Table 9, the primary and second order of the factors influencing the screening efficiency of the vibrating-dewatering screen parameters is as follows: δ, F, α, A, and the experimental value can be obtained from the k value of each factor. The optimal solution is as follows: δ is 40°, F is 42 Hz, α is 5°, and A is 1.9 mm. Similarly, according to Table 10, the primary and second order of the factors influencing the processing efficiency of the vibrating-dewatering screen parameters is as follow: α, F, A, δ, and the optimal solution is as follow: α is 4°, F is 44 Hz, A is 1.9 mm, and δ is 46°. Two groups of experiments are carried out again on the results obtained. The experimental results show that the screening efficiency of the group of 40°, 42 Hz, 5°, 1.8 mm is 43.82%, and the processing efficiency of the group of 4°, 44 Hz, 1.9 mm, 46° is 62.47%. The values are higher than the previous 16 sets of experimental results.
Selection of the optimum scheme by comprehensive scoring method
From Tables 9 and 10, it can be seen that the corresponding factors of the two indexes have different influence degrees, and the corresponding optimal scheme of the indexes is also different. It is necessary to determine the unified optimal scheme by a comprehensive scoring method. The two indexes are converted into their membership degree. The calculation method of membership degree is as follows:
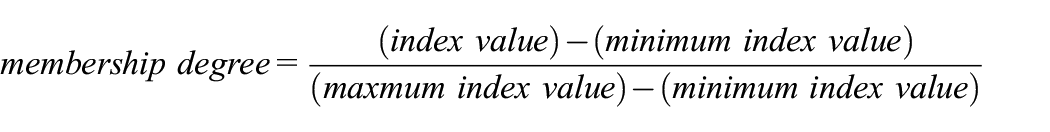
In this paper, screening efficiency and processing efficiency are taken as evaluation indexes. Screening efficiency is to measure the quality of products, and processing efficiency is to judge the production speed of Vibrating-dewatering screen. For vibrating-dewatering screens, high yields are required, but at the same time the quality of the dewatered products is needed to guarantee. Therefore, it can be determined that the two indexes are of the same importance, and the weights of the screening efficiency and the processing efficiency are both 0.5, and the comprehensive score of each group of tests = (screening efficiency membership degree) × 0.5 + (processing efficiency membership degree) × 0.5. The calculation results are shown in Table 11, and the comprehensive score value is analyzed by orthogonal analysis, and the results are shown in Table 12.
Comprehensive score in orthogonal experiment.

Orthogonal analysis table of comprehensive scoring method.
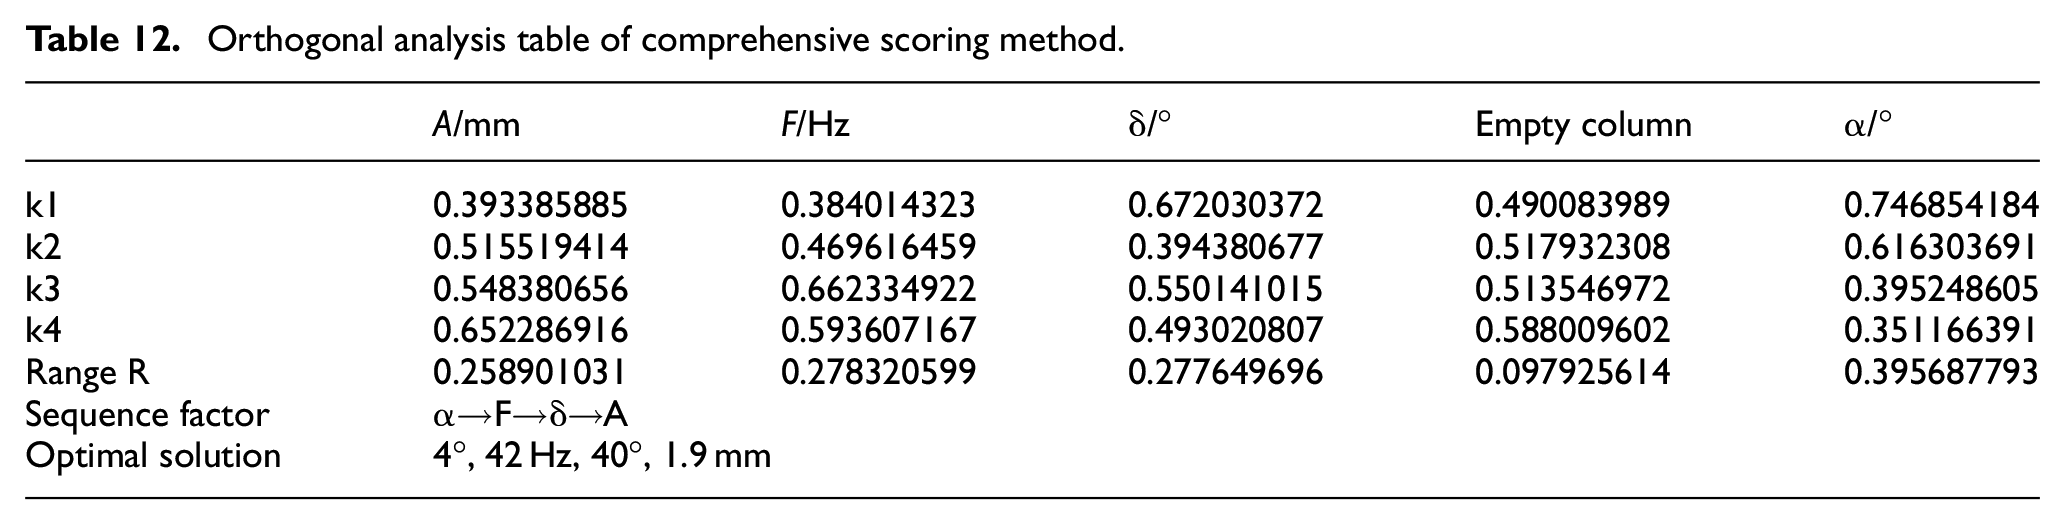
According to Table 12, the primary and second order of the factors influencing the evaluation index of the vibrating-dewatering screen parameters is as follow: α, F, δ, A, and the optimal solution is as follows: α is 4°, F is 42 Hz, δ is 40°, and A is 1.9 mm. A group of experiments are carried out again on the result obtained. The experimental results show that the screening efficiency is 43.71%, and the processing efficiency is 61.85%. The 16 sets of test values with the orthogonal test were the highest and were smaller than the values of the verification experiments added in the latter two groups.
Conclusions
In this paper, through the simulation and experimental aspects, the dewatering and screening performance of the vibrating-dewatering screen is studied and the parameters are optimized. The effects of different parameters (amplitude (A), vibration frequency (F), vibrating direction angle (δ), slope angle of screening surface (α) on the performance of dewatering and screening are analyzed in detail. The main work and conclusions of this paper are as follows:
The FLUENT and EDEM are used to simulate the flow field and the motion of the particles, a coupled simulation model of the vibrating-dewatering screen is established.
According to the single factor test, the screening efficiency of the vibrating-dewatering screen is the best when the amplitude is 1.4 mm, the vibration frequency is 40 Hz, the vibrating direction angle is 40°, and the slope angle of screen surface is 5°; The processing efficiency is the best when the amplitude is 1.8 mm, the vibration frequency is 45 Hz, the vibrating direction angle is 45° and the slope angle of screen surface is 5°.
Experiments are carried out using experimental prototypes. It can be seen from the comparison of the results that the laws of simulation and physical experiments are basically the same, thus verifying the reliability of simulation and calculation.
The platform is used to carry out the orthogonal experiment, the primary and second order of the factors influencing the evaluation index of the vibrating-dewatering screen parameters is as follow: slope angle of screen surface, vibration frequency, vibrating direction angle, amplitude, and the optimal solution is as follow: the slope angle of screen surface is 4°, the vibration frequency is 42 Hz, the vibrating direction angle is 40° and the amplitude is 1.9 mm.
Footnotes
Handling Editor: James Baldwin
Author’s note
All authors have seen the manuscript and approved to submit to your journal. No part of this paper has published or submitted elsewhere.
Declaration of conflicting interests
The author(s) declared no potential conflicts of interest with respect to the research, authorship, and/or publication of this article.
Funding
The author(s) disclosed receipt of the following financial support for the research, authorship, and/or publication of this article: The authors gratefully acknowledged the support from the Program for scientific and technological innovation flats of Fujian Province (2020-GX-16). Fujian Natural Science Foundation (2020J01870).