
Abstract
A set of integral floating vibration isolation methods was developed in this study to remedy the lack of effective measures for over-track buildings. The effect of vibration isolation pads was investigated experimentally; the resulting field measurements were used to determine the time-frequency dynamic responses of vehicle-induced vibration and isolation effects. The characteristics of the vibration source appear to significantly affect the frequency domain distribution of vibration inside the building. When no vibration isolation measures are taken, the internal vibration of the cultural center exceeds the limit. BSW vibration isolation pads R480, R550, and R800 are effective in the frequency range of 16–80 Hz. The vibration isolation level in the Z direction is between 5.6 and 7.3 dB. After floating vibration isolation treatment, the maximum Z vibration level of the cultural center is 56.4 dB in daytime hours and 52.9 dB at night, which satisfies the relevant standard. The proposed method is shown to effectively hinder the structural vibration caused by subways on surrounding buildings.
Keywords
Introduction
Urban rail transportation systems have developed rapidly in recent years. As road networks grow increasingly dense and urban lands grow increasingly scarce, many over-track buildings have been constructed along urban rail routes.1–4 Rail travel provides citizens with convenient transportation and improves the usage rate of urban lands, but the vibration caused by trains spreads through the surrounding soil and affects nearby buildings. Residents living along these routes are affected daily by this vibration and secondary noise. 5 R&D institutions and hospitals that rely on precise instruments are also negatively impacted by such vibration.6,7 It is necessary to take effective action to reduce the effects of railway vibration on surrounding structures.
Over-track buildings suffer more intense vibration than those simply located near rail routes. 8 Previous scholars have extensively investigated vibration problems in over-track buildings caused by rail transportation. Minsili et al. 9 researched building vibration caused by railways on a two-dimensional finite element model of soil structure. Resonance of the local structure was found to be stimulated in certain modes, and accelerated floor speed could intensity suddenly. Xie et al. 10 investigated comfort under over-track building vibration and found that elastic rubber pads under the track bed and anti-vibration gaps of coarse sand can be effective.
Hirao et al. 11 wirelessly recorded the vibration acceleration waveform caused by trains to find that different structure forms affect the vibration responses of buildings differently, and that building vibrations are normally larger than ground vibrations. Metrikine and Vrouwenvelder 12 simulated a subway tunnel and soil layer as a Euler Bernoulli beam and elastic layered medium, respectively, and analyzed the effects and propagation law of vibration waves acting on them. Sheng et al. 13 studied train-induced vibration in over-track buildings in a metro depot to find that frequent train operation under the buildings compromises their residents’ comfort.
The vibration caused by vehicle-track interactions occurs over a wide frequency range. There are three levels of vibration isolation: vibration source,14–16 propagation path,17–19 and building isolation. 20 Among them, vibration source damping measures are the most commonly utilized. When vibration source damping is not effective, it is necessary to utilize propagation path damping and building isolation as supplementary measures. The measures of vibration source and propagation path vibration reduction have been extensively researched to date.
Many recent studies have centered on building isolation. Lou et al., 21 for example, investigated buildings matched with rubber vibration isolation bearings to find that they effectively act on the horizontal component, but actually exacerbate vibration in the vertical component. Zhen 22 found that within a certain thickness range, the vibration responses of over-track building floors are in direct proportion to the thickness of underground room side walls and roof plate frame thickness. Shourestani et al. 23 found that spring isolation vibration systems can effectively restrain the vibration caused by trains on nearby structures. Fiala et al. 24 compared floating floor, base, and room-in-room vibration isolation measures to find that base vibration isolation is the most effective in above-track buildings.
Most studies on this subject have been limited to theoretical and numerical simulations rather than incorporating the effects of vibration isolation measures in real engineering practice. A newly built cultural center above Beijing Subway Line 6 was taken in this study as a research object to investigate the effects of its floating floor vibration isolation system. The vibration response and performance of vibration isolation pads were investigated by experimental analysis and analogy evaluation. A set of vibration isolation methods are proposed accordingly. Field tests were conducted to analyze the time-frequency dynamic responses of floating vibration isolation buildings as subways pass different time periods to evaluate the vibration isolation effects.
Vibration isolation test and integral floating structure design
Vibration isolation principle
Integral floating vibration isolation is a flexible support system that is comprised of rubber vibration isolation bearing and other elastic materials. The system can reduce structure self-vibration frequencies and protect the structure from external interference. This vibration isolation structure can be regarded as a type of quality-spring-damping system, as shown in Figure 1.

Calculation model of vibration isolation system.
The amplitude of structural foundation caused by trains is characterized by harmonic motion

where M, C, K are the mass, stiffness, and damping of the vibration isolation system, respectively;
According to the theory of structural dynamics, the vibration acceleration transmissibility of the isolation system can be expressed as:
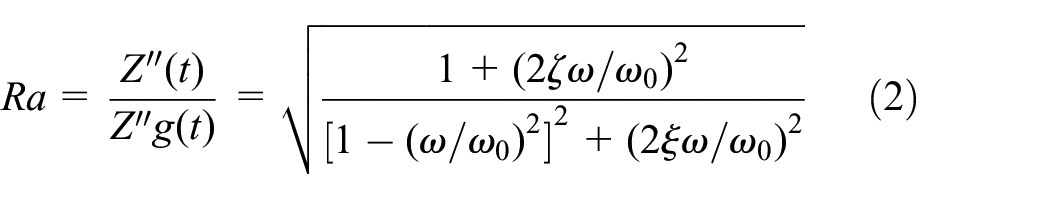
where
As the frequency ratio
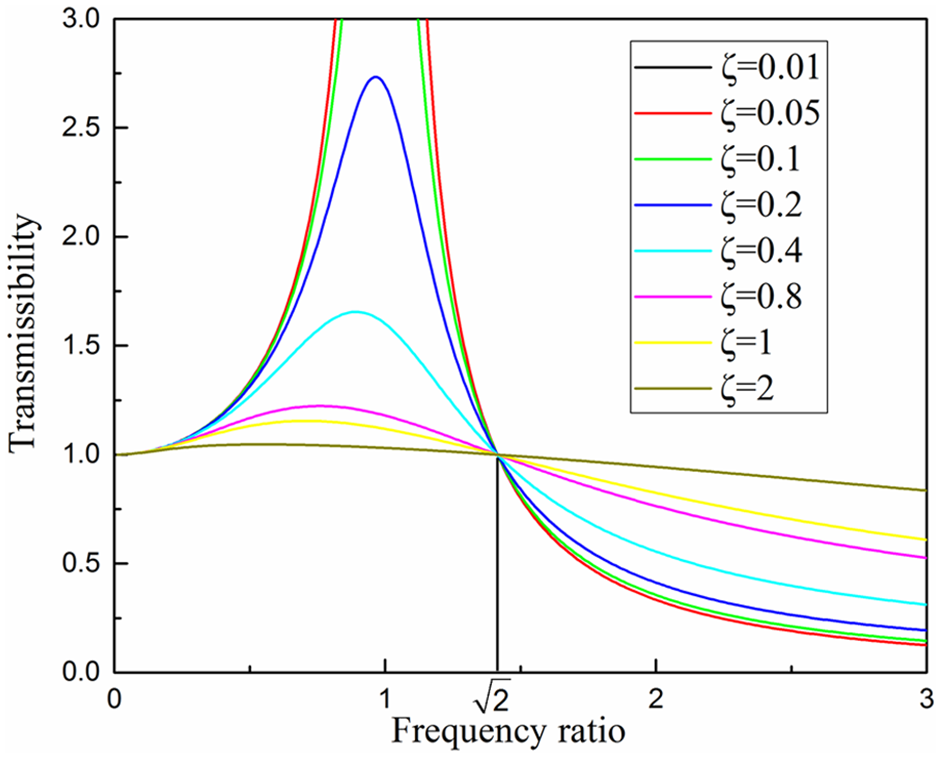
Vibration transmissibility.
Vibration isolation test
Floating vibration isolation performance tests were conducted on R480, R550, and R800 rubber pads in Regupol mode (BSW Co., Germany). The vertical stiffness of the three vibration isolation pads is 25, 50, and 130 KN/mm, respectively, and their natural frequencies range from 13 to 16 Hz. Detailed parameters are given in Table 1.
Parameters of BSW vibration isolation pads.

Tests were carried out on a solid concrete vibration isolation platform (Figure 3). Impact balls fell freely from 1 m above the platform as the vibration acceleration of the concrete plates meeting load designing code was measured as supported by R480, R550, and R800 rubber pads and by hard steel blocks, respectively. Three vibration isolation pads were cut into 10 × 10 cm size for supporting the upper concrete plate through two symmetrical regions. To ensure the natural frequency was in the effective vibration isolation range, the mass of concrete plates supported by R480, R550, and R800 were designed as 50, 150, and 300 kg.

Vibration isolation platform test.
The typical acceleration curve of concrete plates under impact is shown in Figure 4. The concrete plate supported by rubber vibration isolation pad showed a significantly lower vibration response than that supported by hard steel. Due to the short time of a single impact, Fourier transform was performed on 10 acceleration curves to determine the acceleration grades of the 1/3 octave frequency band of concrete plates under different support conditions as shown in Figure 5. Compared to the steel block support, the vibration performance of concrete plates supported by BSW vibration isolation pads R480, R550, and R800 were consistently stronger. The vibration responses were higher at frequencies of 16 Hz or below. Above 16 Hz, there was obvious vibration declination; vibration transmissibility was higher than one when in the natural frequency and lower area of isolation pads, and the high frequency section moved beyond its natural frequency gradually as frequency increased. This gradual decrease in vibration transmissibility affected the vibration isolation performance of the system.
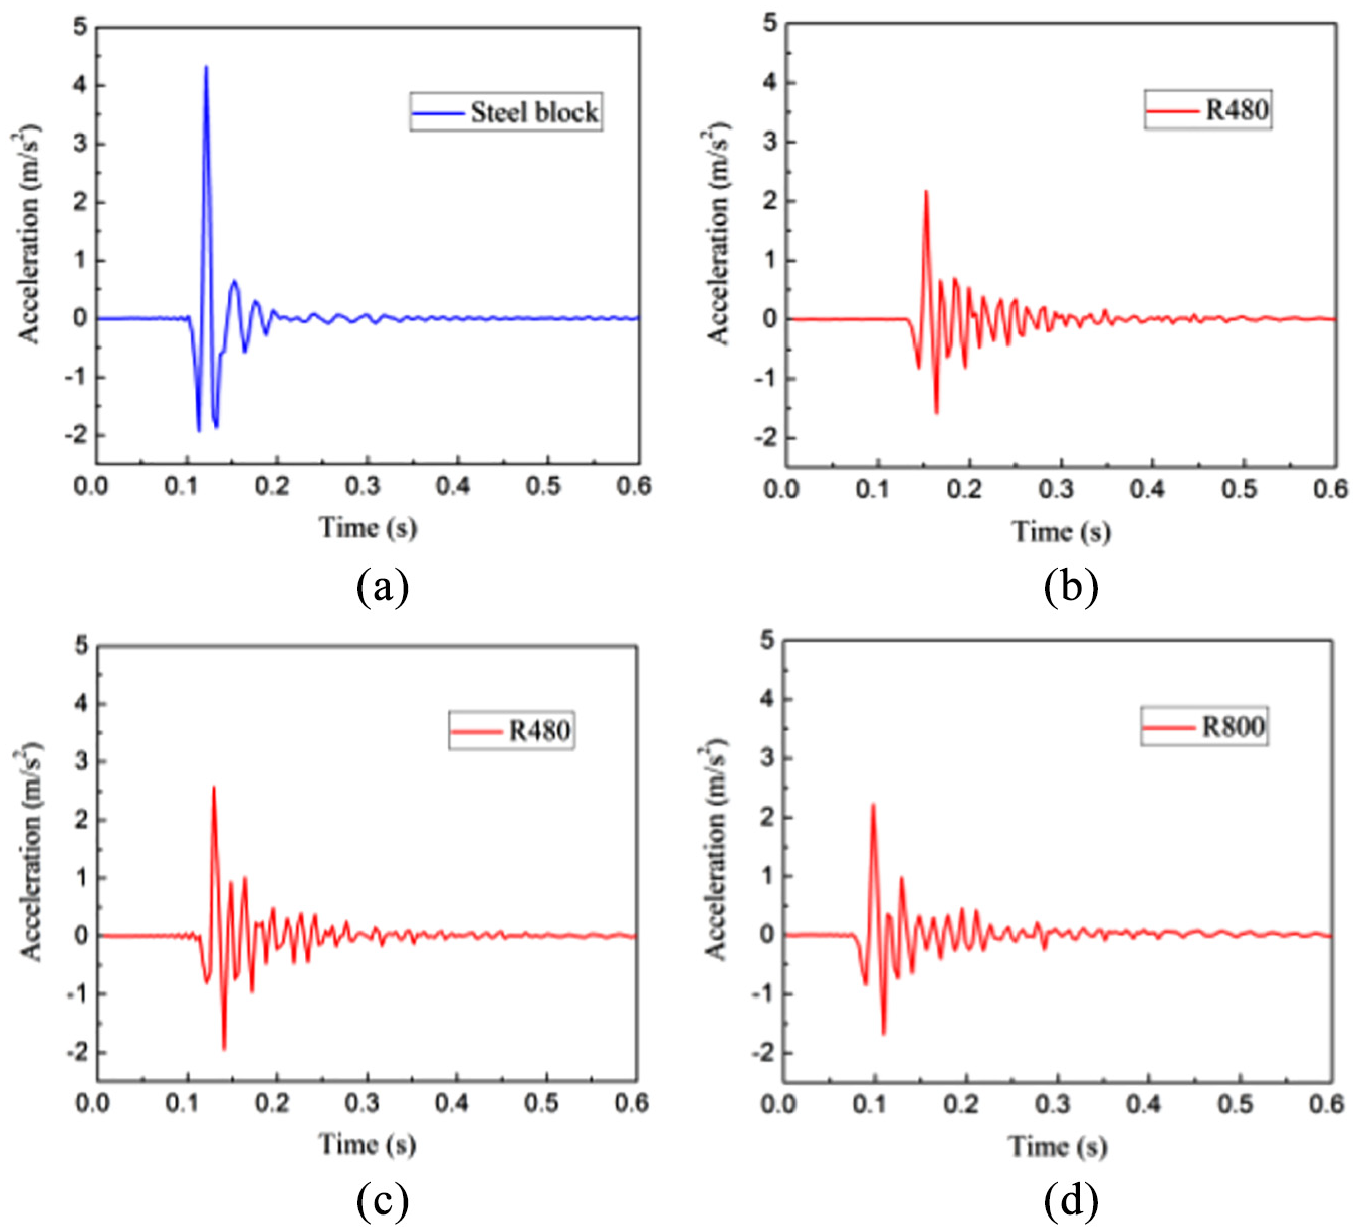
Acceleration time history of concrete slab (a) steel block (b) R480 (c) R550 (d) R800.

1/3 Octave vibration level of concrete slab.
Figure 6 shows the insert losses of the 1/3 octave band of the concrete plates supported by the three BSW vibration isolation pads compared with the hard steel block support. A positive insert loss value indicates a decrease in vibration, and vice versa. The BSW vibration isolation pads appear to work properly at frequencies lower than 16 Hz. Between 1.6 and 16 Hz, the vibration intensifies to a maximum value above 8 dB. Between 16 and 80 Hz, certain vibration reduction effects emerge in each frequency section and increase overall as vibration damping capacity increases. The maximum vibration damping capacity is more than 35 dB in the high-frequency section.

Insertion loss of BSW pads.
The vibration grades of each frequency section were modified to enhance the overall vibration isolation performance of the rubber pads according to the Z-weighting factor. The damping capacity of vertical vibration to concrete plates supported by various rubber pads is shown in Table 2. All the rubber pads show reduced vibration levels compared to the hard steel blocks, with damping capacities between 5.6 and 7.3 dB. The floating structures show favorable vibration isolation performance.
Vibration level and reduction (dB) under different supports.

Integral floating structure design
In the integral floating vibration isolation structure, the flexible vibration isolation layer supports all vertical loading of upper structures. As a result, the vertical stiffness of vibration isolation pads should be designed strictly to restrict the vertical self-vibration frequency of the structures within the effective vibration isolation area. A vibration isolation layer set on the basic foundation generates uneven settlement due to the differences in pressure distribution across the foundation. To resolve this and ensure stability of the upper structures satisfying the vibration isolation performance requirements, an integral floating structure was designed in this study via the following procedure.
(1) Vibration isolation materials of varying stiffness between damping ratios 5%–10% were selected.
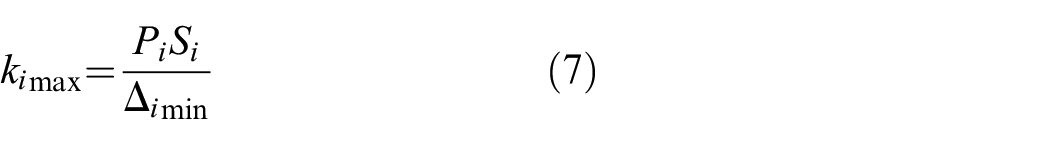
(2) Based on the pressure distribution of target building’s foundation, vibration isolation pads were divided into n areas. The square meters of each area are
(3) According to the minimum predominant frequency

where
(4) The elastic deformation, pressure and stiffness of each region were ensured to meet the following requirements:

where

The minimum value of elastic deformation in each region can be determined as follows:
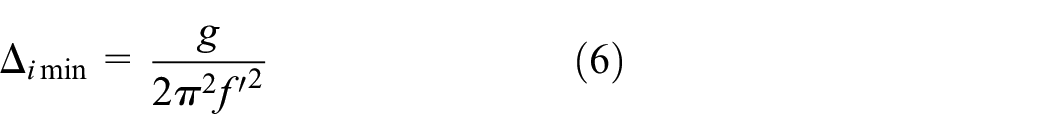
The maximum stiffness of the vibration isolation pad in region i can be determined by combining equation (6) with equation (4):
(5) The stiffness of the corresponding vibration isolation pad was selected according to the pressure of each region. The
(6) The natural frequency of the building vibration isolation system can be calculated as follows:

Equation (8) can be substituted into equation (2) to calculate the vibration transmissibility Ra, and determine whether the vibration isolation efficiency meets the relevant requirement.
A flow chart of this method is shown in Figure 7.

Design process of floating vibration isolation system.
Vibration evaluation and isolation design of a cultural center
Relationship between building and subway system
The newly-built cultural center is located directly above the Apple Park section of Beijing Subway Line 6 and has a total area of 41,000 m2. There are seven above-ground floors. The height of the first to seventh floors is 5.1 m and that of the eighth floor is 5.5 m; the total height is 46.62 m. There are three underground floors each with a depth of 16 m and heights of 4, 5, and 6 m, respectively. The main structure above ground is a shear wall. The second to fourth floors form a combined structure of dual up and down layer curved apart space modeling and internal cone-shaped curved surfaces. Underground structures are frame shear walls with independent pole foundations.
Line 6 passes through the northwest point of the cultural center on its double-line horseshoe tunnel route. The elevation of the top surface of the tunnel structure is −21.5 m and that of its basic foundation bottom plate is −15.4 m. The vertical distance between them is 5.1 m.
The relationship between the building and subway space is shown in Figure 8(a) and (b).
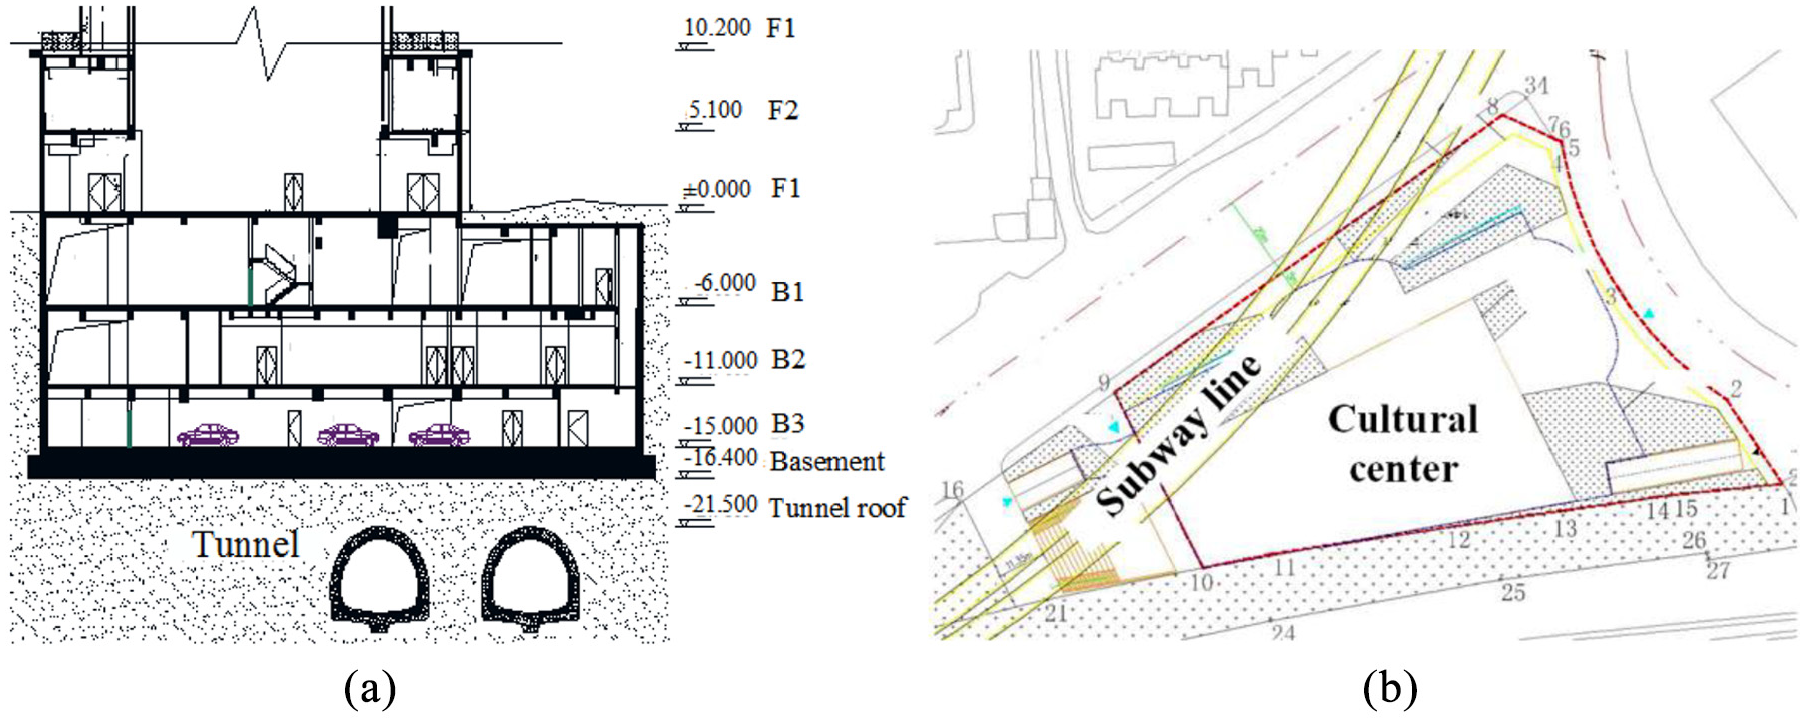
Relationship between cultural center and subway (a) longitudinal section and (b) cross section.
Vibration prediction and evaluation
In accordance with “Standard for limit and measuring method of building vibration and secondary noise caused by urban rail transit” JGJ/T 170-2009 25 and “technical standard for vibration comfort of building floors” JGJ/T 441-2019 26 as well as the general standards for normal usage of the structure, this cultural center is a Class I residence and entertainment area based on its functional areas. It is equipped with theater, cinema, auditorium, exhibition hall, and other parts. The available vibration controlling standards are listed in Table 3. The limit of vertical vibration in the rooms is 65 dB during daytime hours and 62 dB at night. The vertical peak acceleration is 0.15 m/s2.
Vibration limits (dB).
Another building on Line 6 was analyzed as an analogy to estimate the internal vibration responses of cultural center. This building is also located directly above the line and has the same type of steel spring floating plate bed structure. The structure’s basic foundation is about 15 m to the top of tunnel lining. It is near the culture center and has similar geological conditions (e.g. back-filling, fine sand, silty clay, and pebble layer from top to bottom) and rail route conditions (e.g. train speed).
Ten vibration responses of building foundations under passing trains from 7 to 8 a.m. and 10 to 11 p.m. were collected with VLZmax as the evaluation index. The acceleration grade of each 1/3 octave frequency section was obtained through Fourier transform of the time histories. The 1/3 octave vibration grades of typical trains are shown in Figure 9. The peak value of acceleration and VLZmax of each train as calculated by Z weighting factor correction are shown as Table 4. The peak value of acceleration in rooms with 20 trains passing is 0.025–0.071 m/s2, which does not exceed the limit of 0.15 m/s2. The VLZmax range is 62.6–72.4 dB for 10 trains during the day, with an average value of 68.9 dB. At night, the range is 63.3–68.7 dB and the average value is 66.3 dB.

Vertical 1/3 octave vibration level of structure.
Vertical Z vibration level (dB) and peak acceleration (m/s2) with 20 trains passing.

The basic bottom plate of the analogy building is about 15 m away from the top of the tunnel, so the vibration declines to some extent after propagating through the surrounding soil. The distance of the cultural center is only 5 m from the top of the tunnel. The distance was corrected according to “Code for application technique of metro noise and vibration control” DB11/T 839-2019. 27 A distance attenuation allowance of 2 dB was considered in the calculation. The predicted value of the cultural center as affected by subway operations is 70.9 dB during the day and 68.3 dB at night, which exceed the vertical vibration limit for rooms (65 dB during the day and 62 dB at night). The analogy evaluation results suggest that passive vibration isolation measures be taken to reduce the effects of subway vibration.
Vibration isolation design
As shown in Figure 10, the foundation loading of the cultural center ranges between 50 and 800 kN/m2. The structure base can be divided into three areas as per the vibration isolation and economic effects. The highest frequencies caused by subway operation are between 40 and 80 Hz. The vibration isolation pads R480, R550, and R800 of BSW series at a damping ratio 5% were selected as foundation vibration isolation materials accordingly (Table 1). The size of each vibration isolation pad is 2 m × 1.15 m × 0.03 m. They were installed in different positions of the foundation area. The total area of various vibration isolation pads is about 23,000 m2, among of which the area of R480 is 11,700 m2, that of R550 is 6300 m2, and that of R800 is about 4800 m2. The vibration isolation distribution and field layout are shown in Figure 11(a) and (b).

Foundation reaction under gravity load.

Layout of vibration isolation pads (a) distribution of vibration isolation pads and (b) site construction.
Verification of field vibration test
Subway operations have complex and dynamic effects on surrounding buildings. The vibration propagation laws differ significantly when the same building is tested at different times or locations. The vibration responses of the internal structure of the cultural center were tested at peak time points in the morning, evening, and night for the sake of comparison to verify the effects of the vibration isolation pads. Whether the internal vibration responses on the peak periods of culture center comply with vibration control standards was determined accordingly. Subway Line 6 and the cultural center were operated normally throughout the course of the test.
Test solutions
Data collection was conducting using an INV3018C type, 24 bit high-precision collection instrument (China Orient Institute of Noise & Vibration). The acceleration sensor is a super-low frequency vibration pickup of 941B type (Institute of Engineering Mechanics, China Earthquake Administration). Its sensitivity is 0.3 V/m/s2, and its maximum range is 20 m/s2. The sample testing frequency was 512 Hz. Vibration acceleration was adopted directly from the cultural center’s basic foundation, ground, and each floor. There are 13 testing points in total (Figure 12).

Measuring point distribution (a) Base and ground (b) Each floor.
In the internal structure, the sensitive area of right above subway was selected as the investigation point. The three underground floors are near to the subway vertically, so inspection points 1–5 were arranged in the basement layer and 7–13 at each floor right above the inspection point 2. The inspection points 7 and 8 are in the theater. Others (9–13) are located in the middle of each floor. Inspection point #6 is located on the ground surface 0.5 m away from the building. The peak inspections of the morning and evening were conducted during 7–8 a.m. and 5–7 p.m. when the passengers flows were maximal. Night inspections were conducted at 10–11 p.m. Vibration data are collected for 10 trains.
Analysis of test results
Responses of vibration acceleration
The typical vertical acceleration and frequency curve of the field ground surface (inspection point 6), internal structure foundation (inspection point 2), and second floor (inspection point 8) are shown in Figure 13. After analyzing all measurements in the frequency domain, the main frequency in the external grounds was found to range from 0 to 60 Hz with a peak value of about 30 Hz. The distributions of vibration responses of the internal structure foundation and second floor inspection point are similar with that of the field ground, all from 0 to 60 Hz. The structure foundation has a very obvious peak value near 30 Hz. The second floor inspection point has a small wave peak near 10 Hz and not at 30 Hz.

Typical vertical acceleration and frequency curve (a) Inspection point 2 (b) Inspection point 6 (c) Inspection point 8.
The vibration at each inspection point of the internal structure was analyzed to investigate the structural self-vibration performance. Figure 14 shows the typical acceleration and frequency curve of the internal building foundation and second floor under environmental vibration. There is an obvious environmental vibration peak near 10 Hz which can be attributed to the vertical self-frequency. The vertical self-vibration frequency of the floor complies with the small wave peak of floor responses caused by subways (Figure 13). Internal environmental vibration inspection points do not show peak values around 30 Hz. Therefore, the main peak value, 30 Hz, of the internal vibration response is mainly caused by subway operation.

Acceleration and frequency curve under environmental vibration (a) Base (b) Second floor.
The peak value of the internal cultural center is similar to the peak value of subway vibration, indicating that the characteristics of building floor vibration responses to subway operation mainly depends on train vibration characteristics. The self-vibration characteristics of floors have certain effects on subway vibration responses as well.
The peak acceleration of each floor in peak periods are shown in Figure 15. The structure horizontal peak acceleration values caused by subway operation are much lower than the vertical peak acceleration values. Each tested vertical peak acceleration falls between 0.007 and 0.01 m/s2 with none that exceed the stated limit.
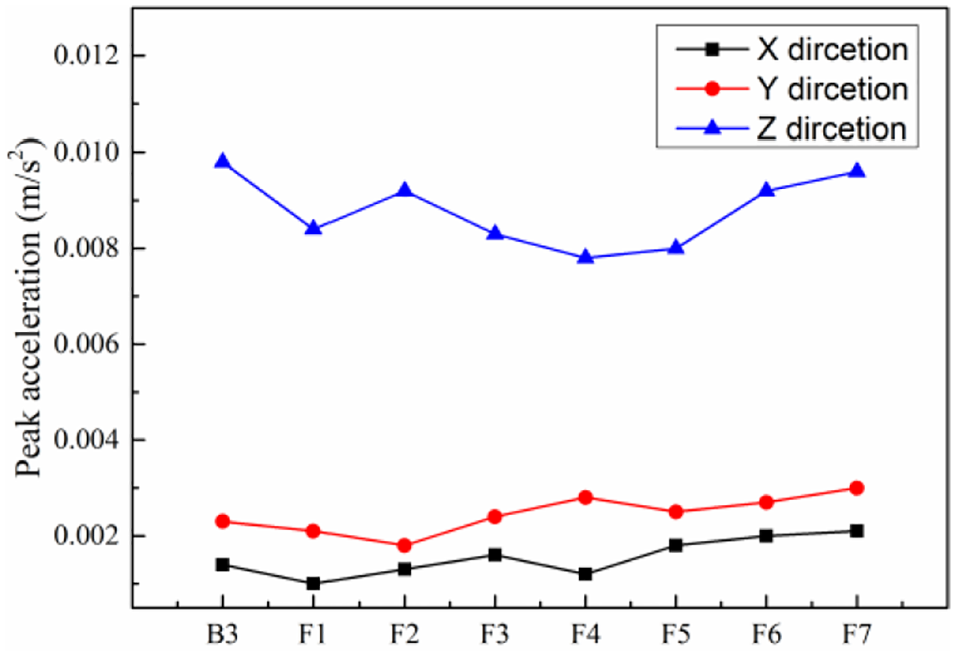
Peak acceleration of each floor.
Table 5 shows the vibration distributions of different floors at different times. The structural vibration caused by subways is mainly vertical. All structural vertical vibration levels are higher than the horizontal vibration level. At higher floors, the horizontal vibration appears to intensify; the vertical vibration level decreases and then increases. The range of vibration level during peak periods in the mornings for various floors is between 49.0 and 56.4 dB and that in the evenings are 46.6–52.9 dB, which all meet vibration control standards of 65 dB during the day and 62 dB at night. The vibration responses of internal cultural center are reasonable and the vibration isolation pads are effective.
Vibration level of each floor in different periods.

Analysis of vibration isolation effects
To further analyze the vibration isolation effects of the rubber pads, the vibration responses of the ground surface (inspection point 6) and first floor of the structure (inspection point 7) were compared as they share the same elevation and a similar spatial position with the subway. The vertical vibration is significantly higher than the horizontal vibration caused by the subway, so the vertical acceleration curve was subjected to time frequency transformation and the average sample value was determined from 10 trains. Figure 16 shows the average frequency section vibration grade and transmission loss for internal and external inspection points. The vibration isolation pads appear to make the vertical vibration of internal inspection point 7 similar to that of inspection point 6 in the low frequency section (1.25–16 Hz). The vibration isolation effects are not obvious. In the high frequency section (>16 Hz), conversely, the vibration is reduced significantly and the vibration isolation effects increase with frequency. The maximum vibration reduction is 80 Hz, where the capacity exceeds 30 dB. These results are in accordance with vibration isolation testing laws.

Vibration level and transmission loss of indoor and outdoor inspection points (a) Vertical vibration level (b) transmission loss.
Corrected and superimposed vibration grades in different frequency sections of internal and external structures are shown in Table 6. It appears that vibration isolation pads can reduce vertical vibrations peak values in different periods by more than 52%. The vibration of subway operations is stronger than that of testing excitations. The vibration isolation capacities of day and nighttime hours are 11.6 and 10.8 dB, respectively; the vibration isolation effect is more obvious under real-world conditions than laboratory testing conditions. The field measurement results indicate that vibration isolation pads protect integral floating structures from the vertical vibration caused by subways.
Reduction of Z vibration level and peak acceleration.

Conclusion
(1) A floating vibration isolation method is proposed and validated based on a real-world structure. According to the substrate pressure distribution, different types of flexible vibration isolation pads are implemented to minimize the intrinsic frequency of the whole system and restrict vertical vibration frequency within the effective isolation range. Material selection and stiffness design principles are established which guarantee both the vibration isolation efficiency and vertical deformation of the system. This method may provide a workable reference for similar projects.
(2) Except for a certain amplification under 16 Hz, BSW vibration isolation pads R480, R550, and R800 show favorable vibration attenuation in the high-frequency range from 16 to 80 Hz. The vibration isolation effect intensifies as frequency increases. In comparison with the non-insulated system supported by rigid steel blocks, the vibration isolation value of the rubber pad supported systems are between 5.6 and 7.3 dB. Experimental results show that the floating support mode provides effective vibration isolation.
(3) The structural vibration caused by subway operation occurs mainly in the vertical direction, while the inner vibration frequency distribution of the structure ranges from 0 to 60 Hz. The peak frequency is close to that of the ground surface; both are approximately 30 Hz. The vibration response of the building in the frequency domain primarily depends on the vibration characteristics of the subway. The self-vibration characteristics of floors have a secondary effect on the vibration response.
(4) The horizontal vibration level of the building increases monotonically as floor number increases, while the vertical vibration decreases first and then increases. After the floating vibration isolation system is implemented, the vertical Z vibration level caused by subway operation is 49.0–56.4 dB during daytime hours and 46.6–52.9 dB at night, which is in accordance with the vibration standard. The measurements indicate that the integral floating vibration isolation method minimizes the vertical vibration caused by subway operations.
Footnotes
Handling Editor: James Baldwin
Declaration of conflicting interests
The author(s) declared no potential conflicts of interest with respect to the research, authorship, and/or publication of this article.
Funding
The author(s) disclosed receipt of the following financial support for the research, authorship, and/or publication of this article: This work was supported by the National Key R&D Program of China (Grant no. 2019YFC1521000) and the Fundamental Research Funds for the Central Universities (Grant no. 2020JBZ110, 2020YJS120).