
Abstract
Molecular dynamics (MD) simulation has been applied to study of pull-out of Halloysite nanotubes (HNTs) from a polyurethane (PU) matrix. First, the Machine learning (ML) particle swarm optimization (PSO) method was used to obtain force field parameters for MD from data of density functional theory (DFT) calculations. The current study shows the possibility of using a PSO technique to modify the force field with DFT data with less than 5 kcal/mol discrepancy. Second, we considered the influence of atomic interface on pulling out of HNT from PU. Energy variation has been proposed as the cohesion strength between matrix and nanoparticle. In addition, the best Lennard Jones parameters in the MD simulation make good agreement with an experimental sample stress-strain response.
Keywords
Introduction
Nanomaterials and Nano-composites have been studied in various applications. One innovative approach is to employ a polymer in combination with a strong nanomaterial. In this study, we will consider a composite where the polymer matrix is polyurethane (PU) and the nanoscale material is Halloysite nanotube (HNT).
Carbon nanotubes are the most commonly studied nanomaterial; however, toxicity and high cost make them less attractive in the industry, thus it has limited practical applications. Halloysite nanotubes are extensively available around the world at low cost, therefore, it has received more attention from researchers.
Halloysite is a clay tube with 600–1000 nm length and an inner radius of 30 nm, an outer radius of 100 nm. It is a mineral nanoparticle used in several nanomaterials, especially composites. Halloysite is a natural alumina-silicate (Al2Si2O5(OH)4·2H2O) with a predominantly hollow structure. HNT consists of a two-layer structure, where the exterior face is a tetrahedral, siloxane structure, and the inner face has an octahedral composition with alumina assemblies as described in Figure 1.

Schematic of nanosheet and nano scroll form of HNT. 1
Most research on Halloysite has concentrated on measured mechanical properties under different loading. 2 Lu et al. 3 experimentally measured the elastic modulus. They found that the elastic modulus of the HNT layer is 130 ± 24 GPa. Lvov et al. 1 calculated Young’s modulus of a multi-wall alumino-silicate nanotube. They obtained Young’s modulus in the range of (230–340 GPa). Guimarães et al. calculated the young modulus of different arrangement of HNT nanotubes by applying DFT. They obtained the elastic modulus in the range 230–300 GPa for a zigzag arrangement and 300–340 GPa for the armchair arrangement. 4 Moreover, the elastic modulus of HNT declines with a growth radius. Also, other researchers found that HNTs are significantly flexible and can be bent 90° without breaking. 5
Polyurethane is a copolymer formed by a di-isocyanate (OCN–R–NCO) and a polyol or diol (OH–R′–OH), where R is aromatic or aliphatic and R′ is a linear hydrocarbon chain. Also, PU is comprised of soft segments (SS) from the polyol and hard segments (HS) of the crystalline di-isocyanate. 6 PU has a variety of uses in a range of products. 7 Furthermore, polyurethane has good corrosion resistance and toughness, which is effective functionality for the defense industries. 8 Recently, new applications of polyurethane have been developed for impact protection of structures, including anti-explosion and ballistic loading. 9 The chemical arrangement of a polyurethane monomer applied in this research is presented in Figure 2. Later in this work, in the fitting process we are using one monomer (n = 1, m = 1) and for uniaxial stretching simulation the chain composed of two repeating monomers (n = 2), and five repeating polyol part (m = 5), and one di-isocyanate part.
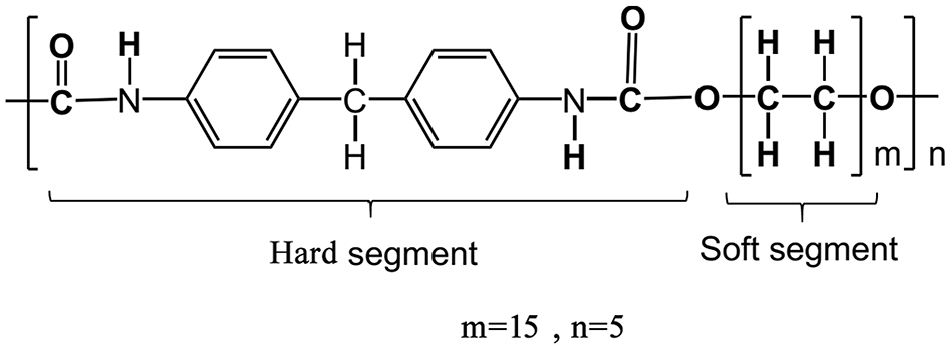
Schematic of polyurethane. 6
Molecular Mechanics uses potentials that are functions of the intramolecular distance between pair atoms. These potentials are determined from experiments or DFT calculations. The potential energy function is derived from positions of the atoms that form a molecule. Some common forcefields are CVFF, Dreiding, UFF, and PCFF-IFF.10–13
The total energy of a molecular structure is giving by;

The first four terms in equation (1) introduce the stretched bond energy (b), bond angles energy (θ), torsion angle energy (ϕ), and distortion energy respect to a reference plane (χ). The final terms represent the non-bonded interactions as a sum of van der Waals and electrostatic. All terms are function of the distances (rij) between atoms. Each force field defines a specific coefficient for each set of atom types. Because of computational accuracy, the polymer consistent forcefield (PCFF) with the interface extension (PCFF-IFF) has been used for this study.14,15
Li et al 16 studied the hardness of PU-HNT nanocomposites. They indicate that the scratch resistance has been improved by adding 5 wt% HNT. Gaaz et al 17 reported that the optimal level of HNT is 1 wt% for improving tensile strength.
The purpose of machine learning (ML) is to improve efficiency and accuracy.18,19 Lately, a variety of complex machine learning (ML) algorithms for small and large systems have been recommended for using the total energy data of DFT calculations. 20 Those ML models have been developed for small atomic configurations, which is not suitable for large atomic configurations. 21 In this paper, we introduce an alternative method to improve force fields in MD with the precise results of DFT calculations.
Lately, fitting to DFT results have become a common way to optimize force fields.10,22–24 Energy-fitting utilizes the atomic energy obtained from a high-accurate DFT simulation. Ercolessi and Adams, 25 introduced force-fitting for the first time, and it was employed in numerous simulations26–29 to improve the efficiency of semi-empirical quantum methods.30,31 Wu et al. 32 optimized parameters of a potential field for long-range interaction through a ceteris paribus optimization method, and Daven et al. 33 optimized Lennard-Jones parameters by a genetic algorithm.
There are several non-linear optimization techniques, such as iterative direct gradient minimization methods which correspond to a local minimum (e.g. Levenberg-Marquardt 34 ), or global minimum explorations (e.g. simulated annealing 35 ), which are computationally expensive for energy matching function. Therefore, we used a particle swarm optimization approach.
Most studies of combined loading response concentrate on the effective response of the composite.36–38 Hence, they do not explicitly focus on the interfacial performance during failure. Subsequently, micromechanical simulations, which predict the effective behavior of nanocomposites are often based on an assumption that the interface is completely bonded or partially bonded.39–41
There are two mechanisms to explain the strengthening of a composite by adding fibers. First is the energy absorption when the fiber pulls out, another is the crack-bridging by the fiber at the crack zone. Usually, fiber pull-out is an essential way for achieving favorable strength. As such the understanding of the mechanism of the pull-out in the HNT–polymer composites are essential. Therefore, at the end of this research, the pull-out simulation has been conducted using the molecular dynamics, to study the effects of the interaction between the HNT-PU nanocomposites.
Overall, the purpose of this research is to develop an accurate description of the interaction energy between HNT and PU chains. This new force field will be applied to molecular dynamics (MD) simulations of HNT/PU composites, which are too expensive to evaluate with DFT. For this purpose, in Section 2 we will introduce our computational technique in detail, then the results are provided in Section 3, followed by the MD pulling-out simulation in Section 4.
The methodology of the fitting process
In order to employ HNT in different applications, it is necessary to consider materials exposed to different loading conditions. The purpose of this section is to use computational techniques for fitting methods at the atomistic level for studying the dynamic behavior of the polymer matrix reinforced with a nanoparticle. Specifically, here we apply computational techniques to fitting the non-bonded energy between HNT and PU obtained from density function theory (DFT) with a form amenable to Molecular Mechanic calculations. Here are steps for this computation method:
The optimized lattice parameter of simple unit cell HNT is found.
A slab surface is created according to the optimum unit cell of HNT and the computational cell was extended in the z-direction to create a vacuum space in which to embed a PU monomer.
For DFT calculations, the cut-off energy and minimal k-point mesh are determined through convergence studies to be 580 eV and 10 (auto mesh) respectively. These parameters are used for all trajectory calculations to minimize computational cost.
With DFT, we calculate the potential energy as a function of the vertical position of the PU monomer relative to the flat surface of the HNT (see Figure 3).
We repeat step 4, this time with PCFF-IFF. Then, the interaction energy is calculated for different vertical positions of the PU.
In our approach, the particle swarm optimization (PSO) was applied to find the best fit between DFT and the non-bonded Lennard-Jones (LJ) parameters used in PCFF-IFF.

(a, c) Nearest PU-HNT configuration and (b, d) farthest PU-HNT configuration.
Preparation of supercell
We used DFT calculations to compute optimum lattice parameters. The system is relaxed with the cut-off energy of 17,300 kcal/mol. The cut-off energy is determined through convergence studies. DFT was carried out with VASP 42 with the PBE gradient-corrected functionals 43 methods. The calculation was performed at zero temperature. Reciprocal space was represented by the Gamma k-points scheme with 5 × 5 × 5 grid meshes. There are 34 atoms in the unit cells. The structures are relaxed without symmetry constraints with the cut-off energy of 750 eV. The projector augmented wave (PAW) pseudopotential 44 was applied for describing the core electron interactions. The result is provided in Table 1. Then a supercell was generated from 3 × 3 × 1 optimized unit cells and the cell extended cell in the z-direction to form a vacuum space to embed a PU chain (Figure 3). We move the PU away with equal increments (0.35 Å) to compute the energy of each configuration. The distance was calculated based on the center of mass of the HNT slab and the polymer chain.
Computed and experimental lattice parameters of geometry optimization; parentheses are shown percentage deviations.

Data are reported in Å and °.
The interaction energy calculations (DFT approach)
Using the generated model, we employed the density function (DFT) approach to calculate the non-bonding energy between HNT and PU. The interaction energy between the PU and the HNT was computed by the following equation;

Where Etot-DFT refers to the total energy of the structure (HNT and PU), EHNT indicates the energy of the isolated slab HNT, EPU refers to the energy of the isolated polyurethane, and EinterDFT indicates interaction energy between HNT and PU molecules.
Density Functional was performed with the “Vienna Ab-initio Simulation Package (VASP)” 42 with the PBE gradient-corrected functionals 43 to compute the total energy of the above structure for each vertical increment. The projector augmented wave (PAW) pseudopotential was applied for describing the core electrons interactions. The calculation was performed at zero temperature. Reciprocal space was represented with k-points grid meshes by an auto mesh with weighing 10. There are 350 atoms in the supercells and the cut-off energy was 13,380 kcal/mol. The cut-off energy is determined through convergence studies. The ions were relaxed with a conjugate gradient algorithm until the energy components on any ions were smaller than 0.25 kcal/mol. Additionally, DFT computation was performed to calculate the energy of a monomer PU and slab HNT separately with a similar set up. The energy for a single polyurethane chain is EPU = −4188.717 kcal/mol and energy for the flat surface of Halloysite is EHNT = −50,656.40 kcal/mol. The result of interaction energy is presented in Figure 4.

Interaction energy versus position of PU chain: (a) before and (b) after the fitting process.
The interaction energy calculations (MM approach)
For MM calculations, the same supercell was used (described in Figure 3). Then a minimizing process with 10−4 kcal/mol discrepancy was applied to the interaction between HNT/PU. The total energy between the PU and the HNT was calculated by the last two terms of equation (1):

Where Etot-MM refers to the total energy of the structure (HNT and PU). EHNT indicates energy of HNT, EPU refers to energy of the polyurethane, and
In the classical molecular dynamic method, the non-bonded energy between the HNT and the PU is calculated with the 9-6 Lennard-Jones potential and Coulomb part as described in equation (4);

Where
In order to compute EInteractMM and eliminate local interaction, we build an isolated optimized polyurethane chain (C17N3O3H18) cell. Then, conjugate gradient minimization was performed at zero temperature to calculate the energy of PU. This process was repeated for the isolated slab HNT as a supercell with a 3 × 3 × 1 repeated unit cell. After the equilibration process, energy for a single polyurethane chain is EPU = 4699.8 kcal/mol and energy for the flat surface of Halloysite is EHNT = 30,471.5 kcal/mol.
The fitting process (PSO approach)
The goal of this section is to minimize the discrepancy between equations (2) and (3) as defined in the following equation (5):

The index i refers to unique set of atomic coordinates in the training set.
In order to solve the least-squares problem described in equation (5), we exploring optimum value of Lennard-Jones parameters of interaction pairs between HNT and PU, those optimum parameters minimize the difference between the DFT and molecular mechanic potential of all trajectories, for this purpose, the Particle Swarm Optimization (PSO) technique was used. 48
Kennedy and Eberhart 48 were the first to introduce the particle swarm optimization (PSO) algorithm. It is inspired by the swarm behavior of birds. The PSO algorithm is a metaheuristic algorithm that is appropriate to optimize nonlinear continuous functions. 48 During standard PSO, the new position of each particle is determined by a velocity function which is updated at each iteration. 49
The purpose of an optimization problem is to discover a variable described by a vector Y = [Y1Y2Y3…Yn] which minimizes or maximizes depending on the purposed optimization target of the function f(Y).
49
The parameter vector Y is identified as the position vector of particle and n designates the number of parameters that defined as a problem. In our case, the function f(Y) is a fitness function or goal function, which is represented to minimize interaction energy as described in equation (5) and n represent to Lennard Jones coefficient of interaction atom types that have to be optimized. A MATLAB
50
implementation of the PSO algorithm was used to obtain Energy-fitting as described in equation (5). During iteration, we assigned initial parameters as the table from PCFF-IFF
15
for the molecular mechanic potential, then interaction energy of MM arrangement was computed and compared with interaction energy of the same DFT arrangement. The coefficients
Results and discussion
Table 1 presented previous experimental and DFT calculations results of lattice parameters of the unit cell of Halloysite with the current geometry optimization
Discrepancies are due to the pseudopotential, cut-off energy, and k-point mesh density in the different algorithms.
Table 2 describes the best-fit interaction energy between HNT/PU computed by DFT and MM approach. Figure 4 shows the fitting process results. In our case we chose a constant value of 2 for both the so-called “social learning Coefficient” and the “best Individual learning coefficient” of PSO. The number of PSO iteration was 150.
Improved pair coefficients for classical simulations.

Non-bonded energy terms were calculated using Eij = qiqj/r + εij[2(σij/r) 9 − 3(σij/r) 6 ]. Where Eij is the non-bonded energy between atoms i and j, r is the distance between these atoms, qi is the charge on atom i and likewise for atom j. As shown in Figure 4, the modified parameters of Lennard-Jones are in good agreement between the MM calculation and corresponding DFT calculation with an accuracy of less than (5 kcal mol−1). During the PSO iteration, the conjugate gradient minimization 51 was performed at zero temperature to calculate the energy of systems in MM. This process was continued until the subsequent difference of energy between steps was less than 10−4 kcal/mol. Similarity during the DFT, the conjugate gradient minimization 51 was performed at zero temperature to calculate the energy of systems in each increment of movement. This process was continued until the subsequent difference in energy between steps was less than 0.25 kcal/mol.
Pull-Out Simulation
In nano-composites, the load transfer from the matrix to the nanoparticle occurs in the interface between matrix and nanoparticle. This depends on the cohesion strength between nanocomposite components. The interfacial interaction energy can determine the cohesion strength between matrix and nanoparticle. In the case of non-functionalized HNT–PU composites, the interfacial interaction energy is generated from van der Waals forces and Electrostatic forces.
MD was performed to simulate the pull-out of a single HNT from the PU matrix to determine the interface interaction energy for an HNT-PU nanocomposite. In this simulation, the PU was arranged in a random distribution around the HNT axis. The model applied in this section has a total of 102,095 atoms; The computational region was embedding inside a periodic structure. Periodic boundary conditions (PBC) were applied in all directions. The approach of Haghighatpanah et al. was adopted for the pull-out simulation, the method included the following steps 52 :
Step 1: First, geometry optimization (GO) was conducted. GO was using the conjugate gradient 51 method and it was continued until the subsequent difference energy steps are less than 10−4 kcal/mol.
Step 2: The system obtained from Step 1 was equilibrated with an NpT ensemble at 1 atm pressure and 300 K for 100 ps. The HNT was constrained during the equilibration. The relaxation process was conducted to eliminate residual stress. 53 The equilibrium step was continued until the average total energy and density reach a constant value.
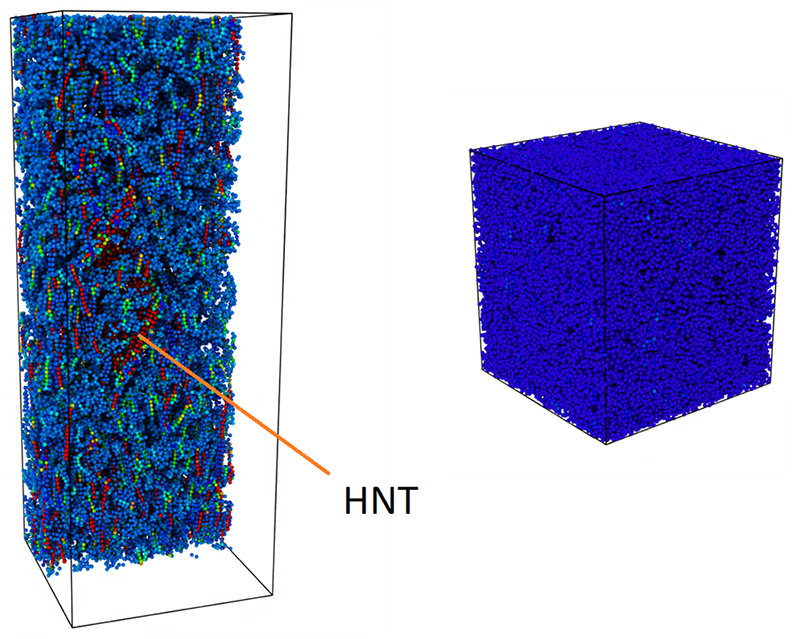
Step 3: After the equilibrium stage, the model was subjected to the pullout simulation. First, the PBC was extended along the HNT axis, then HNT was pulled out from the PU matrix along the HNT axial direction. The left end of the PU matrix was fixed as displayed in Figure 5(a). The HNT was pulled out of PU by a 0.005 Å displacement increment. During this process, we adopted the PPPM summation method 54 with the Lennard-Jones cutoff radius 18 Å. Process was applied to the nanocomposite under an NVE ensemble at 300 K temperature for 1.3 × 10⁵ steps. Also, the time step was 1.0 fs and a total of 5 × 10⁵ time steps were used. Figure 5 illustrates pull out simulation. The average interaction potential energy from the two systems is displayed in Figure 6.

Pull-out of the HNT from the PU matrix: (a) fully embedded, (b) at 60 Å displacement of the HNT, (c) fully extracted HNT from PU, and (d) cross-cut of fully extracted HNT.
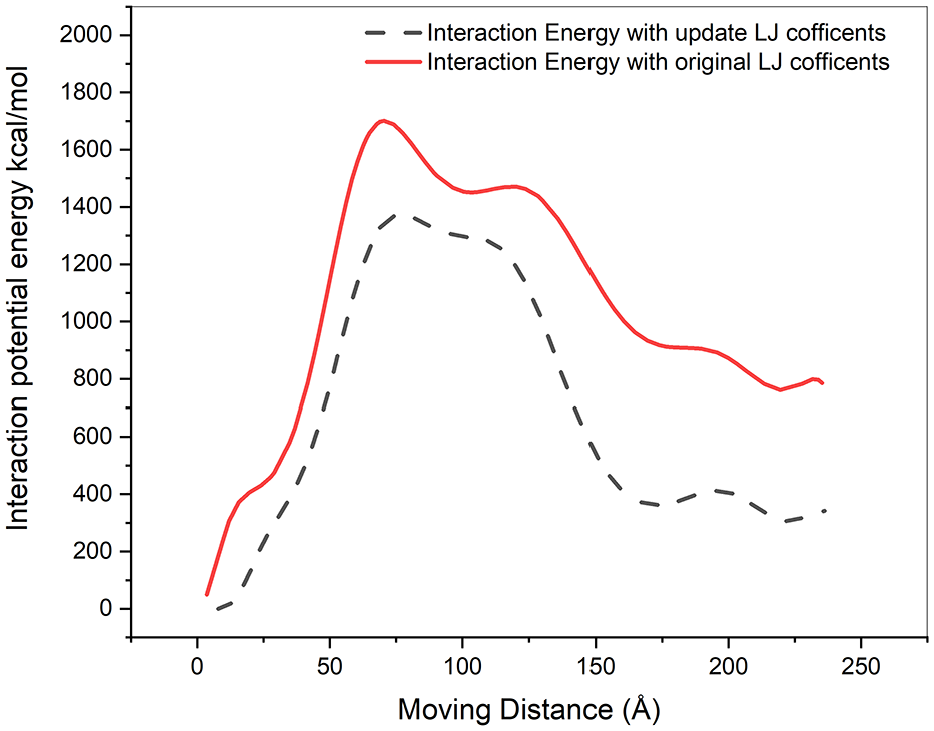
Interaction potential energy for HNT/PU during the pull-out test.
Gou et al. 55 express the variational extraction energy as a function of the traveling distance of nanotube within the polymer. Figure 6 illustrates the variation of the interfacial energy of HNT–PU structure as a function of the extraction displacement of HNT. When the HNT is extracted from the polymer matrix, the interaction potential energy is increased which is directly related to the interfacial interaction. The interaction energy is increasing due to developing new interface areas.
Figure 6 depicts the interaction potential energy of HNT–PU composite for the different increments of the HNT movement during the pulling out simulation. Once, the HNT is traveling out from the matrix, the potential energy reaches to the summit and with continued pulling out, the interaction energy of HNT with the matrix decreased in both simulations.
Model validation: Comparisons with the experimental result
We analyze the strain-stress of PU/HNT with 1 wt% of HNT by MD simulations and compare to an experimental sample. The amorphous models in this section were created with 1450 chains of PU. The system has 174,801 atoms. LAMMPS was used for all the MD simulations. 56 The updated potential is applied in this simulation. Following, 53 an equilibrium process was applied to the nanocomposite under an NPT ensemble at zero pressure and 500 K for 5 × 10⁶ steps. This step allows the grafted chains to move in the periodic cell. During this process, we adopted the PPPM summation method 54 with the Lennard-Jones cutoff radius 18 Å. Also, the time step was 0.1 fs, and PBC was implemented along with all directions. The final density of the system was 0.93826 g/cm−3.
After preparation, the PU/HNT structure is deformed by changing the cell length with constant speed (strain rate is 0.001 s−1) in the z-direction while the box length in the other two directions was fixed (as displayed in Figure 7). During this process, we adopted the PPPM summation method 54 with the Lennard-Jones cutoff radius 18 Å. Also, the time step was 1.0 fs, and the total number of time steps was 1.5 × 10⁵. The resulting of the stress-strain curve is depicted in Figure 8.
The molecular dynamics models of PU/HNT composite under the stretching test.

Stress-strain diagram for MD and experimental PU/HNTs samples.
An experimental sample was prepared to conduct a uniaxial test. The experimental sample of PU was functionalized with an amino silane and the sample was mixed by loading HNT with PU at 0·8 wt%. HNT was supplied by Sigma-Aldrich Canada Co. The chemical composition was H4Al2O9Si2· 2H2O and the Molecular weight was 294.19 g/mol. Then a tensile test was conducted to measures stress versus relative elongation of the sample. Dusing the tensile test the specimens of HNT-PU was conducted with clamp pressure 400 psi, and the samples were stretched at 8.3 mm/s. Figure 8 depicts a comparison between MD simulations and experimental.
As displayed in the stress-strain result in Figure 8, there is the same agreement between MD results with the experimental result. However, the discrepancies between MD simulation and experimental are associated with accurate simulation of interatomic interaction, thus, this study was an attempt to eliminate them by PSO.
Conclusions
The development of an interatomic forcefield is a substantial subject for any molecular simulation to evaluate the dynamic response of molecular systems. The PCFF-IFF force field presents a set of interatomic potentials that enable study of polymeric materials. In this work, a new technique was developed for generating new interatomic coefficients for HNT-PU that can be simply obtainable from DFT-MM trajectories, by applying the particle swarm optimization (PSO) algorithm to fit MM calculation to the desirable DFT calculation. As a result, the optimal values of Lennard-Jones parameters were derived. This is a notable development for assembling standard force fields and DFT calculations. The new Lennard-Jones parameters present good agreement between MD stress-strain responses with the corresponding experimental result.
Finally, we studied the effect of changing the interatomic bonding between the HNT and PU composites on the strength of the composite. It is clear that weakening the HNT/PU bonding (to better match DFT results) leads to a reduction in composite strength, but we note that this effect is only a small contribution to the overall strength of the material.
The framework of this study, which considers an atomistic arrangement of HNT–PU interface to be described by a simple geometry of the HNT–PU, is extendible to various material arrangements especially design new composites reinforced by HNT.
Footnotes
Acknowledgements
We are indebted to our collaborators, friends, and colleagues for their many invaluable discussions, comments, and suggestions. In particular, we want to explicitly thank Rafaela Aguiar for preparing the experimental sample test. We are also grateful for the financial support by the NSERC Discovery Grant program, and Compute Canada for providing computing resources for this research.
Handling Editor: James Baldwin
Declaration of conflicting interests
The author(s) declared no potential conflicts of interest with respect to the research, authorship, and/or publication of this article.
Funding
The author(s) received no financial support for the research, authorship, and/or publication of this article.
Supplemental material
Supplemental material for this article is available online.
References
Supplementary Material
Please find the following supplemental material available below.
For Open Access articles published under a Creative Commons License, all supplemental material carries the same license as the article it is associated with.
For non-Open Access articles published, all supplemental material carries a non-exclusive license, and permission requests for re-use of supplemental material or any part of supplemental material shall be sent directly to the copyright owner as specified in the copyright notice associated with the article.