
Abstract
Gearboxes are massively utilized in nowadays industries due to their huge importance in power transmission; hence, their defects can heavily affect the machines performance. Therefore, many researchers are working on gearboxes fault detection and classification. However, most of the works are carried out under constant speed conditions, while gears usually operate under varying speed and torque conditions, making the task more challenging. In this paper, we propose a new method for gearboxes condition monitoring that is efficiently able to reveal the fault from the vibration signatures under varying operating condition. First, the vibration signal is processed with the Maximal Overlap Discrete Wavelet Packet Transform (MODWPT) to extract the AM-FM modes. Next, time domain features are calculated from each mode. Then the features set are reduced using the Ant colony optimization algorithm (ACO) by removing the redundant and unimportant parameters that may mislead the classification. Finally, an ensemble learning algorithm Random Forest (RF) is used to train a model able to classify the fault based on the selected features. The innovative aspect about this method is that, unlike other existing methods, ACO is able to optimize not only the features but also the parameters of the classifier in order to obtain the highest classification accuracy. The proposed method was tested on varying operating condition real dataset consisting of six different gearboxes. In the aim to prove the performance of our method, it had been compared to other conventional methods. The obtained results indicate its robustness, and its accuracy stability to handle the varying operating condition issue in gearboxes fault detection and classification with high efficiency.
Keywords
Introduction
Gearboxes defects and degradation have a huge impact on the efficiency of rotating machines. These faults can be generated from various factors such as improper assembly, poor lubrication, corrosion, and overload 1 and they can lead to substantial economic losses and serious risks and dangers on the working staff.
For this reason, gears fault diagnosis has always been a research subject where many techniques and approaches were proposed to address this issue in order to increase the efficiency and reliability of the addressed system.
It has been noticed that vibration signal has a wide utilization and shows dominance over temperature, current and acoustic emissions for fault diagnosis. 2 This is due to the simplicity of its acquisition and the importance of the information it provides concerning the source and the gravity of the fault. 3
Once the fault occurs, impulses periodically appear in the vibration signal whenever the damaged part of gear comes in contact, this repetition is known as Fault Characteristic frequency (FCF).
In gear fault detection, FCF extraction is applied based on many signal processing techniques, for example in Yang et al., 4 Yang and Chen 1 propose a precise gearboxes diagnosis method based on multi-feature and BP-AdaBoost, used Radial Basis Particle Filter as an extracted signal denoising technique, to pretreat it for further diagnostic classification, 5 introduced an effective fault component separation method that integrates ensemble empirical mode decomposition (EEMD; an adaptive signal decomposition method in time-frequency domain) with independent component analysis (ICA; a blind source separation technique).
The efficiency of the previous techniques in fault detection is proved at constant speed and torque, but gears generally operate in severe environments under non-stationary working conditions, therefore the FCF changes, which makes the applicability of such methods impossible and non-accurate.
In recent years, more studies were founded to diagnose gears in different variable operating condition to approach the real particle case.
Many research groups exploit a phase reference signal obtained from an encoder or a tachometer to remove speed variation effect. 6 Hun et al. 7 introduced a deep belief network (DBN) algorithm for gear fault diagnosis based on wavelet packet energy entropy (WPEE) and multi-scale permutation entropy (MPE). Zheng et al. 8 worked on the extraction of gearbox fault feature of wind turbine under variable speed condition using improved adaptive variational mode decomposition (VMD). In the research work published by Gougam et al. 9 the decomposition of the initial signal into different modes is done using EWT. Then the most significant modes are selected to reconstruct a new signal relying on Kurtosis. In the next step, time domain features are extracted; and the Fuzzy Logic System (FLS) is utilized for the classification of bearings faults. This technique showed a high performance in fault classification. However, for EWT decomposition, an inappropriate selection of the modes number may lead to disagreeable decomposition results. Moreover, the linearity of the wavelet filtering bandwidth makes it non-adaptive for all the cases. 10 Furthermore, many condition monitoring and fault diagnosis works preferred DWT as a signal decomposition tool,11,12 where the analyzed data is decomposed with a band-pass filter in time and frequency domains into a collection of signals with a particular frequency band. 13 Unfortunately, the dyadic step in the down-sampling process seems to be the main limit of DWT. This issue is addressed using the Maximal overlap discrete wavelet transform (MODWT) as an optimized version of DWT to overcome the down-sampling process.14,15 Yet, same as DWT, this technique still endures the poor frequency resolution. A better resolution is ensured using Maximal overlap discrete wavelet packet transform (MODWPT). In this method, the decomposition of the complicated signal into several single components and the property of circular shift equivariance are insured for gears condition monitoring in various working condition. 16 Uniform frequency bandwidths are provided using MODWPT, this helps to overcome the time-variant transformation and also allows the reconstruction of the original signal and maintain the necessary information.
Nevertheless, for the purpose of reducing the number of FLS entries, numerous potentially important pieces of information are obscured if they belong to the excluded modes. To overcome this matter, optimization is considered instead of eliminating entire modes based directly on a single parameter. In some studies, optimization is found to be used as a main step in condition monitoring considering the improvement it imports to the classification performance.
In this paper, a new method is proposed to diagnose and monitor gears in various operating conditions. The innovative aspect about this method is that, unlike other existing methods, ACO is able to optimize not only the features but also the parameters of the classifier in order to obtain the highest classification accuracy.
The flowchart of the proposed method is shown in Figure 1. It begins with processing the vibration signal using MODWPT to extract the different AM-FM modes. Then time domain features are extracted from those modes. After that, the optimization of the features set is done by eliminating the unimportant parameters by Ant colony Algorithm. Finally a model is trained to detect the fault by the supervised learning method “random forest.” This work is done on vibration data and it shows a high performance.

Flowchart of proposed method.
Experimental description
In this section, a speed reducer with a gear ratio of 25/56 is considered as a test bench (Figure 2). A nominal speed of 3600 r/min electric dc motor is considered as a source of motion between the two shafts and different resistive torques are generated by a magnetic power brake that is coupled to the output shaft.17,18

The gearbox test bed.
The efficiency of the suggested method is tested using six pinions with different health states. The first one is a faultless pinion, and it is referred as good (G), while the rest have various types of defects, such as a tooth root crack (TRC), a chipped tooth in length (CTL), a chipped tooth in width (CTW), a missing tooth (MT), and general surface wear (GSW) (Figure 3).17,18

Six pinion states: good (a), tooth root crack (b), chipped tooth in length (c), chipped tooth in width (d), MT (e), and GSW (f).
Three pinions are installed simultaneously, on the input shaft of the gearbox. With a simple axial movement of the wheel of the output shaft, the engagement of each of them is achieved (Figure 4). Two accelerometers (sensitivity: see Table 1 above 100 mV/g) are radially installed to record vibration signals, in horizontal and vertical positions on the bearing case of the output shaft. The accelerometer channels time sampling frequency is equal to 125 kHz, the sampling frequency of the anti-aliasing filter is 27 kHz, and the acquisition duration is equal to 30 s.

Single stage gear pinions location in the gearbox.
Geometrical parameters of the gear system.

The accelerometer signals have been collected for several operating conditions under different loads and different rotation speeds (see Table 2). Figure 5 shows the acceleration vibration signals recorded from pinions with different gear state for an operating speed equal to 900 r/min with 11-Nm load. From Figure 5, it can be clearly see that the five different defects do not show a significant signature in the vibration signal. No significant increase in the energy of the temporal signal is noticed.
Operating conditions.


Pinion vibration signals of gearbox with different faults (speed: 900 r/min, load: 11): G (a), TRC (b), CTL (c), CTW(d), MT (e), and GSW (f).
Signal pre-processing and feature extraction
Maximal overlap discrete wavelet packet transform
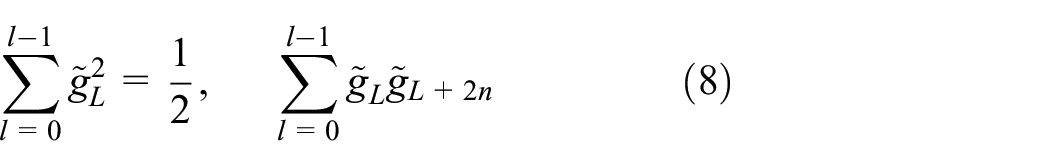
Let X = [X0, X1,…,XN−1] be a column vector of sampled sequences of a continuous-time data x, and N is a power of 2. The even-length scaling (low-pass) filter {g1:1 = 0,…L − 1} and the wavelet (high-pass) filter {h1:1 = 0,…L − 1} are used to obtain the DWT of the sampled vector.14,15 These even-length filters satisfy the following equation:

The two filters are related for being quadrature mirror of all nonzero integers n as in:

Or

The jth level wavelet and scaling coefficients for
t = 0,…, N−1 are given by:


where MOD stands for the modulus after division.
MODWT is an enhanced version of the DWT. Differently from DWT, MODWT is well defined for any sample size Nat every level j.
Energy conservation is ensured by scaling the defining filters as in:


Thus, equation (1) becomes
The expression of the quadrature mirror filters becomes as follows:


To avoid the down-sampling problem, MODWT uses new filters by insuring 2j−1−1 zeros between the elements of
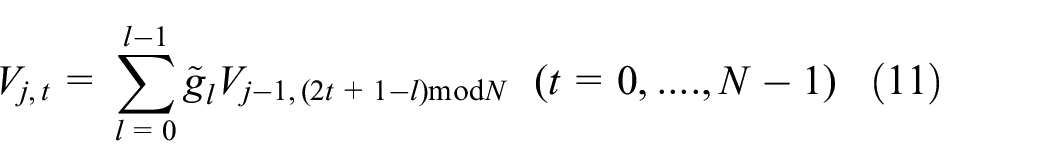

MODWPT is a further developed method adopted to ensure a perfect resolution at high frequencies, and Wj,n = {Wj,n,t,,t = 0,…,N−1} is the sequence of MODWPT coefficients at level j and frequency-index n. {Wj,n,t}, is produced using the following equation:


Where
Time domain features
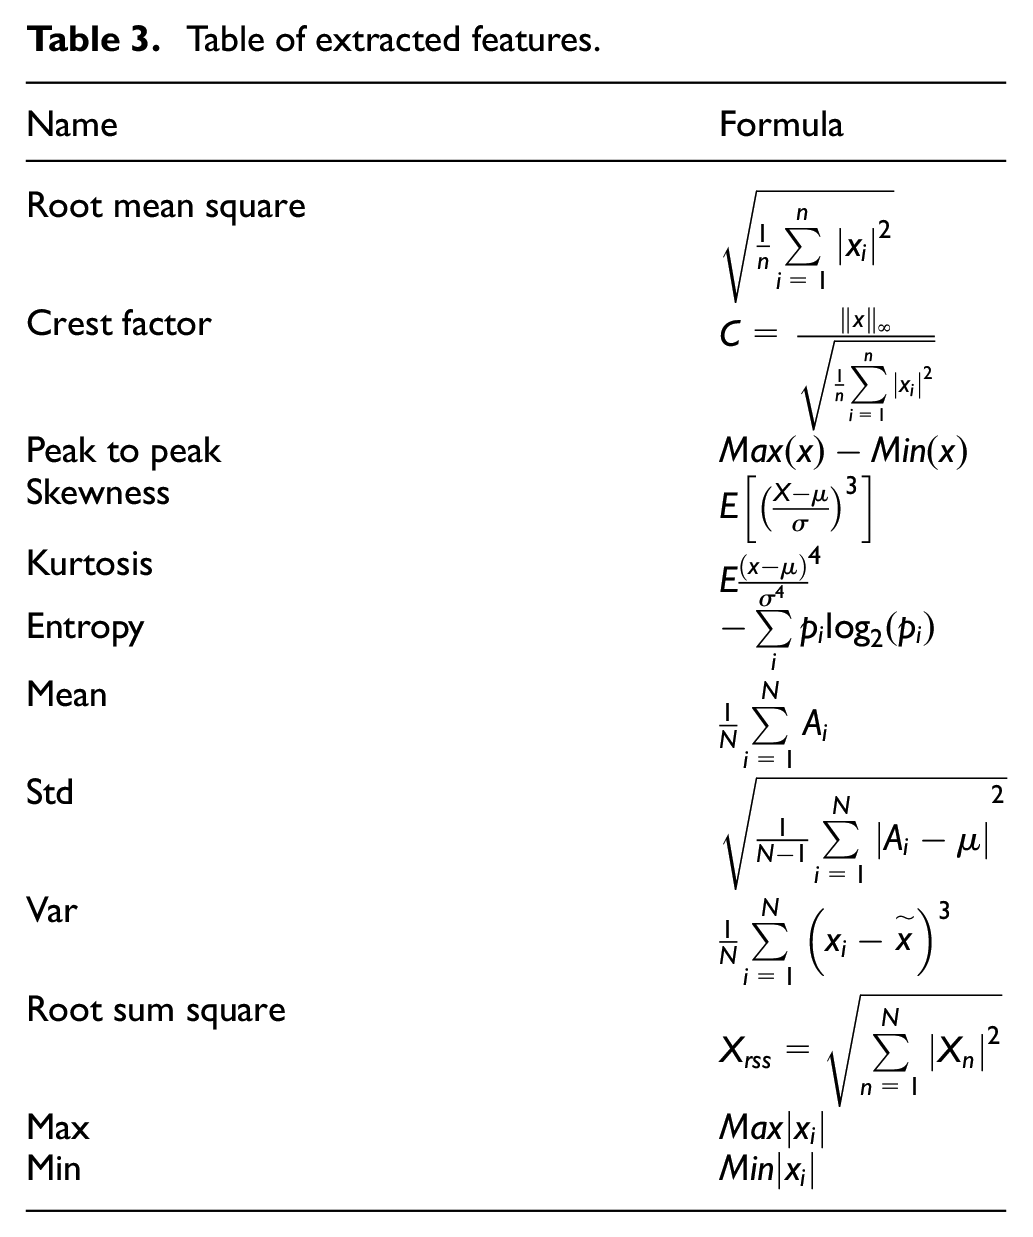
In this study, after the acquisition of vibration signals from the test gear, the signal was decomposed to sixteen modes using MODWPT. For each mode, twelve statistical features from the time domain are extracted as fault signatures. Hence, a total of 192 features are extracted. These features mathematical formulas are listed in Table 3.
Table of extracted features.
Features selection and classification
Many irrelevant or redundant attributes can be found in the extracted feature dataset. A satisfying precision for gear faults prediction or classification can be ensured using feature-selection process by removing irrelevant, redundant, or noisy features and selecting those that contains maximum useful information. Additionally, this leads to improved learning accuracy and fault classification process. 19
In this article, the proposed method is based on the use of the ACO whose objective function is based on the RF classification algorithm.
Ant colony algorithm (ACO)
In the field of swarm intelligence, Ant colony is considered as a typical algorithm for optimization. The “swarm” is a group that can indirectly communicate by changing the local environment, and be able to solve the distribution problems in cooperation. We mean by “intelligence” an agent that shows intelligent behavior compared to the rest of the group through cooperation. The so-called “ants” is considered the basic unit of the swarm and hence algorithm. 20
In ant’s community, the used medium to communicate between individuals is pheromone. In the feeding process, and in order to mark the path, the moving ant lays some pheromone on the ground. The basic principle is that other ants will follow the laid trail already marked by a previously ant’s pheromone, the encountered trail will be then forced and increased by its own pheromone. The probability of choosing the same path increases according to the number of ants releasing their pheromones in it, the process can be expressed as a positive feedback loop based on the preceding steps. 21 When reaching the food source, ants follow the same route to their nest. After finishing their tasks, ants pheromones evaporate gradually over time, this is called pheromone evaporation mechanism. The illustration of the based positive feedback loop identification of the shortest path is shown in Figure 6. The stronger pheromone trail left by the preceding ants will be chosen as the shortest path compared to the other one and more ants will reinforce it as explained in Figure 6(b).

Basic explanation of the Ant colony algorithm (a), Before finding the shortest way (b), After finding the shortest way.
The mathematical description of ACO
ACO was firstly introduced by Dorigo et al. 22 in the early 1990s. It was considered a new nature-inspired metaheuristic method intended to solve TSP problems. The TSP problem can be described as the problem of finding a minimal length closed tour that visits each town once. ACO usage in TSP solution will be described in what follows.
Pheromone updates must be considered after each round: this includes the evaporated quantity per unit length and laid on the edge by the ant. Ants will ignore the poor path selected before thanks to pheromone evaporation mechanism. Thus, early local optimization will be avoided.
ρ is an evaporation coefficient. When the evaporation rate is set to 1, there is no pheromone evaporation, and not easy to get convergence. But setting ρ too low is prone to get a local best answer.
The intensity of pheromone on path-ij at time t + 1 is given by equation (15) 23 :

The transition probability for the k-th ant from town i to town j as equation (16) 21 :

The trail update pattern determines the three categories that the field of the ant system (AS) can be divided to: ant-cycle, ant-quantity, and ant-density algorithms, their formulas are given by equations (17) and (19). 23 The ant-cycle model shows that each ant lays its trail at the end of the tour, but the other two model sup-dated the trail after each step, which explains the wide use of the Ant-cycle algorithm and the elimination of the two other models.
Where
ANT-quantity:

ANT-density:

ANT-cycle:

In cluster analysis, the clustering center value equals to the average of objects belonging to the class. Numerous methods be used to calculate the distance between the sample and the clustering center, such as Euclidean distance, binary angle cosine law, cosine angle distance method. The Euclidean distance is chosen to be used in this paper. The physical meaning of Euclidean distance is expressed as m-dimensional real space distance of two points, which can be expressed as in equation (20).

Random Forest
Random Forest is considered as a type of integrated tree classifier.24,25
Figure 7 shows the Random Forest flow chart and its detailed algorithm is described as follows.

The flow chart of the Random Forest method.
RF is a popular supervised and ensemble learning method based on N decision tree constructed using bagging (boots trap aggregating) where each tree uses a random sample of the data and each node of the tree is split depending on the best variable in the input subset of features which is determined by Gini Index as an attribute selection measure 26 after calculating the impurity of attributes with respect to the classes by equation (21).

Where pi denote an element’s probability to be classified for a distinct class.
The following lines summarizes the RF steps. The RF takes into consideration the prediction of every decision tree then outputs the best result after voting. Figure 7 summarizes the RF algorithm.

Results and discussion
Our method was firstly tested with twenty features; the obtained results are represented in Figures 8 and 9. It can be clearly noticed in the Confusion matrix that the classification accuracy is 99.1667%.
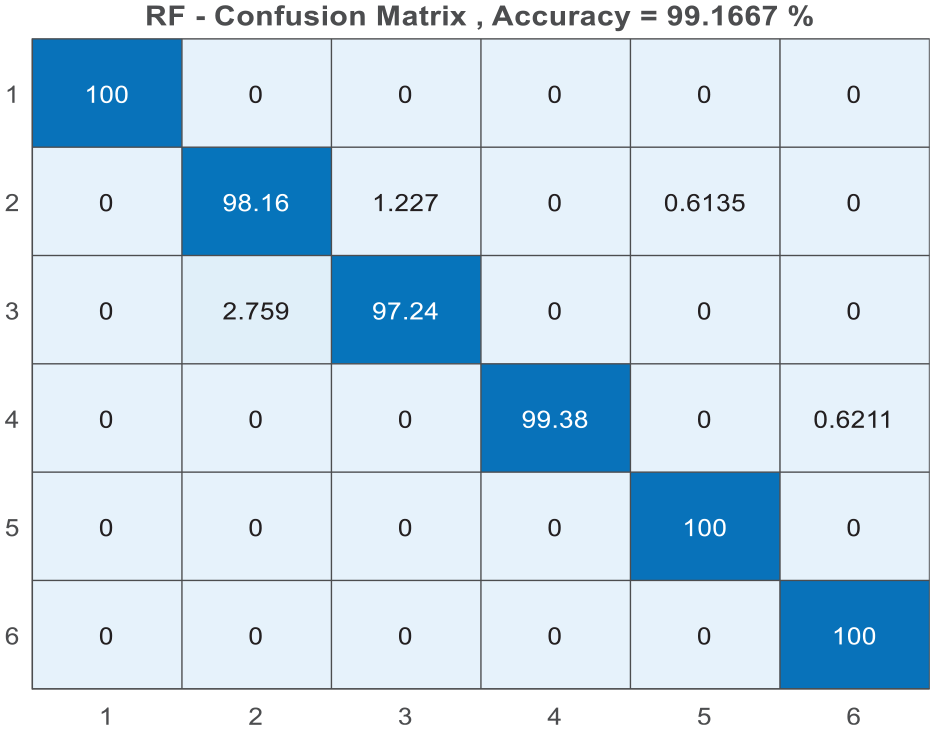
RF confusion matrix with 20 features.
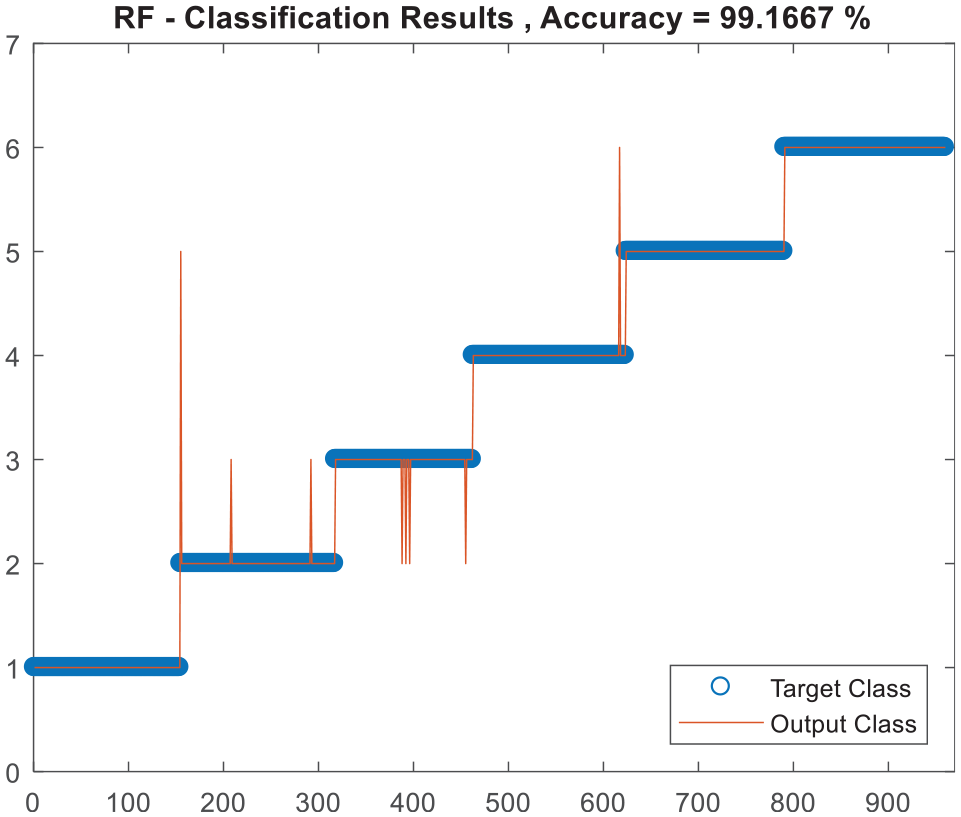
Plot of the classification results with 20 features.
Several tests were conducted with different numbers. The classification accuracy was saved in each test aiming to determine the optimal number of the selected features. Figure 10 represents the classification accuracy variation according to the number of features. It can be concluded that the best classification accuracy equals to 99.89 and it is obtained when the features number of is 15.

Accuracy classifications (RF) versus number of selected features.
In order to prove the efficiency of the proposed method, it was put in comparison with other techniques which are KNN, DT, and CNB. The number of features is fixed at 15 for all methods.
It worth mentioning that experiment in this paper is conducted under the condition of randomly select samples, where the average value of 15 experiments is taken, and the maximum and minimum values of classification accuracy are given. Furthermore, the standard deviation of classification accuracy is considered to analyze the stability of the classification method.
The MODWPT extracted features is the considered input for each classification method. The minimum number of father nodes of DT is 5. The nearest neighbor number of KNN is K = 5. The classification results are shown in Table 4.
Classification results of various methods.

KNN: k-nearest neighbor; DT: decision tree; RF: Random Forest.
From the confusion matrix figure, we can see that the CNB has the lowest classification accuracy; we can show clearly that the CNB presents misclassification in the entire category. This misclassification is 36.84% of the testing samples are misclassified for the fourth category and around 25%, 31%, and 25% of the testing samples for the third, the fourth, and the sixth category respectively, see Figures 11 and 12 above.

Confusion matrixes with 15 features.
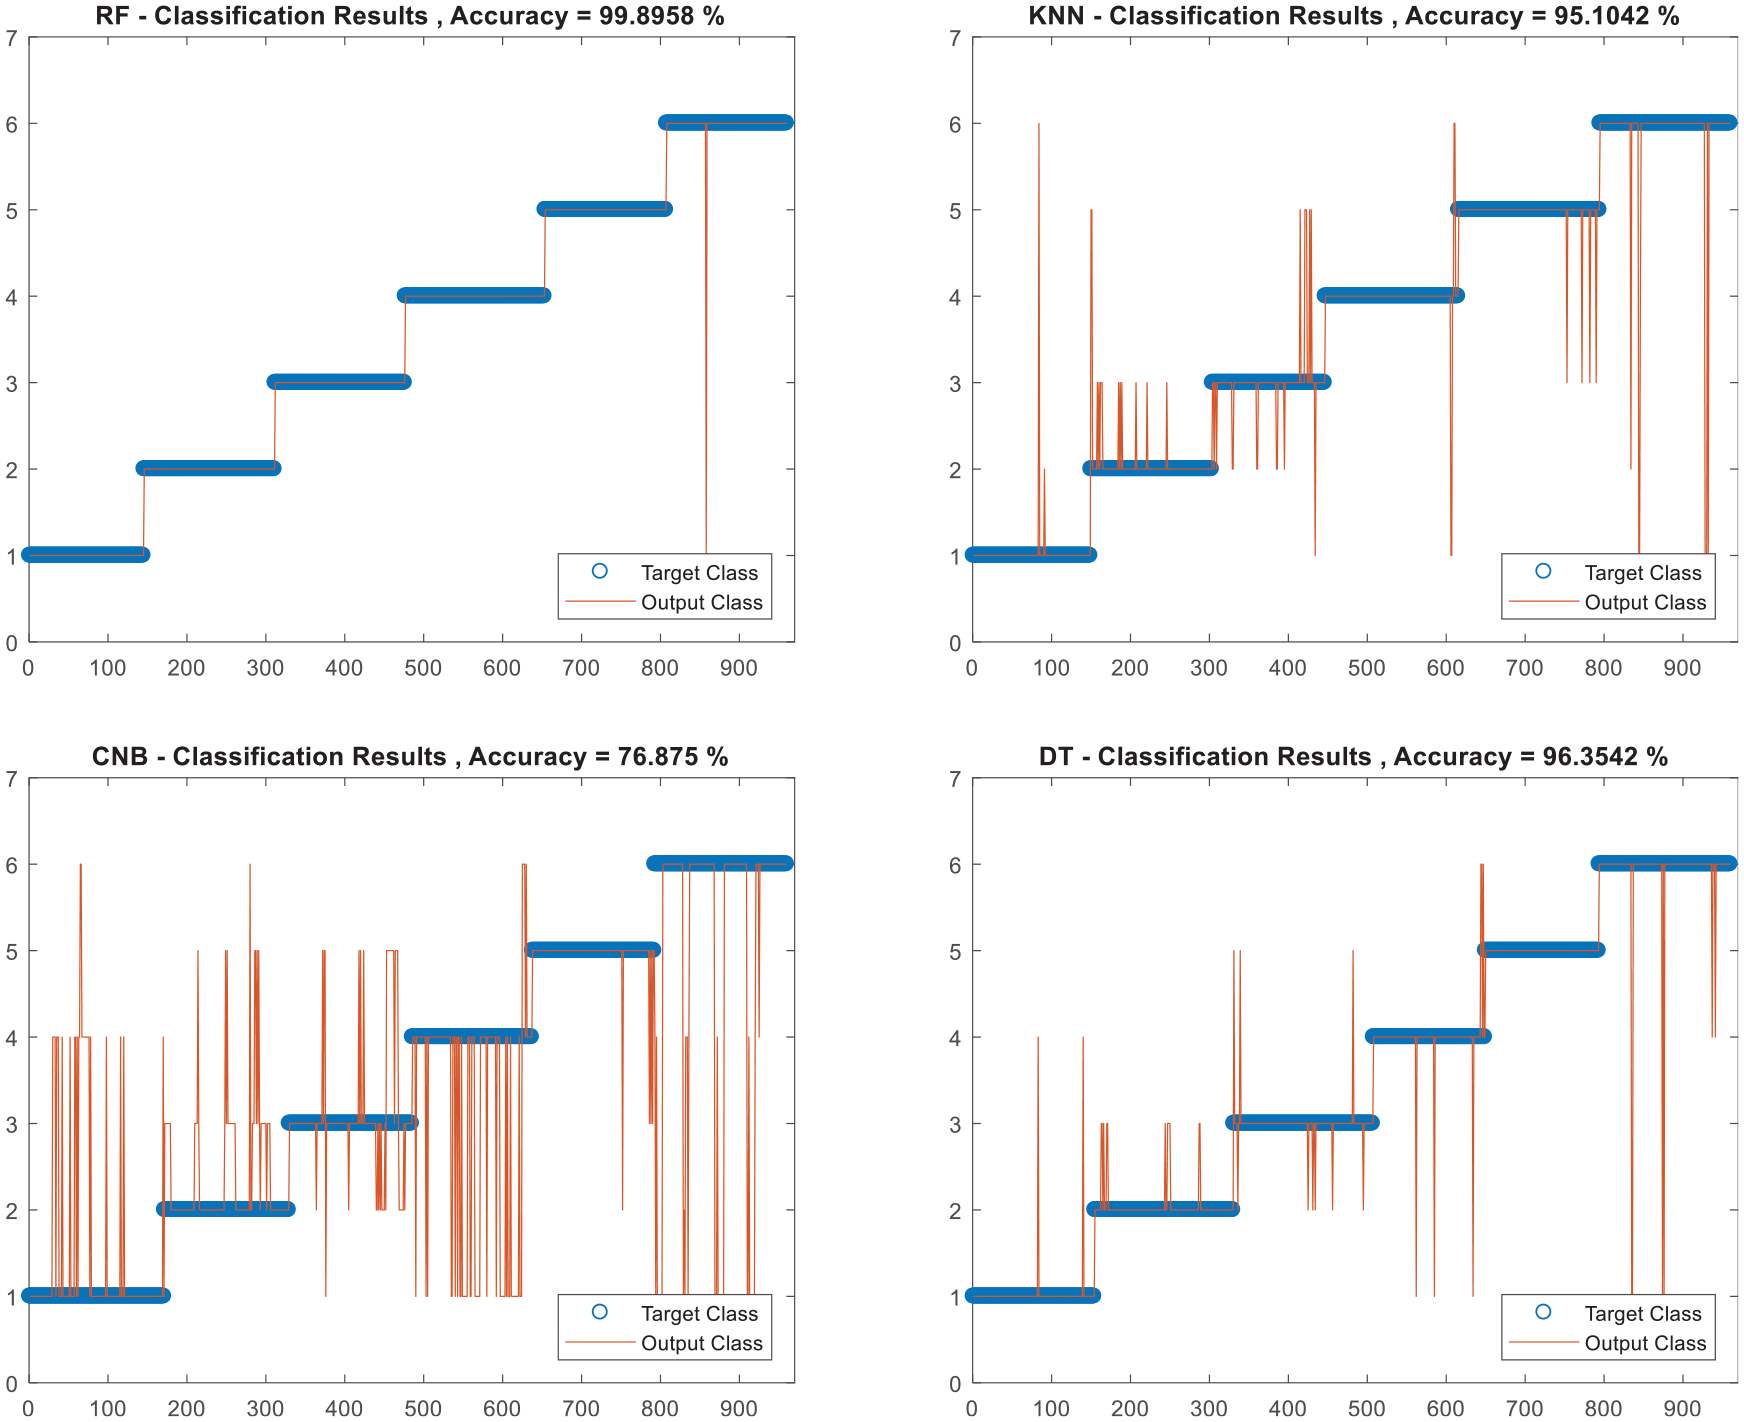
Classification result with 15 features.
KNN classification results indicate that 28 samples are misclassified, with an overall classification accuracy of 95%.
in the classification results using DT, 20% of testing samples are misclassified, among which 6.81% of category 2 are classified as category 3, 3.39% of category 3 are classified as category 2, 1.69% of category 3 are classified as category 5, 2.113% of category 4 are classified as category 1, 6, 2.39% of category 6 are classified as category 1, and 1.19% of category 6 are classified as category 4.
RF results classification accuracy is 99.89% with only one misclassified samples.
Figure 13 represents the variation of the accuracy according to the number of features for different classifier that is KNN, DT, CNB, and RF. By comparing RF with other classifiers, we can see that RF always gives the best accuracy regardless of the number of features.

Classification accuracy variation according to the selected number of features.
Conclusion
Rotating machines fault diagnosis is becoming increasingly important through time because of the fast development of industries. This is to help operators in troubleshooting by identifying and localizing the underlying problems. Especially that any delay or a misdiagnosis can put the human safety, the machine’s state and the industry’s economy is a real danger. In spite of the great interest this field has gained, only a little focus was devoted for machines diagnosing under variable operating condition which represents the practical case in most industries. In this paper, a new gearbox fault diagnosis method based on MODWPT-ANT and RF classifier is proposed to diagnose various faults of gearbox under variable operating condition. The effectiveness of the proposed method is validated by recognizing six fault types of gearbox. Compared with other existing classification methods, the obtained experimental results using RF classifier indicate that the proposed method provides an alternative way for gearbox health monitoring.
Under the premise of the same input, the RF classifier is always higher than that of DT, and the classification effect is better. By comparing with CNB and KNN, the proposed method has higher classification accuracy and can be better used for gearbox fault diagnosis, and the classification accuracy reaches 99.89%.
Footnotes
Handling Editor: James Baldwin
Declaration of conflicting interests
The author(s) declared no potential conflicts of interest with respect to the research, authorship, and/or publication of this article.
Funding
The author(s) received no financial support for the research, authorship, and/or publication of this article.