
Abstract
To study the effect of sediment on the cavitation in the axial-flow pump, the method of CFD is employed to experiment on the internal flow field of the pump in the case of cavitation in clean water and sandy water separately. The calculation is done with different particle sizes and sediment concentrations. The results show that as the sediment concentration increases, the vortex range and cavitation area of the blade will further increase, and the flow pattern in the impeller becomes more disordered. The mechanism of action of particle size on cavitation is similar to that of sediment concentration. However, cavitation in clean water is quite different from that in sandy water in that the cavitation value and range in sandy water are significantly larger than that in clean water. By contrast, the particle size has little effect on the cavitation value and range. It proves that particle size does not have a great influence on cavitation distribution, but sediment concentration is the main factor affecting the cavitation performance of the pump. Moreover, sediment will disrupt the internal flow pattern of the pump, promote the development of cavitation and further reduce the cavitation performance of the pump.
Introduction
Natural fluid medium boasts of more sediment particles, especially when axial-flow pumps are used in drainage pumping stations and other projects. The medium in the front of the pumping station is filled with various kinds of particles such as branches and sediments. Although there are trash racks as barriers, the sediment particles will still enter the flow passage of the axial-flow pump, which will cause the wear of the hydraulic components and damage the performance of the pump. Especially when cavitation occurs in the pump, the hydraulic components of the axial-flow pump will be damaged by the joint action of cavitation and wear, resulting in a decrease in pump performance, a shortened service life, and a reduction in the economic benefits of the pumping station or power station. Even worse, the unit will undergo vibration and noise which can affect the operation stability of the pump.1–3 At this time, its cavitation characteristics are significantly different from those in clean water.
In view of the cavitation in sandy water, some scholars have conducted related researches. Through theoretical calculations and experimental studies, Chang4–7 found that water quality (sediment concentration, particle size) has a great influence on the cavitation performance of the pump unit. Madadnia and Owen8,9 found that the doubled corrosive effect of cavitation and abrasion in sandy waters far exceeds the single effects of cavitation or abrasion. Zhao et al.10,11 studied the cavitation of centrifugal pumps and nozzles, and found that under the joint action of sediment abrasion and cavitation, the lift in sandy water is lower than that in clear water medium. Huang12–16 worked on the effect of sediment concentration, particle size and hardness of solid particles on the extent of damage that cavitation can cause. Lin et al.17,18 used the SST k-ω turbulence model to simulate the flow characteristics of the axial flow pump in four states, analyzed the influence of sand content and critical cavitation on the flow characteristics of the pump, and explored the unstable operation area of the axial flow pump in different states. Shen et al. 19 studied the influence of different sediment concentration on cavitation characteristics in the rotating disk under the condition of 0.1 mm sediment diameter by numerical simulation of the rotating disk test device, and analyzed the pressure characteristics, sediment distribution, and cavitation volume fraction in the rotating disk. Yan et al. 20 studied the effect of tiny particles with different sizes and shapes on cavitation damage through rotating disk experiments. Wang and Chang 5 proposed a new method for calculating cavitation flow by revising the traditional cavitation theory and considering the influence of solid particles in the water.
In short, cavitation is exposed to mediums.21,22 Thus, analyzing the influence of sediment concentration and particle size on the cavitation characteristics of the axial-flow pump is of great research significance, which can serve as a preferable reference for restraining cavitation and erosion of the axial-flow pump.
Axial-flow pump computational model
Design parameters
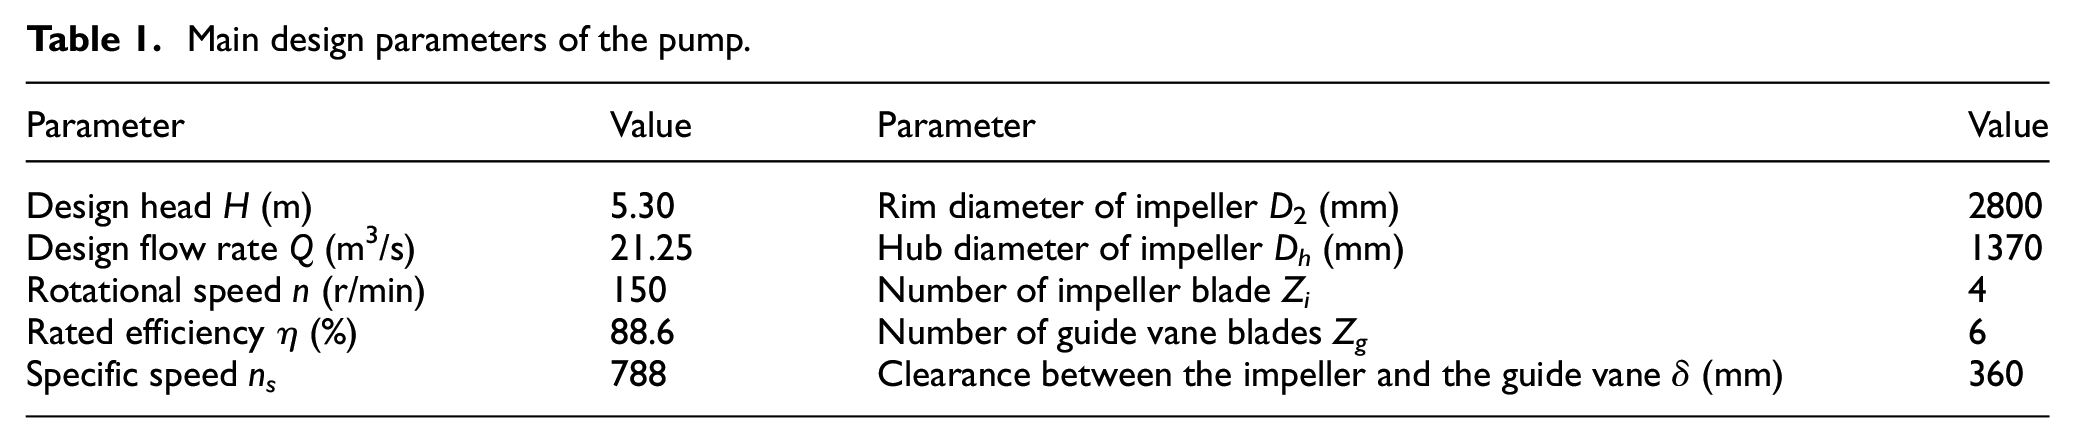
A large-scale drainage pump from a pumping station is selected as the research object, and its main parameters are shown in Table 1.
Main design parameters of the pump.
Pump calculation domain and griding
In the research, the inlet and outlet flow passages of the large-scale axial flow pump are simplified. Corresponding to the delivery experimental conditions of the pump section, the computational domain includes four parts: inlet flow passage, impeller flow passage, guide vane flow passage, and outlet flow passage.
The computational domain is shown in Figure 1(a), and the overall grid distribution is shown in Figure 1(b). The hexahedral structured grid is used to grid the pump model, and the grid independence verification is carried out. When the number of grids is about 7 million, the pump head is maintained near 5.34 m. As the number of grids continues to increase, the head change is less than 1%. Considering the computational economics, the option 2 in Table 2 is finally chosen and the total number of grids is intended to be 7.63 million.

Pump model and griding: (a) pump model, (b) model grid, (c) impeller grid, and (d) guide vane grid.
Meshing independence analysis.

Numerical calculation method
The ANSYS CFX fluid simulation software based on the finite volume method (CV-FEM) 23 is used for numerical calculation. The discrete equation is solved using the fully implicit coupled algebraic multi-grid method, and the calculation convergence accuracy is set to 10−5.24,25 The pressure inlet and mass flow outlet boundary conditions are adopt with outlet mass flow set to 21186.25 kg/s. Standard k-ε, RNG k-ε, SST k-ω, and Standard k-ω turbulence models are selected for numerical calculations, and the numerical simulation results are compared with the actual experimental results to find the most suitable turbulence model for numerical calculation of large axial flow pumps. Water of 25° centigrade and vapor are designated as the calculation medium.
Cavitation model and external characteristic verification
Cavitation model
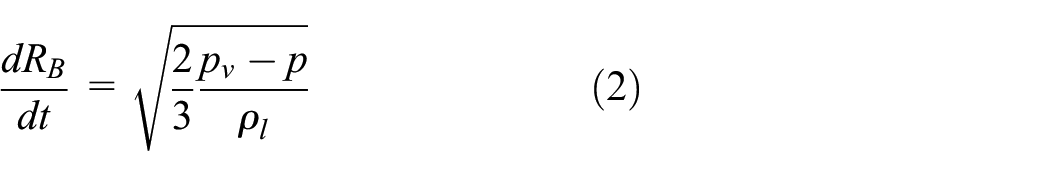
The cavitation calculation employs the ZGB cavitation model which is a widely used model derived from the R-P equation. 26 It is also known for its good compatibility and is suitable for numerical calculation of cavitation in sandy water with different sediment concentrations. The cavitation dynamic equation is derived from the Rayleigh-Plesset equation:

In the above equation, RB, T, and pv stand for cavitation radius, surface tension coefficient, and vaporization pressure, respectively. Irrespective of the second-order term and surface tension term, the above equation can be simplified to:
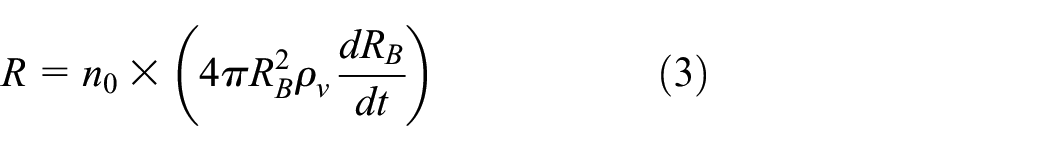
Zwart et al. 27 made use of the number of cavitation per unit volume no, and the equation of the total interphase mass transfer rate R is drawn up as:
The equation of the number of cavitation per unit volume no depends on the direction of the phase change. For the cavitation development (vaporization), n0 is expressed as:

For the cavitation collapse (condensation), n0 is expressed as:

The foregoing five equations are combined to derive the final formula of the cavitation model:

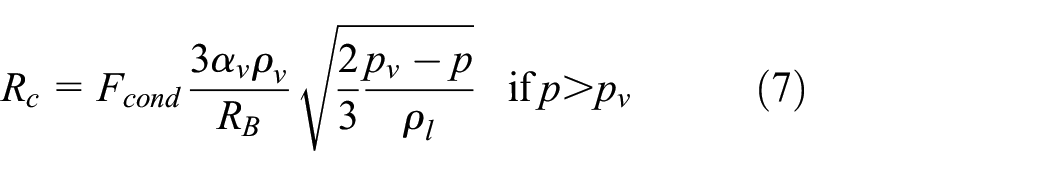
In the above equation, ρv, ρl, αv stand for the vapour density, the liquid density, the vapour volume fraction respectively, Fvap and Fcond are two empirical correction coefficients corresponding to the evaporation and condensation process. The model involves four parameters and default values are used here. These parameters refer to the cavitation radius (RB = 10−6 m), the nucleation site volume fraction (αruc = 5 × 10⁻⁴), and the evaporation coefficients (Fvap = 50) and condensation coefficients (Fcond = 0.01).Since the condensation process is usually much slower than the evaporation process, 28 Fvap and Fcond are not equal.
Verification of external characteristics
Figure 2 shows the comparison among the calculated values of the external characteristics when the axial flow pump pumps sandy water in which the particle size is 0.5 mm and the sediment concentration is 5% and clear water separately and the experimental value in clean water. The experimental data of the external characteristics of the pump is equivalent to the delivery experimental data of the pump section. According to the author’s previous researches, 29 after comparing and analyzing the calculation accuracy of Standard k-ε, RNG k-ε, SST k-ω, and Standard k-ω turbulence models, it is found that the SST k-ω turbulence model has the best applicability. When the axial flow pump transports sandy water, its head and efficiency decrease slightly; under the design conditions, compared with the calculated value in clean water, the pump head and efficiency decrease by 5.93% and 1.55% respectively after adding sediment into the pump flow passage. When the water flow is slow, the drop rate is greater than that under other working conditions. In this case, the head and efficiency drop by 6.68% and 3.34%, respectively.

Comparison of experimental performance and predictive performance.
Results and discussion
Dimensionless parameter definition
As shown in Figure 3(a), five different cross-sectional streamlines are selected from the surface of the impeller by refering to the dimensionless radius rb whose defining parameter is shown in Figure 3(b), which is defined as follows:


Schematic diagram of flow lines and dimensionless parameters of impeller section: (a) cylindrical section and (b) streamline.
In the above equation,
Influence of sediment on cavitation volume fraction inside the impeller
In this part, the variations of cavitation volume fraction in the impeller under design flow conditions is experimented when sediment concentration (Cm) is 0%, 2%, 5%, 8% respectively and sediment diameter (d) is 0.05, 0.25, and 0.5 mm respectively. The effect of sediment concentration and particle size on the development of axial-flow pump cavitation is studied as well.
Influence of sediment concentration on the cavitation volume fraction
Figures 4 to 6 display both the streamline and cavitation volume fraction distributions in the middle section of the impeller under different cavitation stage, primary cavitation, critical cavitation, and severe cavitation respectively.

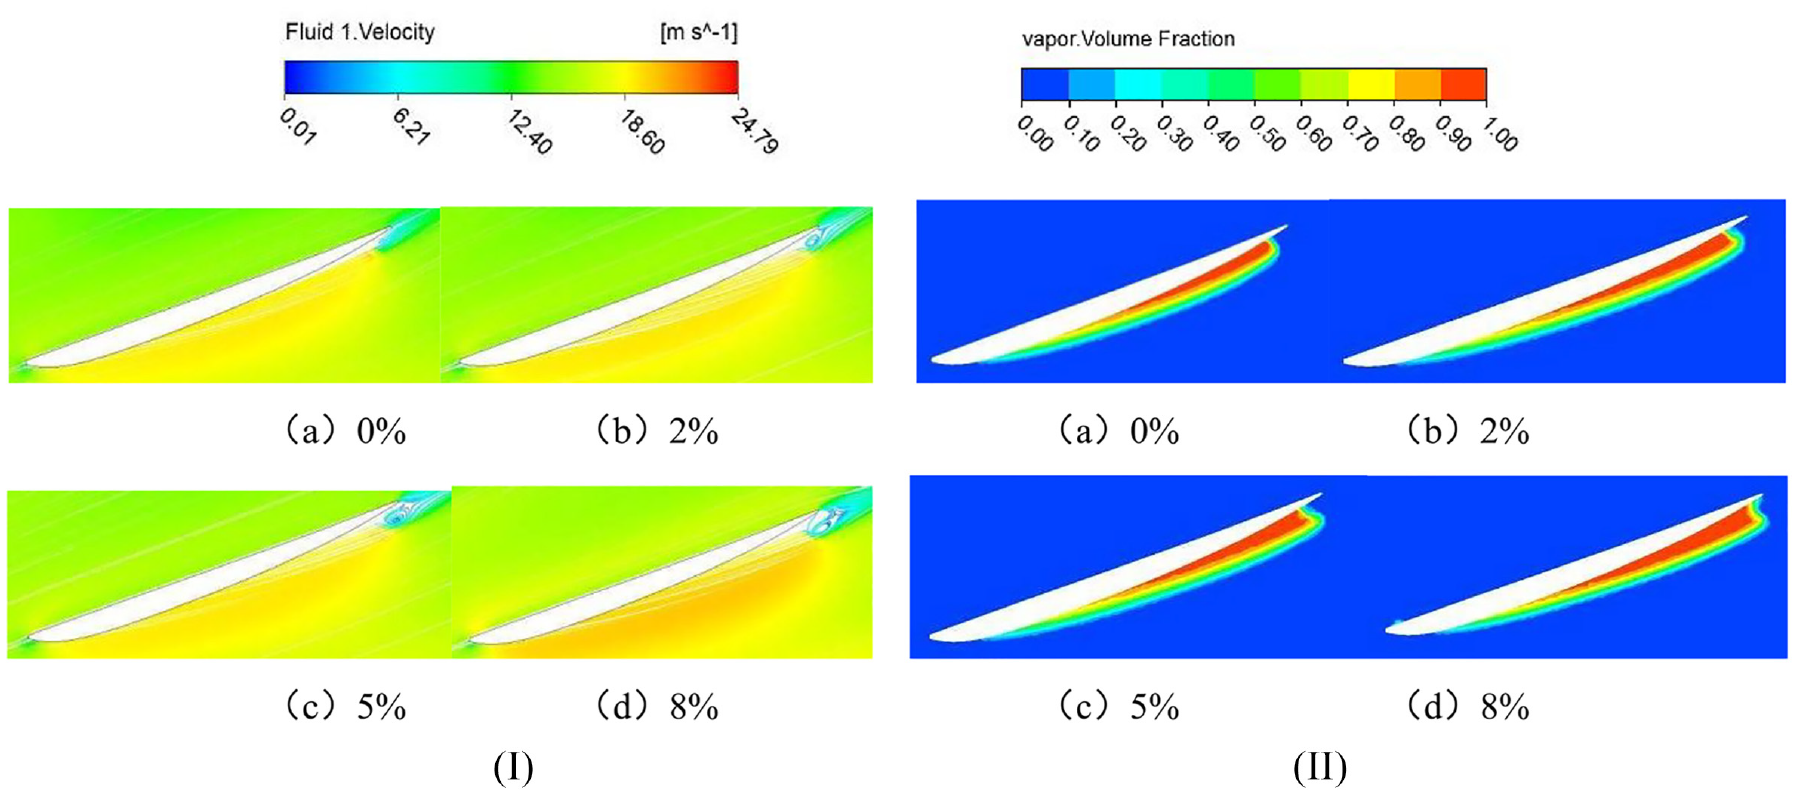
Streamline and cavitation volume fraction distribution of the blade under different Cm (Pin = 80 kPa): (I) streamline distribution and (II) cavitation volume fraction distribution.
Streamline and cavitation volume fraction distribution of the blade under different Cm (Pin = 47 kPa): (I) streamline distribution and (II) cavitation volume fraction distribution.

Streamline and cavitation volume fraction distribution of the blade under different Cm (Pin = 45 kPa): (I) streamline distribution and (II) cavitation volume fraction distribution.
It can be seen from Figure 4(a), the flow pattern near the airfoil of the middle section of the blade is quite smooth, so sediment concentration has little effect on the streamlines near the blade.
It can be seen from the Figure 4(b) that in the primary cavitation stage, cavitation only appears in the back area of the blade head. As sediment concentration rises, the cavitation coverage gradually expands, indicating that sediment concentration remarkably interferes with the cavitation inside the pump.
When the inlet pressure of the pump drops to the critical cavitation pressure, the trailing edge streamline of the blade begins to become turbulent, and vortices appear. As the sediment content increases, the vortex intensity increases, and the flow state in the impeller deteriorates, as shown in Figure 5(a).
In addition, under the critical cavitation pressure, as the sediment content increases, the cavitation area on the back of the blade increases rapidly, and the entire back of the blade is almost covered by cavitation, as shown in Figure 5(b).
According to Figure 6, under severe cavitation pressure, both the range and intensity of flow separation vortex tend to be greater at the end of the blade. When sediment concentration increases gradually, the vortex range and cavitation region will increase accordingly and the internal flow pattern of the blade will become more unstable. It shows that the Cm will have a significant impact on cavitation, leading to the deterioration of axial-flow pump cavitation performance.
In order to more intuitively analyze the influence of sediment concentration on pump cavitation, the different-radius sections of the blade are taken for analysis and the cavitation volume fractions on different sections are extracted for comparison.
Figures 7 to 9 display the cavitation volume fraction distribution in the impeller when the particle size is 0.05 mm and sediment concentration is diverse under varied cavitation states. In the whole, without changing other conditions, the cavitation in the pump develops rapidly when the inlet pressure decreases. From initial cavitation to critical cavitation, the cavitation volume fraction increases and the region expands rapidly, and the later promptly develops from the later part of the blade head to the middle and rear part of the blade, coupled with an increase in the cavitation volume fraction. From critical cavitation to severe cavitation, the cavitation volume fraction and region augment continuously but just by a small margin, and cavitation spreads over almost the entire back of the blade. This goes to explain that inlet pressure plays a dominant role in the development of cavitation.

Cavity volume fraction distribution under different blade streamlines (d = 0.5 mm, Pin = 80 kPa): (a) hub streamline, (b) mid streamline, and (c) rim streamline.

Cavity volume fraction distribution under different blade streamlines (d = 0.5 mm, Pin = 47 kPa): (a) hub streamline, (b) mid streamline, and (c) rim streamline.

Cavity volume fraction distribution under different blade streamlines (d = 0.5 mm, Pin = 45 kPa): (a) hub streamline, (b) mid streamline, and (c) rim streamline.
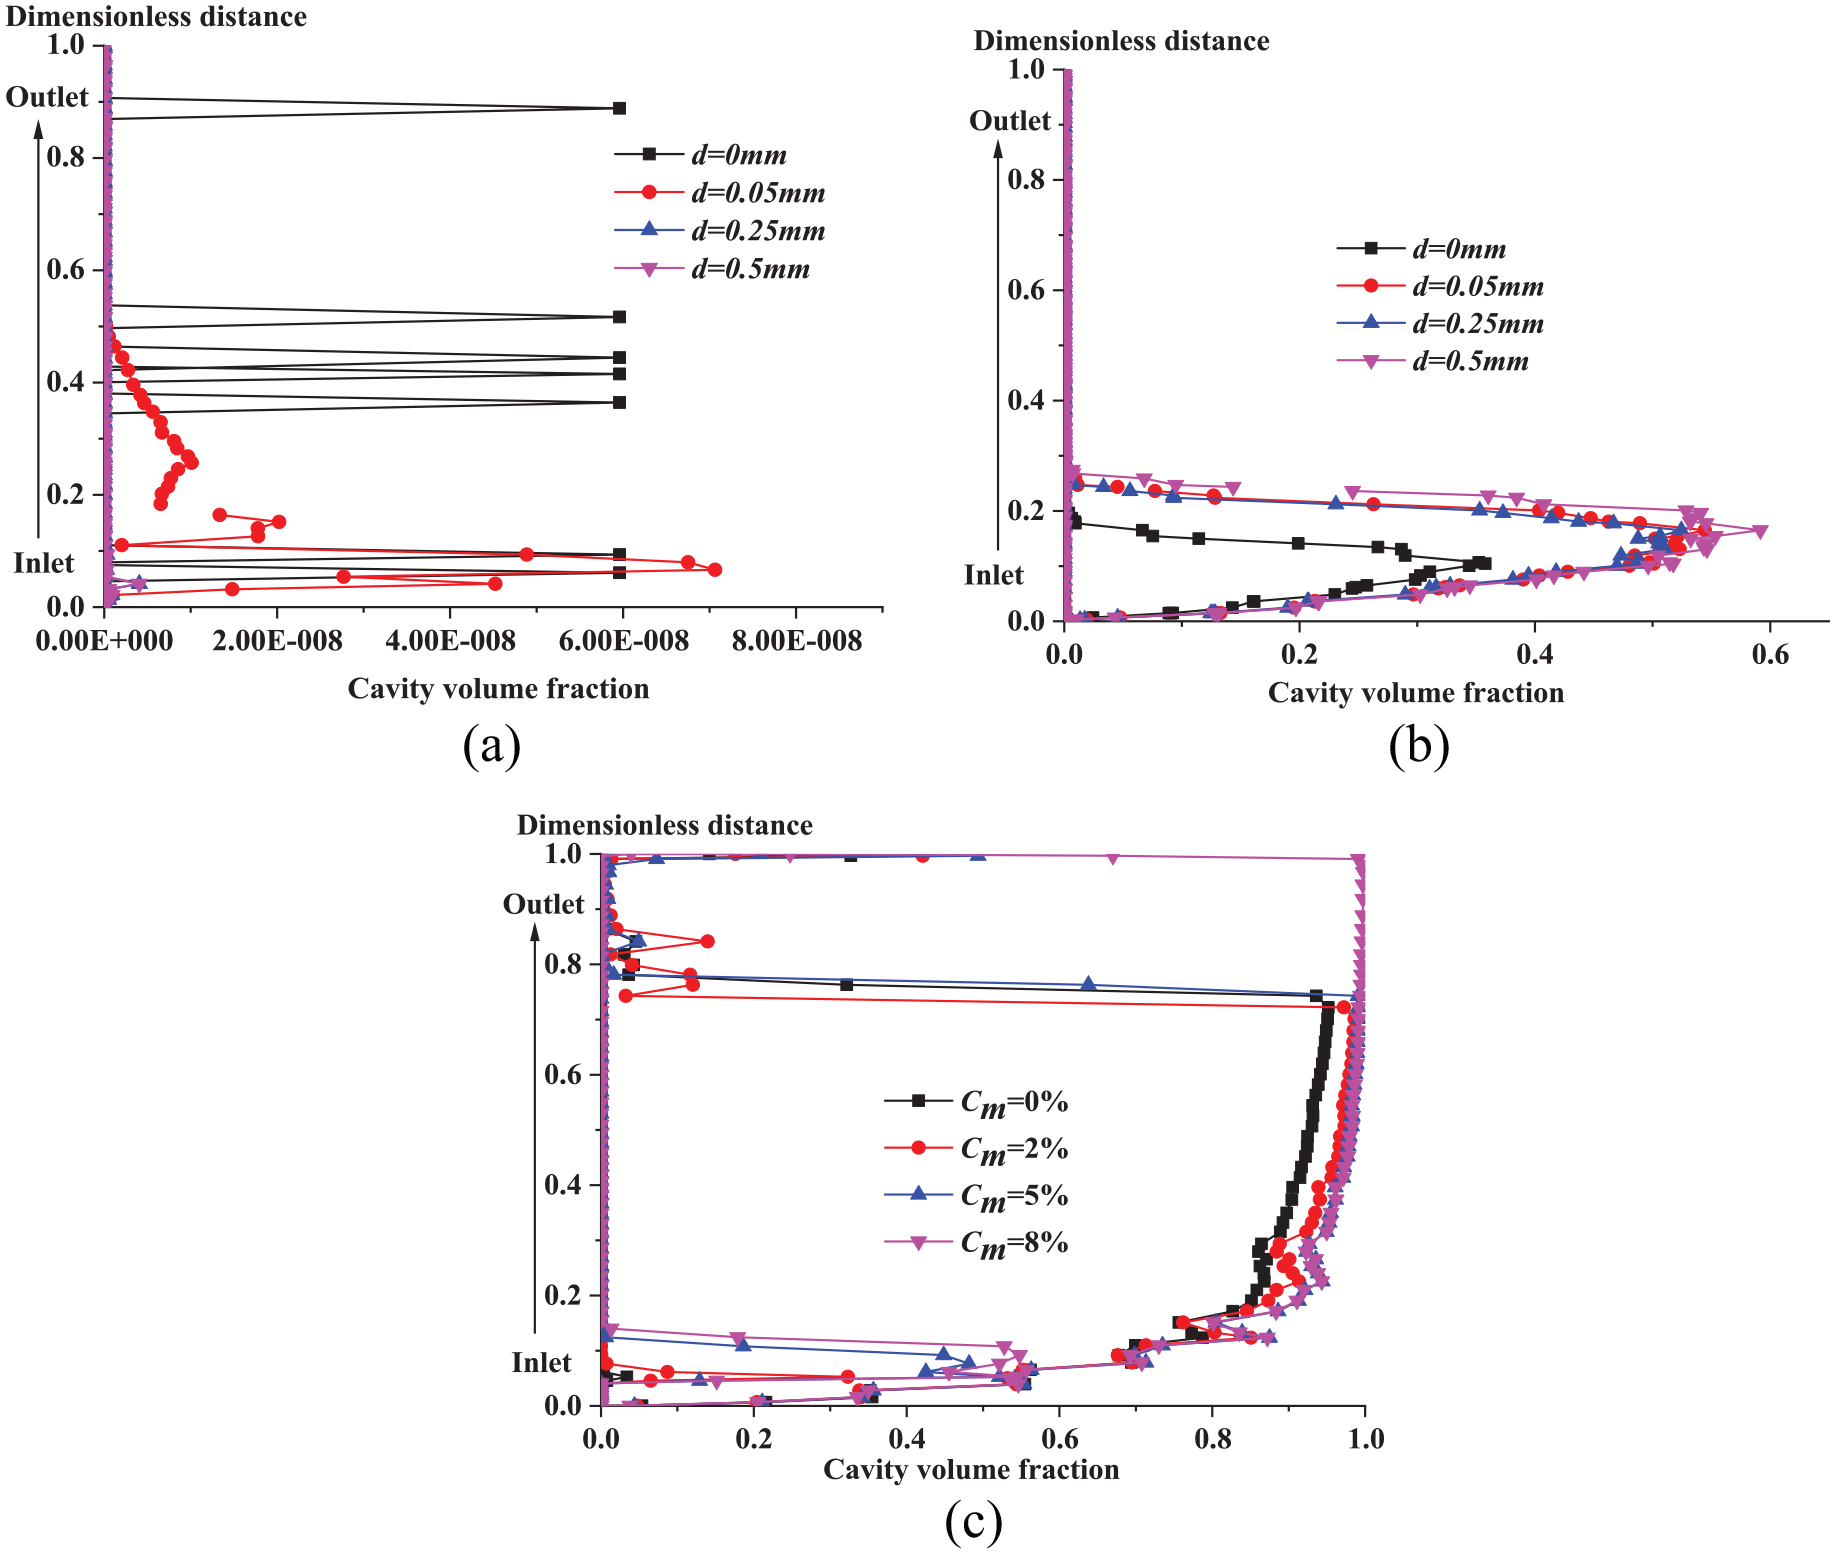
As seen from Figure 8 partially, in the primary cavitation stage, the cavitation concentration at the hub is very low and almost zero under the same sediment concentration; At the middle and rim streamlines, cavitation is mainly distributed at the dimensionless distance of 0.2 at the head of the blade back. In the radial direction, cavitation coverage gradually extends from the hub to the rim. This is due to the existence of gap cavitation, leakage cavitation, and other forms of cavitation at the tip of the blade which exacerbates cavitation at the rim. As the sediment concentration goes up, cavitation range and value increase too. The cavitation curve in clean water is in the innermost layer and the curve of 8% sediment concentration in the outermost layer, which is in accordance with the previous analysis.
As evident from Figures 8 and 9, in both the critical and severe cavitation stage, the cavitation volume fraction is very low and almost zero at the hub, and the smallest area of the cavitation is the hub when sediment concentration remains the same. In the middle and rim streamlines, the cavitation region takes up more than 80% of the back of the blade. As the sediment concentration rises to 8%, the middle and hub streamlines are basically all covered with cavitation. It is proved that sediment concentration does not play a major role in the cavitation volume fraction value, but still an important indicator that affects the cavitation region.
Effect of particle size on the cavitation volume fraction
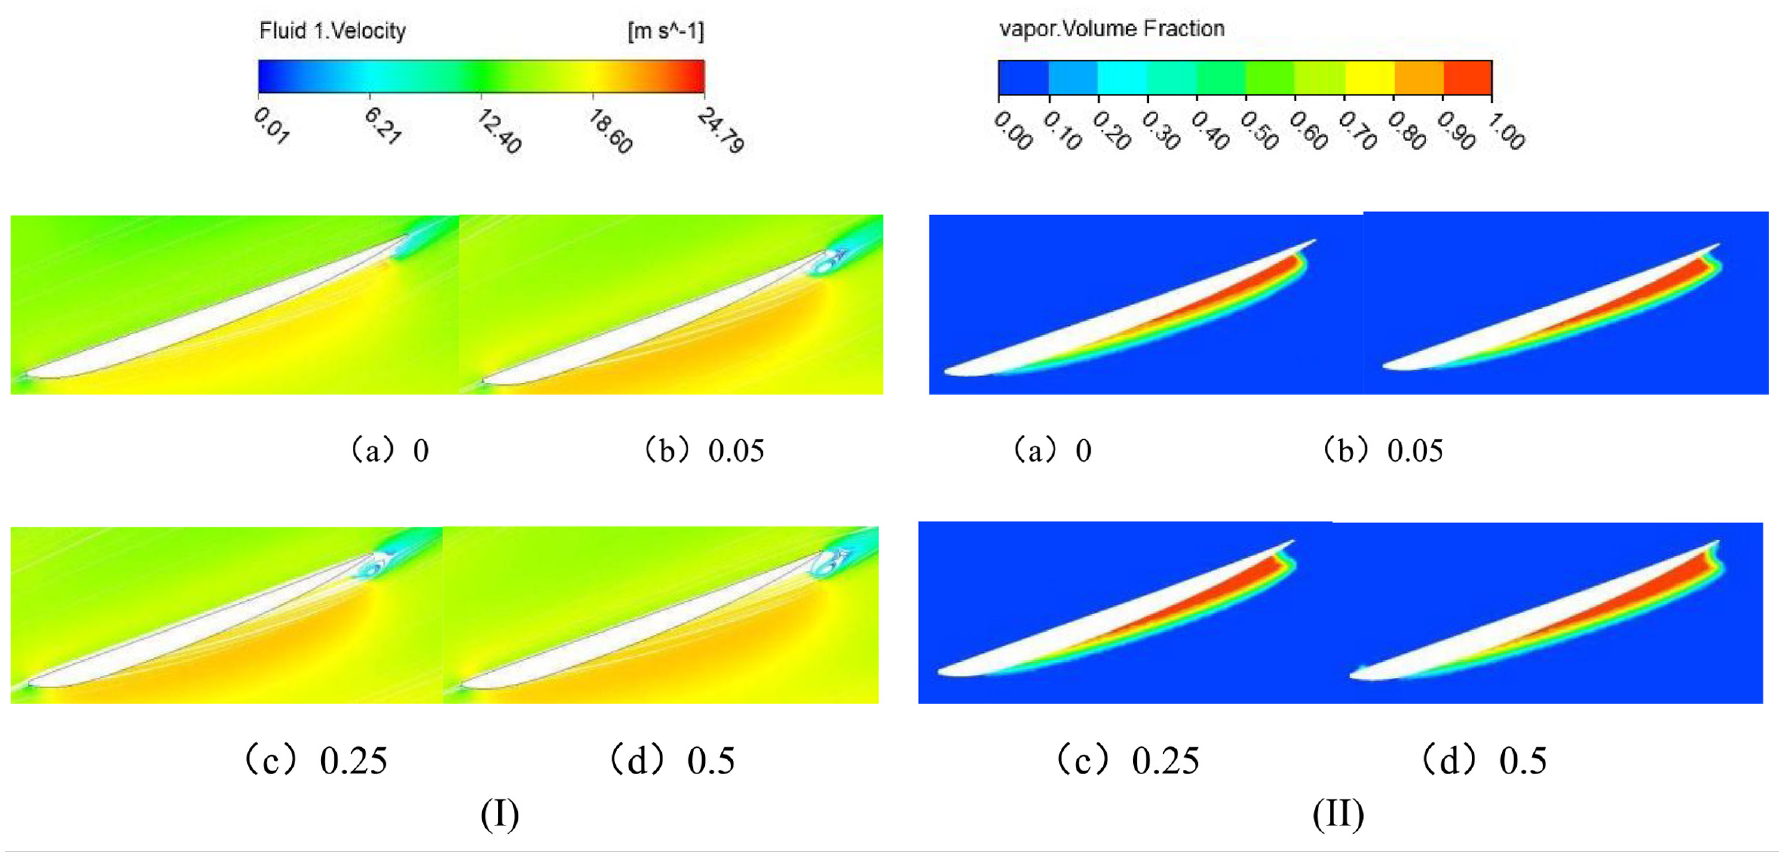
Figures 10 to 12 show the streamline and cavitation volume fraction distribution in the middle section of the blade under the conditions of design flow and different particle sizes when sediment concentration is 5%, and the inlet pressure is 80 kPa (primary cavitation), 47 kPa (critical cavitation), and 45 kPa (serious cavitation) respectively.

Streamline and cavitation volume fraction distribution of the blade under different particle sizes (Pin = 80 kPa): (I) streamline distribution and (II) cavitation volume fraction distribution.
Streamline and cavitation volume fraction distribution of the blade under different particle sizes (Pin = 47 kPa): (I) streamline distribution and (II) cavitation volume fraction distribution.

Streamline and cavitation volume fraction distribution of the blade under different particle sizes (Pin = 45 kPa): (I) streamline distribution and (II) cavitation volume fraction distribution.
Figure 10 reveals that in the primary cavitation stage, the internal flow pattern is rather smooth in the impeller and cavitation only exists in the later part of the blade back under the same sediment concentration and varying particle sizes; cavitation coverage also grows with sediment diameter gradually climbing which coheres with the influence of cavitation on the sediment concentration.
It can be seen from Figures 11 to 12 that in both the critical and severe cavitation stage, the presence of sediment exerts a relatively great influence on the flow field and cavitation. By comparing cavitation in clean water with cavitation in sandy water, it indicates that the vortex and cavitation region on the blade end expand dramatically in sandy water. As the diameter of the sediment increases, the cavitation area gradually increases, but this trend is not obvious. It proves that compared with sediment concentration, particle size has little impact on the internal flow pattern and cavitation in the pump, which is seen as a secondary consideration.
In order to analyze the influence of particle size on cavitation more directly, different-radius sections of the blade are selected for analysis, and the cavitation volumes on different sections are extracted for comparison.
Figures 13 to 15 show the distribution of cavitation volume fractions at different cross-sectional streamlines when sediment concentration equals 5% and particle sizes differ.
Cavity volume fraction distribution under different blade streamlines (Cm = 5%, Pin = 80 kPa): (a) hub streamline, (b) mid streamline, and (c) rim streamline.

Cavity volume fraction distribution under different blade streamlines (Cm = 5%, Pin = 47 kPa): (a) hub streamline, (b) mid streamline, and (c) rim streamline.

Cavity volume fraction distribution under different blade streamlines (Cm = 5%, Pin = 45 kPa): (a) hub streamline, (b) mid streamline, and (c) rim streamline.
In general, it can be seen from Figures 13 to 15 that the influence of particle size on cavitation resembles that of sediment concentration. By keeping other conditions unchanged, cavitation in the pump is worsening as the inlet pressure decreases. Quite unlike cavitation in clean water, the cavitation value and range in sandy water are much larger while particle size has little effect on them since cavitation curves almost overlap in terms of changing particle sizes. All in all, particle size hardly acts on cavitation distribution which supports the results obtained above.
Influence of sediment on the maximum cavity volume fraction
Figure 16 shows the variations of the maximum cavity volume fraction of the blade with the changes in sediment concentration and diameter when inlet pressure changes continuously. It can be seen that as the inlet pressure decreases, the maximum cavity volume fraction increases, but the growth rate is different. The maximum cavity volume fraction in the case of cavitation in clean water is considerably lower than that of cavitation in sandy water.

Variations of the maximum cavity volume fraction of the blade with the Cm and d under different inlet pressure: (a) d = 0.5 mm and (b) Cm = 5%
With the particle size remains constant, the growth rate of the maximum cavitation volume fraction is the highest when the sediment concentration increases from 2% to 5% in the primary cavitation stage, while the lowest when the sediment concentration increases from 5% to 8%. In both the critical and severe cavitation stages, the growth rate of the maximum cavitation volume fraction in the case of cavitation in sandy water represent is relatively higher compared to cavitation in clean water, while the sediment concentration almost makes no difference to it. This is because cavitation has already been severe at the time, and the maximum cavitation volume fraction has already approached the maximum value of 1.
When sediment concentration remains constant, compared with cavitation in clean water, the growth rate of the maximum cavitation volume fraction in the case of cavitation in sandy water in the primary cavitation stage is significantly larger than both the critical and severe cavitation stages, and when the cavitation state alters, the maximum cavitation volume fraction is barely affected by the variations of particle size.
Conclusion
With the increase of sediment concentration, the blade vortex range and cavitation region will further increase, and the flow pattern in the impeller becomes more disordered. This means that sediment will worsen the internal flow pattern in the pump, promote the development of cavitation, and further reduce the cavitation performance of the pump. It is proven that sediment concentration is one of the main factors that influence the cavitation performance of the pump.
The influence of particle size on cavitation is similar to that of sediment concentration, but cavitation that occurs in clean water is in marked contrast to that in sandy water which can be seen from below. Both the cavitation value and range under the conditions of cavitation appearing in sandy water are significantly larger than those under the conditions of cavitation in clean water. However, particle size shows little effect on cavitation value and range. When particle sizes differ, the cavitation curves are almost overlapping. This means that the particle size will not have a huge influence on the cavitation distribution, which just verifies previous research results.
When cavitation does not occur, the sand content basically does not change the flow state in the impeller; when cavitation occurs in the pump, a flow separation vortex appears at the end of the blade. After adding sediment, the range of the vortex at the end becomes larger, and the flow state in the impeller changes. It shows that cavitation and sediment are the main factors affecting the flow characteristics in the impeller.
Footnotes
Handling Editor: James Baldwin
Declaration of conflicting interests
The author(s) declared no potential conflicts of interest with respect to the research, authorship, and/or publication of this article.
Funding
The author(s) disclosed receipt of the following financial support for the research, authorship, and/or publication of this article: This work is supported by the National Natural Science Foundation of China (grant number 52006061), the Natural Science Foundation of Hunan Province (grant number 2020JJ5273), the Scientific Research Foundation of Hunan Provincial Education Department (grant number 19B298), as well as the Key Project of Research and Development Plan of Hunan Province (grant number 2019SK2192).