
Abstract
This article studies the flow trajectories and the wear law of sediment particles in a pump considering multiple variables, such as sediment concentration, particle size, and cavitation stage. In addition, the mechanism of joint effects of cavitation and sediment wear of the axial-flow pump is explored. In this work, the characteristics of cavitation and sediment wear in an axial-flow pump are investigated by the numerical simulation using shear stress transport k–ω turbulence model with experimental validation. The external characteristics of experimental results and numerical simulations are in agreement. The results show that the sediment concentration exerts a profound influence on the vacuole distribution in the pump, while the particle size has little effect on it. Cavitation can increase the volume fraction of the solid, accelerate the wear on the components, and affect the sediment distribution in the impeller. Cavitation and sediment wear are mutually worsening, and their joint effects will form a vicious circle. With the decrease in inlet pressure and the increase in sediment concentration and particle size, the maximum wear rate will gradually increase, which proves that cavitation, sediment concentration, and particle size are the main factors that influence the maximum wear rate.
Keywords
Introduction
Currently, the selection, design, and test of the axial-flow pump conveying solid particles are carried out in accordance with the axial-flow pump for clean water. However, when the axial-flow pump is used for draining, solid particles in the flood will affect the normal operation of the pump. Especially when the pump cavitation occurs, the impeller will be impaired by joint effects of cavitation and sediment wear, resulting in damage completely different from cavitation or wear alone, but even more serious.1,2
The existing literature focuses on investigating cavitation3–8 and sediment wear9–14 of the pump with little consideration of the joint effects of cavitation and sediment wear.
The complexity of sediment wear differs from that of cavitation.
1. The joint effects of sediment wear and cavitation are more destructive than the damage caused by either of them.
Sediment will increase the number of cavitation nuclei in water, which intensifies cavitation. Besides, the impact velocity and intension of the sediment grow with the micro-jet generated by the bubble collapse. Figure 1 shows an axial-flow impeller 15 subjected to cavitation damage, which has left honeycomb pittings on the suction side (SS) of the blade.

Blades damaged by cavitation.
In terms of theoretical models, based on the abrasion test done by Sato et al., 16 Li17,18 believes that the joint effects of sediment and bubbles are not just a simple addition of the two, but more serious.
In the numerical simulation, Dunstan and Li 19 found that under the micro-jet entrainment, the particles in the cavitation field will be accelerated, which consequently quickens the wear and tear on the material surface. In the study on turbines containing sandy water, Liao et al. 20 simulated the cavitation characteristics of axial-flow turbines with clear water and sandy water as transport mediums separately. It can be concluded that the cavitation erosion will be more serious when there are impurities in the water. The higher the sediment concentration is, the more seriously the flow passage wears and the quicker the turbine efficiency drops. Wang et al. 21 numerically simulated a centrifugal pump that contains solid particles in the transport medium. The result indicates that under the same inlet pressure, the pump cavitation performance decreases with the increase in solid particle concentration in the centrifugal pump.
In the experimental research, Du 22 studied sediment wear, cavitation, and their joint effects through a number of experiments. After comprehensive analysis, it is found that sediment wear only smooths the flow surface, while the joint effects of the two will produce fish scale pits and accelerate the wear on the surface.
2. The damage caused by sediment wear and cavitation erosion will not enlarge indefinitely.
Duan and Karelin 23 found that the effects of abrasion are less than pure wear, and at a specific flow rate, the bubbles will rebound off the sand like an air cushion, which in turn protects the wall. Based on the research of Cheng 24 and Huang et al., 25 Deng et al. 26 studied the effects of different sediment concentrations on cavitation through a number of experiments and found that low sediment concentrations accelerate cavitation, while high concentrations limit it. The relationship between sediment concentrations and wear degree is shown in Figure 2.

Relationship between sediment concentrations and wear degree.
The above-mentioned research works are basically about the sediment wear of hydraulic turbines, but few studies involve pumps. Therefore, the article analyzes the distribution of solid particles and the flow law of the pump and studies the influence of the solid particles concentration on the cavitation. Besides, the article reveals the flow trajectory inside the impeller and the distribution law of volume fractions when cavitation occurs. The study on the mechanism of joint effects of axial-flow pump cavitation and sediment wear can work as reference for the design of axial-flow pump containing solid particles.
Axial-flow pump model
Design parameters
The design parameters of the axial-flow pump (model: 28CJ-70) are displayed in Table 1.
Main design parameters of the pump.

Axial-flow pump calculation domain and meshing
In accordance with the factory test (pump section test) of large axial-flow pump, the inlet and outlet flow passages of large axial-flow pumps are simplified. The calculation domain is shown in Figure 3(a), and the overall mesh division is shown in Figure 3(b).
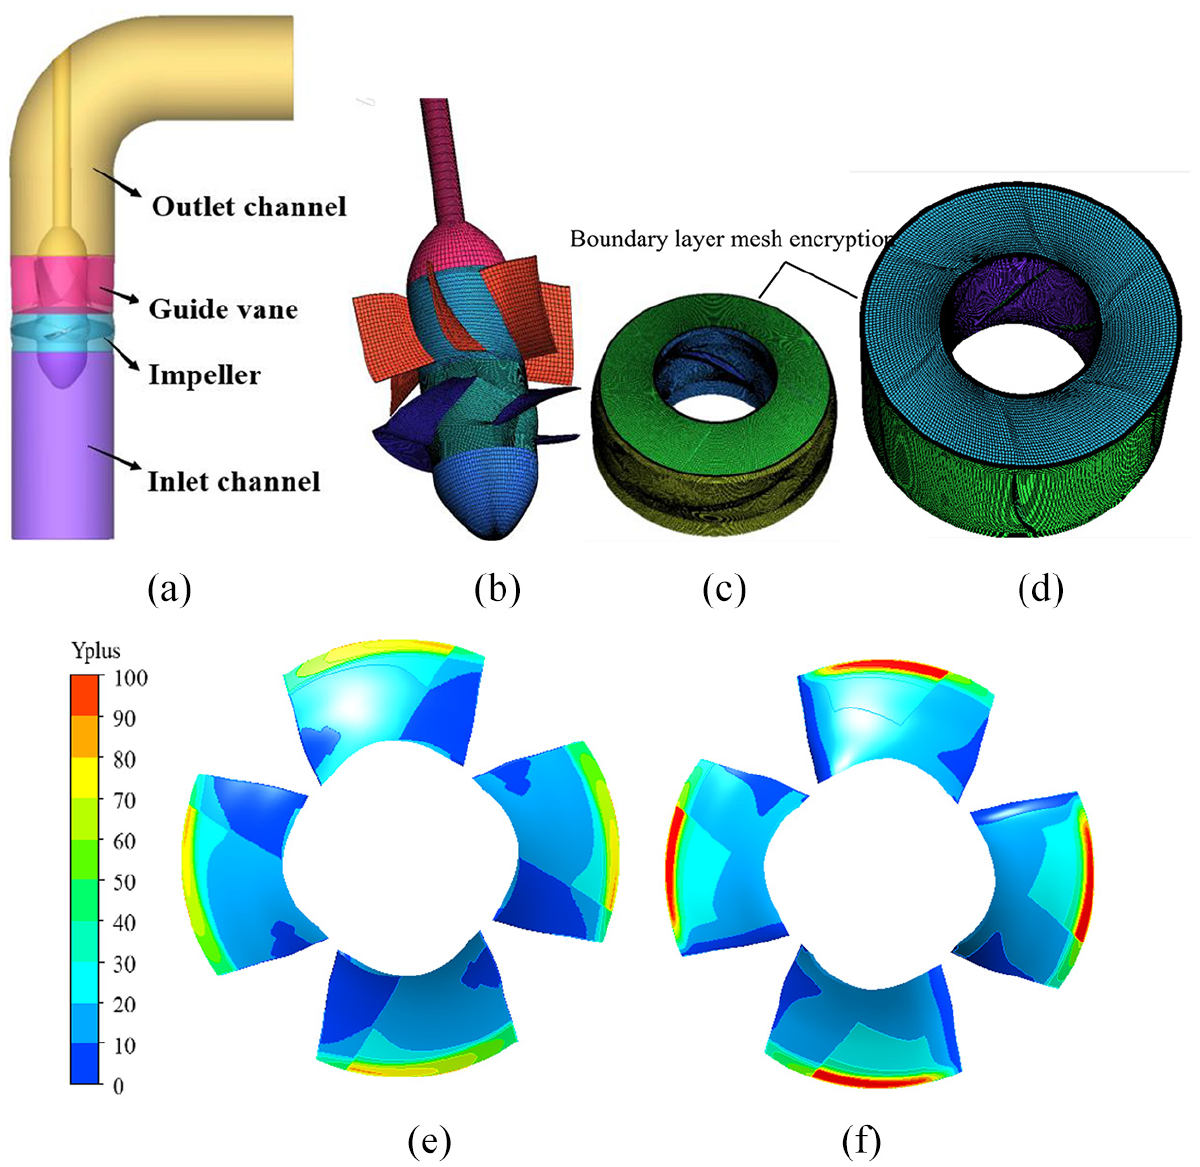
Axial-flow pump model and structural meshing. (a) Axial-flow pump model, (b) model mesh, (c) impeller mesh, (d) guide vane mesh, (e) pressure side (PS), and (f) suction side (SS).
Meshing independence verification
A boundary layer mesh shown in Figure 3(c) and (d) was used to ensure that y+ on the blade surface is suitable, and the automatic near-wall treatment for the omega-based model was used for the wall. 27 As shown in Figure 3(c)–(f), y+ on the blade surface is varied from 1 to 100, and the average y+ on the surface is about 50 (Table 2).
Meshing independence analysis.

Considering the calculation error and calculation efficiency, the grid of scheme 2 is chosen for the follow-up research works.
Numerical calculation method
For calculation, the article adopts the shear stress transport (SST) k–ω turbulence model and numerically simulates the axial-flow pump in terms of the pressure inlet and the boundary conditions of the mass flow outlet. The value of non-cavitation in clean water is used as the initial value of cavitation calculation. Water at 25°C and water vapor are selected as the working mediums. The density of water and water vapor is 997 and 0.02308 kg/m3, respectively. The saturated vapor pressure is 3169 Pa and the average parameter of bubbles is 2 × 10⁻⁶ m. The volume fractions of water and water vapor at the inlet are set at 1 and 0, respectively.
Mathematical model
Governing equations
The governing mixture equations for mass and momentum are 28


The liquid–vapor mass transfer due to the cavitation was modeled by a vapor volume fraction transport equation

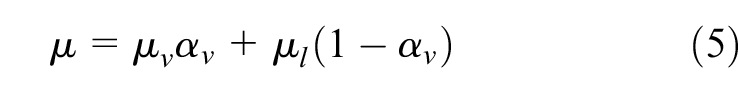
where ui is the velocity vector, ρm is the mixture density, ρv is the vapor density, ρl is the liquid density, αv is the vapor volume fraction, µ and µt are the mixture dynamic viscosity and the turbulent viscosity, respectively, and Re and Rc are the mass transfer source terms related to the evaporation and the condensation of the liquid and vapor phases in the cavitation.
The mixture density ρm and the mixture dynamic viscosity µ are defined as

Cavitation model
The cavitation model, solved the following transport equation for αv in equation (5). Source terms Re and Rc were derived from the bubble dynamics equation of the generalized Rayleigh–Plesset equation that accounts for mass transfer between the vapor and liquid phases in cavitation.
They have the following forms

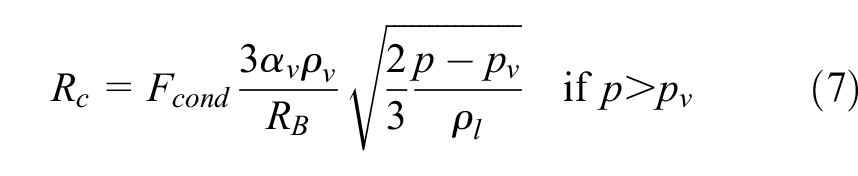
The model involves four parameters, and default values are used here. They are as follows: the bubble radius RB = 10–6 m, the nucleation site volume fraction rnuc = 5 × 10⁻⁴, and the evaporation and condensation coefficients Fvap = 50 and Fcond = 0.01.
Wear model
The calculation of wear is done using ANSYS CFX, in which the particle model and the Tabakoff wear model are employed. The particle orbital model (particle model) stipulates that each group of particles moves along their own independent orbits from the initial position. The particles are independent of each other, and there is a relative velocity slippage between the particles and the fluid regardless of the turbulent diffusion, viscosity, and heat conduction of the particles. The Tabakoff wear model, an empirical and semi-empirical wear model on the effects of different particle jet velocities and incident angles on target material wear achieved by Grant and Tabakoff, 29 is based on particle trajectories to predict wear.
Wear rate
The collision velocity and angle of the particles, the properties of the particles, and the material surface all affect the degree of wear.
In a unit time, the material mass worn by the particles acting on the per unit of the surface is also called the wear rate which can be represented as follows

where


In the above formula, E is the surface wear rate (the dimension is one); θ is the particle collision angle (°);
Equation (8) can be divided into two parts: the first part is the particle small-angle cutting damage, which discloses the damage mechanism of the particles to malleable material. The second part reveals the erosion of the particle’s normal velocity on target material, which is proportional to the fourth power of velocity, that is, the damage mechanism of particle to brittle material.
The wear model takes into account the joint effects of malleable and brittle materials, so the wear characteristics can be predicted more comprehensively. At present, the wear model is mainly applied to steel, aluminum, and other materials. The specific parameters are shown in Table 3. This article selects steel materials for research. The incident mode seeks to make the particles evenly distributed, and the number of particles is set at 20,000.
Model parameters.

Results and discussion
Effects of sediment on external characteristics and cavitation performance of the pump
The intervention in the cavitation performance of axial-flow pump imposed by sediment concentrations (Cm) and particle size (d) is analyzed. The calculation scheme is shown in Table 4. 30
Calculation scheme.

Figure 4 presents the comparison between the experimental values when clean water is conveyed and the calculated values of the external characteristics when the axial-flow pump conveys clean water and sandy water with the particle size being 0.5 mm and the sediment concentration being 5% separately.

Comparison of experimental and predictive performance.
It can be seen from the figure that the calculated values of the external characteristics accord with the experimental values, indicating that the SST k–ω turbulence model is applicable in the numerical calculation when the axial-flow pump conveys clean water and sandy water. When the axial-flow pump conveys impure water, its head and efficiency are slightly reduced, and the drop at a low flow rate is more than that under other conditions.
Figure 5 shows the dimensionless curve net positive suction head (NPSH)–H of the pump under different sediment concentrations when the particle size is 0.5 mm. As seen from the figure, the dimensionless curve of the axial-flow pump gradually decreases as the sediment concentrations increase. It is worth noting that the head drop of the pump is not very distinct when the sediment concentration is at a low level (Cm = 2%); as the sediment concentration continues to increase (Cm = 8%), the pump head drops sharply. Especially when severe cavitation occurs, the curve plummets sharply, and the cavitation performance decreases overtly. It proves that the sediment concentration has a significant impact on the cavitation performance of the pump.

The dimensionless curve NPSH–H of the pump.
Effects of cavitation on solid volume fraction
The article studies the variations of solid volume fractions in the impeller under design flow conditions, when sediment concentration is 0%, 2%, 5%, and 8% respectively, and particle parameter is 0.05, 0.25, and 0.5 mm, respectively. The interaction between cavitation and sediment distribution is also analyzed.
To better understand the variations of the solid volume fractions of the impeller and vane surface along the axial and radial directions of the blade, five cross-sectional streamlines are selected, as shown in Figure 6(a). The cross-sectional streamline is selected with rb, which is shown in Figure 6(b) and can be defined as follows

where, x stands for the distance from the section to the hub (m) and X stands for the difference between the outer diameter of the blade and the hub (m).

Impeller and guide vane cross-sectional streamlines and
Effects of sediment concentration on solid volume fraction in cavitation state
Figures 7–9 show the distribution of solid volume fraction on the different positions of the blade under different sediment concentrations when the pump inlet pressure is 80 kPa (primary cavitation), 47 kPa (critical cavitation), and 45 kPa (severe cavitation), respectively.
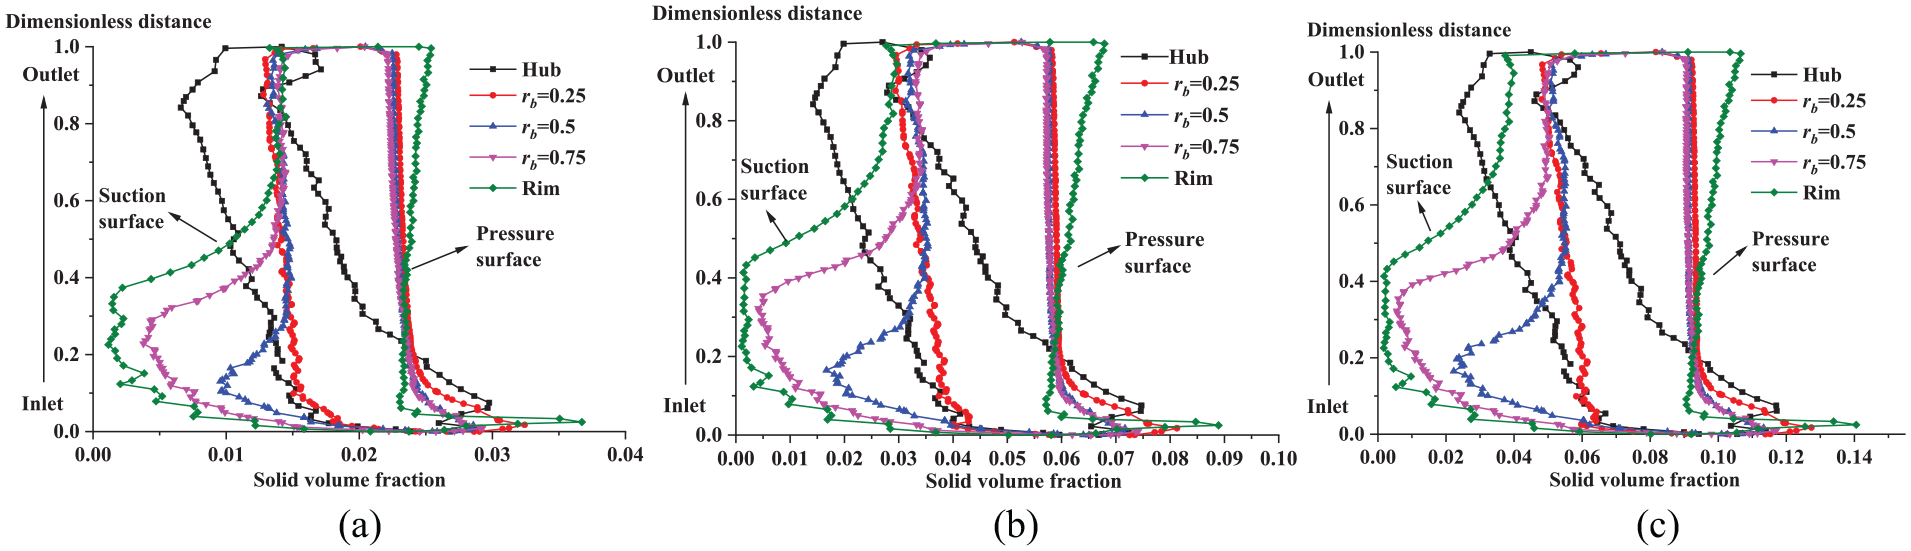
Solid volume fraction distribution at different cross-sectional streamlines of the blade (d = 0.5 mm, Pin = 80 kPa): (a) Cm = 2%, (b) Cm = 5%, and (c) Cm = 8%.

Solid volume fraction distribution at different cross-sectional streamlines of the blade (d = 0.5 mm, Pin = 47 kPa): (a) Cm = 2%, (b) Cm = 5%, and (c) Cm = 8%.

Solid volume fraction distribution at different cross-sectional streamlines of the blade (d = 0.5 mm, Pin = 45 kPa): (a) Cm = 2%, (b) Cm = 5%, and (c) Cm = 8%.
In general, the solid volume fraction of the blade working face is markedly larger than that of the back, and it is mostly distributed at the head of the blade and the working face of the blade tail. From primary to critical stage of the cavitation, increases in both solid volume fraction and the areas are obviously greater than those of the cavitation from critical to severe stage, which means that cavitation will increase the solid volume fraction and thus further accelerate the wear on components. As cavitation blocks part of the flow passage, leading to sediment accumulation, reduced flow area, and accelerated flow speed, the wear on the impeller is aggravated.
In the primary cavitation stage, as shown in Figure 7, with the same sediment concentration, the solid volume fraction is the lowest on the back of the rim near inlet, while the highest on the working face. Along the radial direction, on the working surface, the solid volume fraction is approximately X-shaped, with a dimensionless distance of 0.25 as a boundary point. In the region with a dimensionless distance ranging from 0.25 to 1, the solid volume fraction at the hub streamline gradually decreases from inlet to outlet, while the solid volume fraction at other streamline is quite the opposite. The solid volume fraction increases most dramatically at the streamline of the blade rim. In the region with a dimensionless distance ranging from 0 to 0.25, the solid volume fraction fluctuates sharply. The solid volume fraction is the largest at the inlet of the rim streamline and the smallest at the inlet of the hub streamline. The range and value of solid volume fraction augment with the increase in sediment concentrations, which is consistent with previous studies.
Influence of particle size on solid volume fraction under cavitation
Figures 10–12 show the distribution of solid volume fraction on the blade with different particle sizes when the pump inlet pressure is 80 kPa (primary cavitation), 47 kPa (critical cavitation), and 45 kPa (severe cavitation), respectively.

Solid volume fraction distribution at different cross-sectional streamlines of the blade (Cm = 5%, Pin = 80 kPa): (a)d =0.05 mm, (b) d =0.25 mm, and (c) d =0.5 mm.

Solid volume fraction distribution at different cross-sectional streamlines of the blade (Cm = 5%, Pin = 47 kPa): (a) d =0.05 mm, (b) d =0.25 mm, and (c) d =0.5 mm.

Solid volume fraction distribution at different cross-sectional streamlines of the blade (Cm = 5%, Pin = 45 kPa): (a) d =0.05 mm, (b) d =0.25 mm, and (c) d =0.5 mm.
As shown in Figures 10–12, when keeping other conditions unchanged, the maximum volume fraction of the solid in the pump gradually increases with the decrease in inlet pressure. The solid volume fraction of the blade working face is greatly larger than that of the back. This is especially true at the head, and the tail working face. When cavitation takes shape, the solid volume fraction on the back of the blade will decrease visibly and transports to the working surface of the blade inlet, which aggravates the wear on the surface of blade inlet. The reason is that the bubbles on the back of the blade will crowd each other out, which changes the flow direction of the liquid flow and its particles in the passage. The trajectory on the working face reduces the solid volume fraction on the back of the blade outlet and increases the volume fraction of the solid on the pressure side (PS).
As evident from Figures 10–12 partly, on the back of the blade, the solid volume fraction at the rim is the lowest, while at the hub the highest; on the working face, the solid volume fraction at the head and tail of the rim is the highest. In the same cavitation state, as the particle size increases, the solid volume fraction will gradually increase from the hub to the rim on the working surface, while at the back the situation is the other way around. It proves that cavitation affects the distribution of sediment in the impeller, while the size of the particle makes little effect on the distribution of the solid, mainly affecting its volume fraction.
Effect of sand cavitation on the maximum solid volume fraction
Figure 13 shows the curve of the maximum solid volume fraction of the blade with the change in sediment concentration and diameter under different inlet pressures. It can be seen from the figure that when the inlet pressure lowers, the maximum solid volume fraction will slightly increase; when the sediment concentration and diameter increase, the maximum solid volume fraction will increase distinctly.

Variation of maximum solid volume fraction of the blade with the change in sediment concentration and diameter under different inlet pressures: (a) d =0.5 mm and (b) Cm = 5%.
It shows that the main factors that affect the maximum solid volume fraction are sediment concentration and diameter. The inlet pressure (cavitation state) mostly affects the sediment distribution, but has little influence on the sediment volume fraction.
Joint effects of cavitation and sediment wear
To work out the mechanism of joint effects of cavitation and sediment wear, the article explores the effects of sediment cavitation on the wear rate of impellers by studying cavitation under different sediment concentrations and particle diameters.
Effects of sediment concentration on wear rate under cavitation conditions
Figures 14 and 15 show the wear rate distribution at different positions of the blade when the pump inlet pressure is 80 kPa (primary cavitation) and 47 kPa (critical cavitation), respectively, under different sediment concentration. Furthermore, the wear rate of the surface is mainly distributed at the head from the axial direction. From the radial direction, the wear rate is mainly distributed in the middle of the blade and is relatively low at the hub and the rim.

Wear rate at different cross-sectional streamlines of the blade (d = 0.5 mm, Pin = 80 kPa): (a) Cm = 2%, (b) Cm = 5%, and (c) Cm = 8%.

Wear rate at different cross-sectional streamlines of the blade (d = 0.5 mm, Pin = 47 kPa): (a) Cm = 2%, (b) Cm = 5%, and (c) Cm = 8%.
As cavitation develops, the maximum wear rate increases while sediment concentration remains the same, which means that cavitation accelerates the wear on the impeller surface. In the same cavitation state, the increase in the sediment concentration will magnify the wear rate, showing that wear rate and sediment concentration are positively correlated. Wear and cavitation are mutually worsening, which is consistent with the conclusion of viewpoint 1 (the joint effects of sediment wear and cavitation is more destructive than the damage caused by either of them) mentioned in the introduction. When sediment concentration is relatively low, cavitation remains the major damage. However, when sediment concentration increases gradually, sediment wear becomes the dominant damage. Besides, the joint effects of cavitation and wear aggravate and accelerate the damage to the flow surface. On the one hand, when the surface is subjected to sediment wear, the uneven surface will give rise to flow separation and vortex, which in turn exacerbates cavitation.
On the other hand, the material of the flow surface becomes more fragile due to cavitation, which in turn exacerbates wear on the surface. Therefore, the destructive effects of the two form a vicious circle.
Effect of particle size on wear rate under cavitation
Figures 16 and 17 show the curves of the wear rate distribution at different positions of the blades when the pump inlet pressure is 80 kPa (primary cavitation) and 47 kPa (critical cavitation), respectively, with different particle sizes.

Wear rate at different cross-sectional streamlines of the blade (Cm = 5%, Pin = 80 kPa): (a) d =0.05 mm, (b) d =0.5 mm, and (c) d =1 mm.
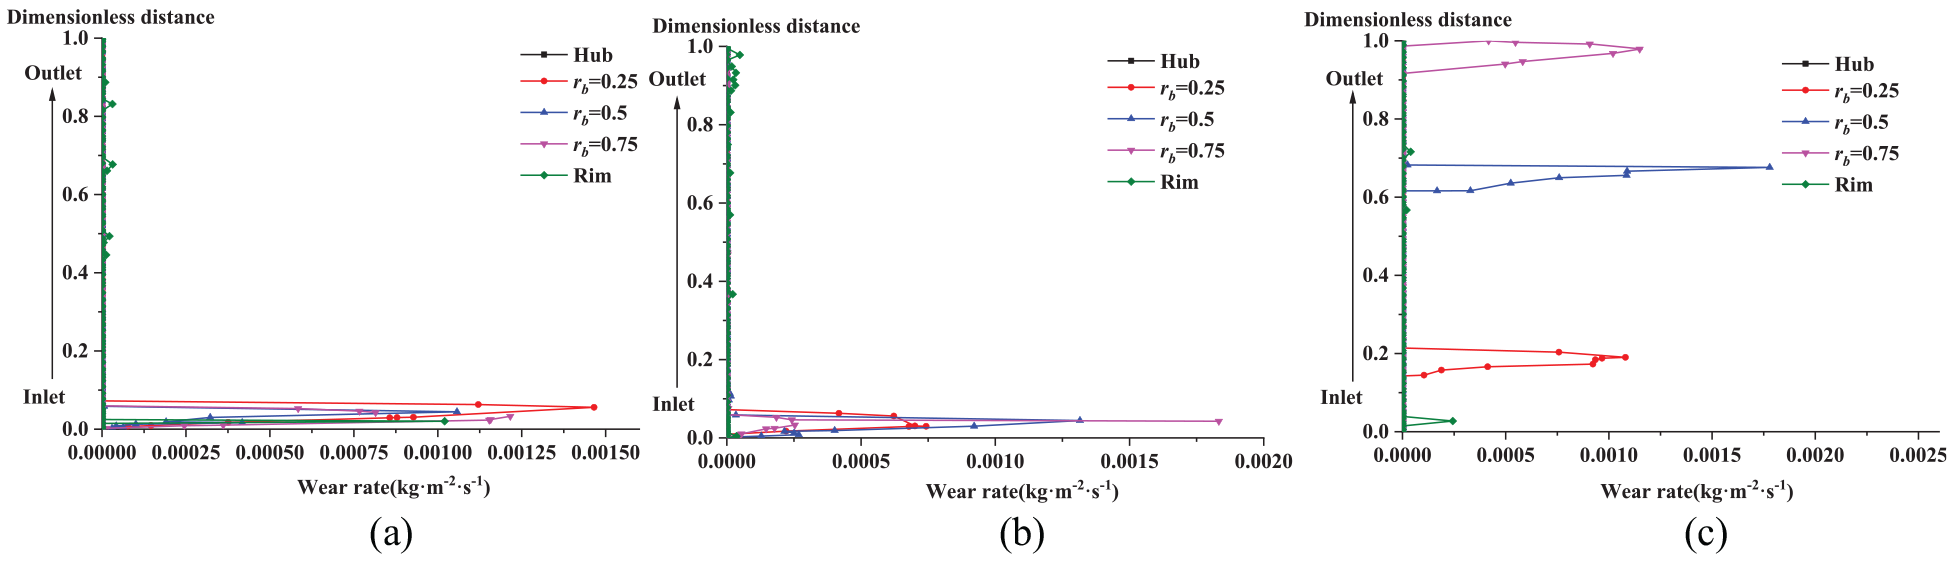
Wear rate at different cross-sectional streamlines of the blade (Cm = 5%, Pin = 47 kPa): (a) d =0.05 mm, (b) d =0.5 mm, and (c) d =1 mm.
According to Figures 16 and 17, when the particle size is 0.05 and 0.5 mm, respectively, the wear on the blade surface is mainly gathered at the head. When the particle size is large (d = 1 mm), the wear is mainly at the head, middle, and tail of the blade, wherein the wear rate is the largest in the middle, followed by the tail. From the radial direction, the wear is mainly distributed in the middle of the blade, while at the hub and the rim the wear rate is relatively low. When cavitation worsens and the particle size remains the same, the maximum wear rate increases. In the same cavitation state, the maximum wear rate augments with the increase in particle size. When the particle size is relatively small, such as 0.05 and 0.5 mm, the particle size will play a role in the wear rate of the blade surface while having little influence on its distribution. When the particle size is relatively large, such as 1 mm, the wear rate and its distribution will both be affected.
Effects of sediment concentration and particle size on maximum wear rate
Figure 18 shows the curve of the maximum wear rate with the change in sediment concentration and diameter under different inlet pressures. Figure 18(a) shows the maximum wear rate of the blade surface with the change in sediment concentration and inlet pressure when the particle size is 0.5 mm, while Figure 18(b) shows the rate with the change in particle size and inlet pressure when the sediment concentration is 5%.

Maximum wear rate density of the blade under different inlet pressures with the change in sediment concentration and diameter: (a) d =0.5 mm and (b) Cm = 5%.
As can be seen from the figure, as the inlet pressure falls, the maximum wear rate gradually increases, but differs in degrees. As shown in Figure 18(a), when sediment concentration is 2% and 5%, the increase in the maximum wear rate is similar. From no cavitation to the initial cavitation stage, the maximum wear rate increases markedly. But when the critical cavitation stage arises, the increase is relatively small. When sediment concentration is 8%, the maximum wear rate increases significantly, and the increase becomes more obvious with the decrease in the inlet pressure.
It indicates that both cavitation and sediment concentration are the main factors affecting the maximum wear rate, and the increase in the maximum wear rate is not proportional to the change in sediment concentration and inlet pressure. The above conclusions are consistent with the conclusions obtained in Serrano et al. 9
In Figure 18(b), when the particle diameters are 0.05 and 0.5 mm, the increase in the maximum wear rate is similar to that in Figure 18(a). The difference is that when particle diameter is 1 mm, the maximum wear rate increases almost linearly with the decrease in inlet pressure. This means that cavitation, sediment concentration, and particle size are the main factors affecting the maximum wear rate.
Research on flow field characteristics in impeller
Figures 19 and 20 show the distributions of streamlines and bubbles in the middle section of the blade under different sediment concentrations when the particle size is 0.5 mm, and the pump inlet pressure is 80 kPa (primary cavitation) and 47 kPa (critical cavitation), respectively.

Distribution of flow lines and vacuoles in the middle section of the blade under different sediment concentrations (Pin = 80 kPa: (I) distribution of flow lines: (a) 0%, (b) 2%, (c) 5%, and (d) 8% and (II) distribution of vacuoles: (a) 0%, (b) 2%, (c) 5%, and (d) 8%.

Distribution of flow lines and vacuoles in the middle section of the blade under different sediment concentration (Pin = 47 kPa): (I) distribution of flow lines: (a) 0%, (b) 2%, (c) 5%, and (d) 8% and (II) distribution of vacuoles: (a) 0%, (b) 2%, (c) 5%, and (d) 8%.
Figure 19(I) shows the streamline distribution in the middle section of the impeller in the primary cavitation stage. Under different sediment concentrations, the flow patterns near the middle section of the blade are smooth, and the flow patterns in the impeller are good. There are only local low velocity zones at the inlet and the tail, and the flow rate on the working surface of the blade is obviously lower than that on the back. Sediment concentration barely influences the flow patterns in the blade.
Figure 19(II) shows the bubble distribution in the middle section of the impeller in the primary cavitation stage. As can be seen from the figure, in the primary cavitation stage, cavitation only exists in the far back of the head of the blade. With the increase in sediment concentration, the bubble coverage gradually enlarges, but the ranges vary. When sediment concentration varies from 0% to 2%, the increase in cavitation is not obvious. This is because sediment concentration has little impact on cavitation when sediment concentration is relatively low and sediment follows the flow so closely. When sediment concentration changes from 2% to 5% and from 5% to 8%, the bubble coverage expands remarkably, indicating that when sediment concentration exceeds 2%, its intervention with cavitation in the pump is relatively obvious, and the cavitation performance of the pump will gradually decline due to the increase in sediment concentration.
Figure 20(I) shows the streamline distribution in the middle section of the impeller in the critical cavitation stage. As can be seen from the figure, in the critical cavitation stage, flow separation and vortex appear at the head and tail of the blade. Thus, the inlet and outlet on the back face of blade are unstable, and sediment and cavitation mainly affect here. When sediment concentration gradually increases, the vortex grow accordingly at the head and tail, and the flow patterns of the blade change as well.
Figure 20(II) shows the bubble distribution in the middle section of the impeller in the critical cavitation stage. As can be seen from the figure, in the critical cavitation stage, the back of the blade is almost all covered with bubbles except for the head and the tail. As sediment concentration increases, bubble coverage enlarges. When sediment concentration reaches 8%, the back of the blade is completely covered with bubbles. Furthermore, cavitation also occurs near the inlet of the blade working surface.
This means that sediment concentration will have a significant impact on cavitation, leading to the deterioration of pump cavitation performance, which corresponds to Figure 5. The increase in sediment concentration will increase the solid volume fraction on the blade surface, which will accelerate the wear on the blade and further promote the development of cavitation.
Conclusion
In view of the joint effects of cavitation and sediment wear, the characteristics of cavitation and sediment wear in an axial-flow pump are investigated via numerical simulation using SST k–ω turbulence model and validated by experiment. The conclusions can be drawn as follows:
The solid volume fraction of the blade working face is markedly larger than that of the back, and it is mostly distributed at the head of the blade and the working face of the blade tail. From primary to critical stage of the cavitation, increases in solid volume fraction and areas are obviously greater than those of the cavitation from critical to severe stage, which means that cavitation will increase the solid volume fraction and thus further accelerate the wear on components.
When the inlet pressure lowers, the maximum solid volume fraction will slightly grow; when the sediment concentration and diameter increase, the maximum solid volume fraction will increase distinctly. It shows that the main factors that affect the maximum solid volume fraction are sediment concentration and diameter. The inlet pressure (cavitation state) mostly affects the sediment distribution, but has little influence on the sediment volume fraction.
As cavitation develops, the maximum wear rate increases while sediment concentration remains the same, which means that cavitation accelerates the wear on the impeller surface. In the same cavitation state, the increase in the sediment concentration will magnify the maximum wear rate, showing that wear rate and sediment concentration are positively correlated. When cavitation worsens and the particle size remains the same, the maximum wear rate increases.
Wear and cavitation are mutually worsening. When sediment concentration is relatively low, cavitation remains the major damage. However, when sediment concentration increases gradually, sediment wear becomes the dominant damage. Besides, the joint effects of cavitation and wear aggravate and accelerate the damage to the flow surface. On the one hand, when the surface is subjected to sediment wear, the uneven surface will give rise to flow separation and vortex, which in turn exacerbates cavitation. On the other hand, the material of the flow surface becomes more fragile due to cavitation, which in turn exacerbates wear on the surface. Therefore, the destructive effects of the two form a vicious circle. This means that cavitation, sediment concentration, and particle size are all the main factors affecting the maximum wear rate.
This large axial-flow pump comes from a drainage pump station in use, which limits its experimental research. Subsequent researches will modify the cavitation model and manufacture a small model pump for related experimental studies to verify the accuracy of the numerical simulation results, considering areas which are vulnerable to cavitation and wear (such as head, tail, and blade working face). The study on the mechanism of joint effects of cavitation and sediment wear of the axial-flow pump can serve as reference for the design of axial-flow pump containing solid particles. For instance, on the premise of not greatly reducing the external characteristics and cavitation performance of the axial-flow pump, measures such as increasing the thickness of the inlet and outlet sides of the blade and spraying the wear-resistant coating can be adopted to improve the anti-wear performance of the impeller.
Footnotes
Handling Editor: James Baldwin
Declaration of conflicting interests
The author(s) declared no potential conflicts of interest with respect to the research, authorship, and/or publication of this article.
Funding
The author(s) disclosed receipt of the following financial support for the research, authorship, and/or publication of this article: This work was supported by the National Natural Science Foundation of China (Grant No. 51409197), the Natural Science Foundation of Hunan Province (On flow field characteristics of the bottom of self-vibrating pulse jet enhanced airlift pump, 2018JJ2195 and 2018JJ3253), the Hunan Provincial Department of Education Project (Grant Nos. 19B298, 18A419, and 18B462), as well as the Hunan Province Key Area R&D Program (Grant No. 2019SK2192).