
Abstract
To solve the problem of the fuzzy and dynamics of requirement caused by users’ cognitive bias, a dynamic requirement and priority capture method based on user scenarios is proposed, aiming at effectively improving user experience. The method consists of the following steps: Firstly, users with similar characteristics are filtered to form a user cluster, then obtain the user’s product experience in different usage scenarios and acquire preliminary requirements by using service design methods. Secondly, the requirement path model tree will be designed and the requirement path matrix will be constructed through the evaluation of the user cluster. Then the pathfinder algorithm will be used to calculate the required correlation of user clusters and prioritize the requirements. Finally, the direction of the product design will be provided. Taking the design of the intelligent office chair as an example, the effectiveness of the method is verified by evaluating the satisfaction of user experience.
Keywords
Introduction
In traditional product design field, designers usually develop products by technology-driven, but in the age of experience, user-centered design is emphasized. The difficulty of user research and user experience design lies in understanding the context and environment in which users use products. Understanding and satisfying users’ requirements through user scenarios is the key to effectively improving the user experience 1 of products. However, due to the cognitive bias among different users, there are uncertainties, and dynamic problems in needs, which make designers unable to accurately perceive users’ requirements. 2 Dynamic requirements refer to the continuous requirements of users when using the product in a specific scenario, and such requirements change with time changes and scenarios. In the current product design, scenario-based design is often ignored, and only the functionality of the product itself is considered, which easily leads to the product not being able to accurately match the needs of users in a specific scenario, resulting in poor product experience and low functional satisfaction. In order to effectively solve this problem, user needs must be viewed as a dynamic process. Therefore, capturing the dynamic needs of users is an important step for successful product design, and the requirement priority information output from this step will serve as the main guiding basis for product solution design, which will have an important impact on the improvement of end-user experience.
Literature research
In recent years, there has been an increasing amount of literature on the capture and analysis of user requirements. By acquiring user minds, user needs can be better grasped. Wu et al. 3 proposed a new synergistic approach with TRIZ (Theory of Inventive Problem Solving), AD (Axiom Design), Fuzzy and Grey Relational Analysis to identify the correct design goal and further decompose function requirements. Feng et al. 4 realized that in the customer requirement analysis stage, through data mining and transformation methods, customer requirements are predicted and then mapped to obtain accurate requirement expressions for aiding designers to explore the design space. Anh et al. 5 proposed a framework for assessing user requirements from websites to support designers. Zhang et al. 6 proposed the requirement acquisition based on the users’ mental models and constructed the users’ mental models by using the card classification features. Hu and Ma 7 proposed a metaphor extraction technology to acquire users’ minds as to expand the function of information. Lin et al. 8 realized the transformation between virtual reality and augmented reality through mental models to improve the usability of human-computer interaction. The above scholars have all explored the effectiveness of requirement acquisition through mental models, but this type of method usually studies on the static requirements between users and products, it does not take into account the dynamic changes of users’ requirements when using the product. Aiming at the acquisition of user dynamic needs, Chen and Li 9 proposed a generalized reliability Markov model to grasp the dynamic changes of user needs and guide the direction of product development. Wang et al. 10 proposed a dynamic analysis method of intuitionistic fuzzy numbers according to the variability of requirements. By balancing the subjective importance and objective importance of customers, the comprehensive dynamic importance of customer needs was given. Wang et al. 11 proposed a dynamic acquisition strategy of requirements by learning ontology thoughts. According to the uncertainty of design requirements, Yang and Li 12 put forward an analysis method of customer demand competition priority and sensitivity based on intuitionistic fuzzy sets and verified the feasibility of the method by taking the customer requirements analysis of software system as an example. At the same time, KANO model, QFD (Quality Function Deployment) model 13 and TRIZ method are also widely used in requirements acquisition and importance research. Among them, Li et al. 14 put forward a methodology of systematic literature review to analyze which dimensions of context have been used for better requirements elicitation and modeling in context-aware situations. Tang and Long 15 proposed a personalized requirement obtaining method based on KANO model, through the entropy method and the KANO model, requirements screening and weight ranking are used to meet the individual needs of users. Sun et al. 16 and others put forward a method of product index importance that combines the KANO model and QFD and established a mathematical model of satisfaction through requirements classification, constructed the importance of the house of quality to obtain the index. Hu et al. 17 used artificial immune algorithm to calculate the engineering parameters of the KANO model to obtain a design plan that meets customer needs.
Two important themes emerge from the studies discussed so far: requirement dynamic analysis and importance exploration analysis by blurring the information and integrating some models optimally, such as KANO, QFD, which are worth studying and learning from, but these methods do not take into account the user’s use scenario, but consider the user requirement acquisition from a single part, which has certain limitations and shortcomings. There is still relatively little research on the dynamics of requirement caused by changes in user scenarios. Scenarios are specific environments in which users use products, which can more directly respond to user motivation and demand changes, and the scenario decomposition helps designers understand the user’s mind and accurately perceive user empathy, so as to guide design development. However, it is not enough to consider scenarios only, because different users have different perceptions, even in the same scenario will generate different design requirements, and user requirements will change with the scenario. Therefore, in order to more accurately achieve dynamic user requirements capture, we need to cluster users, group similar types of users, make the differences between users smaller than the differences between various types of users, effectively reduce interference factors, and then analyze the similarity of requirements between users, so as to obtain the priority ranking of requirements.
Methodology
In view of the above researches and analysis, this paper proposes a dynamic requirement capture method for user usage scenarios. It is mainly divided into the following parts:
The first part is to construct user clusters and analyze the preliminary demands under dynamic scenarios. Firstly, considering the differences of users, we use questionnaires and in-depth interviews to screen the target users to form user clusters, decompose user behaviors with the help of the method of user experience map in service design, obtain the dynamic experience of users in different scenarios, and find out the design opportunity points to determine the initial requirements of the product.
The second part is to design the requirement path model and construct the requirement path matrix. Present the user’s cognition of demand elements by way of model tree, combine the pathfinder algorithm to construct the requirement path matrix of user clusters and transform it into distance vector.
In the third part, demand relevance is calculated and demand priority is derived. The cosine distance is used to calculate the path distance vector to derive the requirements relevance, so as to derive the requirements priority ranking and guide the design solution generation.
In the fourth part, user satisfaction is evaluated. The satisfaction of the product is verified through prototype testing, and the satisfaction ranking of the product elements is compared with the requirement priority, and if the correlation is high, the method is effective. If the correlation is low or contradictory, the requirement acquisition will be conducted again.
This method provides designers with a new path to obtain users’ dynamic requirements, which can obtain users’ requirements more accurately, effectively improve user experience satisfaction and bring new opportunities for product innovation. The overall research framework of user dynamic requirements acquisition is shown in Figure 1.

Research framework of user dynamic requirements acquisition.
Preliminary acquisition of dynamic requirement of user cluster
User scenario and user cluster construction
A scenario refers to the specific life picture formed by certain tasks and actions in a certain time and space or by the relationship between characters. Through scenario analysis, user behavior can be observed more intuitively and the dynamic needs of users are visually presented through user behavior feedback. Reduce the time of process design research, more objectively estimate user needs and improve the accuracy of product positioning.
User clustering is a way to subdivide user groups, 18 which combines users with similar characteristics into a set. Due to the cognitive biases among users, user cluster analysis can better utilize the similarity cognition 19 to obtain users’ requirements and preferences for different attributes of products, accurately position the functions and services of products, it will provide effective basis for improving user experience and product competitiveness. In this paper, a large amount of questionnaire data is collected to filter users with similar characteristic attributes and determine the scope of user clusters. Then, combining with offline depth interviews, the interactive relationship between users and products is deeply understood, the users who meet similar characteristic attributes and have a strong correlation with products to form user clusters. Such users have high similarities in the product’s use environment, use duration, use intensity, functional requirements and operational requirements. They also have similar perceptions of the needs and importance of new products. The user cluster construction framework is shown in Figure 2. A, B, C and a, b, c all indicate different types of users, where a, b, and c indicate users with a certain degree of relevance, such as in the same city, or at the same age stage. a1, a2, a3 indicate clusters of users with multi-dimensional similar attributes, such as a group of people who live in the same city, are of similar age, and have the same preferences and habits. Different colored circles indicate that users use a certain product in a relatively similar environment, length of use, intensity of use, and functional and operational needs. Different colored circles indicate that users’ usage environment, usage duration, usage intensity, as well as functional and operational requirements are relatively similar for a certain product.

User cluster construction framework.
Dynamic requirement scenario analysis
User interaction scenarios with the product change continuously over time, and during this dynamic process, the user’s needs also change. Using a cutting approach, just like editing in film and TV works, the usage scenarios are sliced and divided into different stages according to the user-product interaction and then disassembling the user’s interaction process at different stages. These subdivided scenarios contain user behavior, the objects touched, the user’s emotions, etc., which helps us capture dynamic needs through continuous segmentation. User experience map 20 is a method to visualize user behavior, which can decompose to arrange the user’s touch points with the product 21 and the corresponding emotional fluctuations in chronological order. Optimizing the user experience map, supplementing information such as scenarios as well as time periods, and then decomposing the touch points, behavior, pain point, and moods according to the whole process of users using the product, it is possible to obtain user pain points and design opportunity. The framework of user dynamic requirement scenario experience map is shown in Figure 3, where h1, h2, …, hn (n > 0, and n is an integer) represents the time period of user use scenario, s1, s2, …, sn (n > 0, and n is an integer) represent different scenarios of user use product, and t1, t2, …, tn (n > 0, and n is an integer) represent the touch points of the user interacting with the product in the scenario s1 in time period h1. The touch point can be a tangible object, such as a part of a product, or an intangible information, such as the interaction interface of the product. a1 is the behavioral action of the user in the current scenario, p1 is the user’s pain point in the process of use, but also the user’s unsatisfied needs, and according to p1, the opportunity point c1 for optimizing the product or service can be deduced. Moods are visualized through three different expressions, and connected with lines over time, which can correlate the user’s mood changes in a specific scene.

The framework of user dynamic requirement scenario experience map.
Preliminary acquisition of dynamic requirements
According to the user dynamic requirement scenario experience map, the obtained touch points and pain points can be classified and organized. Analyze and summarize the pain points in the process of users using the product, through flip the user pain points into the user’s desire, and get user requirement. The concept of ∼1 and −1 is used in the flip model, 22 and ∼1 is an innovative flip for user negative behavior, improving or mitigating complaints and finding acceptable solutions. −1 means finding a solution that completely eliminates user complaints or problems by simply flipping. The preliminary requirements can be deduced by combining the touch points with the pain points, and the product elements are corresponded to user needs. As shown in Table 1.
Preliminary acquisition of dynamic requirements.

Requirement path model construction and requirement correlation calculation
Pathfinder algorithm
The Pathfinder algorithm, 23 created by Schvaneveldt and originally developed in the field of cognitive and sociological modeling, transforms similarity rating matrices into pathfinder network graphs, which are widely used to estimate mental cognitive differences by semantic distances. Pathfinder network graphs link data entities with each other by links, each entity in the dataset is a node in the pathfinder network graph, and each link has a weight value that is expressed by the distance between pairs of data for both weights.24,25
Requirement correlation calculation
Build requirement path model tree
Based on the pathfinder network graph, the requirement path model tree is constructed by users’ cognitive evaluation of product elements, then the requirement path model tree is transformed into a distance matrix and distance vector, and the cosine similarity algorithm is used to calculate the correlation of the overall path and the correlation between each node, which can yield the cognitive similarity between different users and also understand the users’ priority ranking of the requirement-elements. In this regard, the requirement path model refers to the concepts of spanning tree and hierarchical analysis, and presents the main elements and sub-elements of the product in a hierarchical tree. The data within the nodes represent the different attributes of the product. For example, element f is located at the top, indicating the user’s perceived base goal. Elements g, k, and l are located at the main element level, indicating the elements required to achieve the base goal f. Level 1 sub-elements are located in the middle, indicating the elements required to achieve the main element, and so on. The lines between the nodes represent the weight values. Assuming that the weight between all attributes is 1, the effect of the requirement path model tree of the product is shown in Figure 4.

Requirement path model tree.
Transform the path search network matrix into a distance vector
Transforming the requirement path model into n × n path search network matrix, in which d12 and d13 represent the distance between two different elements, as shown in Table 2. By transforming the matrix into a distance vector, we can get:

n × n Path search network matrix.

Calculate the vector correlation
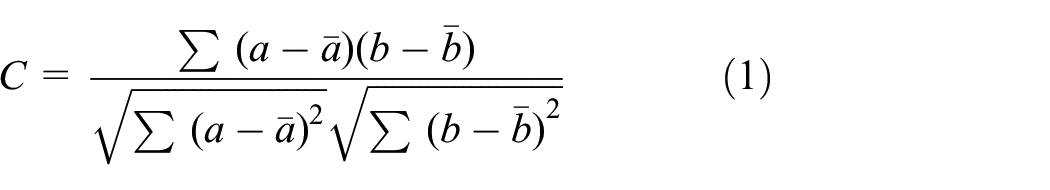
The cosine similarity calculation is to judge the similarity between two vectors by calculating the cosine of the angle between them. The calculated value ranges from [−1, 1]. If the cosine similarity value of two vectors is 1, it means that the two vectors have the same direction, showing a high degree of positive correlation. If the cosine phase velocity of the two vectors is −1, it means that the two vectors point in completely in opposite directions, showing a high degree of negative correlation. According to the judgment method of correlation grade, the requirement similarity grade in this paper is specified. If the range of the correlation value between two vectors is less than 0.4, it means low similarity, between 0.4 and 0.7, it means medium similarity and greater than 0.7 means high similarity.
The whole correlation degree C between matrix vectors T1 and T2 is calculated, and then the vectors T1 and T2 are substituted into cosine similarity formula (1), where a represents the elements in distance vector T1, b represents the elements in distance vector T2.
Application case analysis
Company M is an Internet innovation enterprise in Xiamen, focusing on sharing massage products and services and pioneered the concept of “people-oriented, making life more comfortable.” The massage service extended from fixed scenarios to shared massage seats in various scenarios, which obtained good market feedback in a short term. Recently, the company wants to expand the market and still adheres to the “people-oriented” concept, using office scenarios as the entry point, considering the intelligent upgrade of office chairs, solving current users’ pain points when using office chairs and improving their user experience. However, the design system of the office chair has been developed very well at present and we don’t know whether the needs of users under the office scenario have changed or not. So it is very difficult for corporate executives to decide how to innovate and develop products. Therefore, the company has decided to adopt the dynamic requirement capture method based on user scenarios proposed in this paper to obtain the requirement relevance of user clusters, and take the requirement similarity as the priority level to guide the generation of design schemes.
Preliminary capture of dynamic requirement of user cluster based on scenario
User cluster construction and dynamic requirement scenario analysis
The user’s satisfaction with the seat depends on the user’s environment, the characteristics of the seat and the user himself. 26 In this paper, by collecting 403 valid questionnaires and conducting statistical analysis of data, it is found that users who are dissatisfied with the current office seats are mainly white-collar workers in technology companies aged 26–39. Most of them have lunch break habits and usually choose to take a lunch break in the office chair. Although in this way they can get a moment of rest, but the overall user experience is poor. The results of the questionnaire show that users generally reflect that the office chair in the ergonomics of human and machine needs are met, while in the lunch break needs are not met.
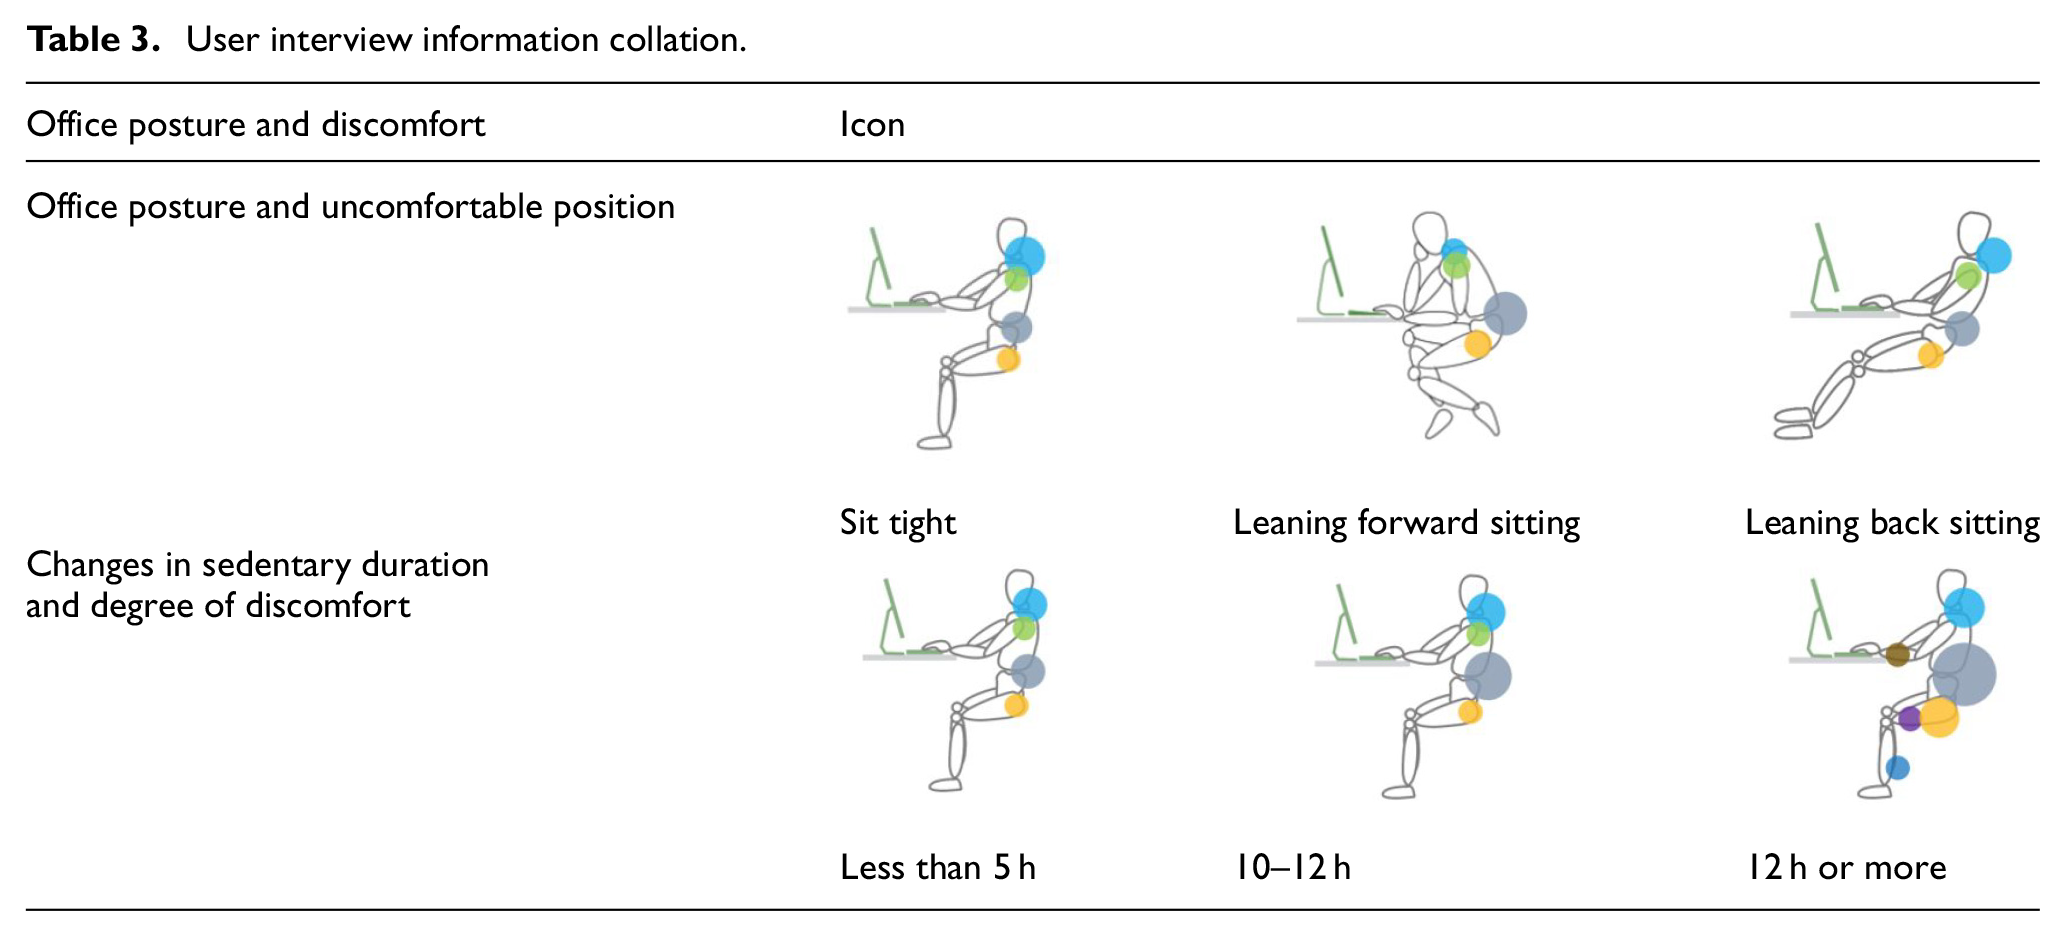
Through the questionnaire survey, the target population of the interview was initially targeted as office white-collar workers in technology companies. The work pace of science and technology companies is quite fast and the space is limited. At the same time, users need to work on the computer all day and the problem of sedentary is obvious. Studying the needs of this user cluster can provide key design information for innovative design of office chairs. Six technology-based companies were selected in this study and each company selected five typical users to form a user cluster. Users interviews were conducted at 11:30 am, 1:30 pm, and 4:30 pm, the purpose of it was to comprehend users’ experiences and needs for office chairs in different scenarios. According to the interviews, we found that their office postures mainly are sitting frontally, leaning forward and leaning backward, users experienced significant deterioration in comfort on the shoulders, waist, sacrum and thighs over time. Most users do not use other functions except seat height which may be due to the complexity of the seat control system and the contrary habits of users.27,28 User interview information is organized as shown in Table 3.
User interview information collation.
Preliminary acquisition of dynamic requirement
The user interview information is transformed into a scene-based user experience map, and the user touch points, behaviors, pain points and user emotions are visually presented, which is helpful for designers to understand the dynamic experience of users in the whole process of using the product, and analyzing users’ pain points can effectively capture the initial needs of users. The user experience map of the user using the office chair is shown in Figure 5(a) and (b).
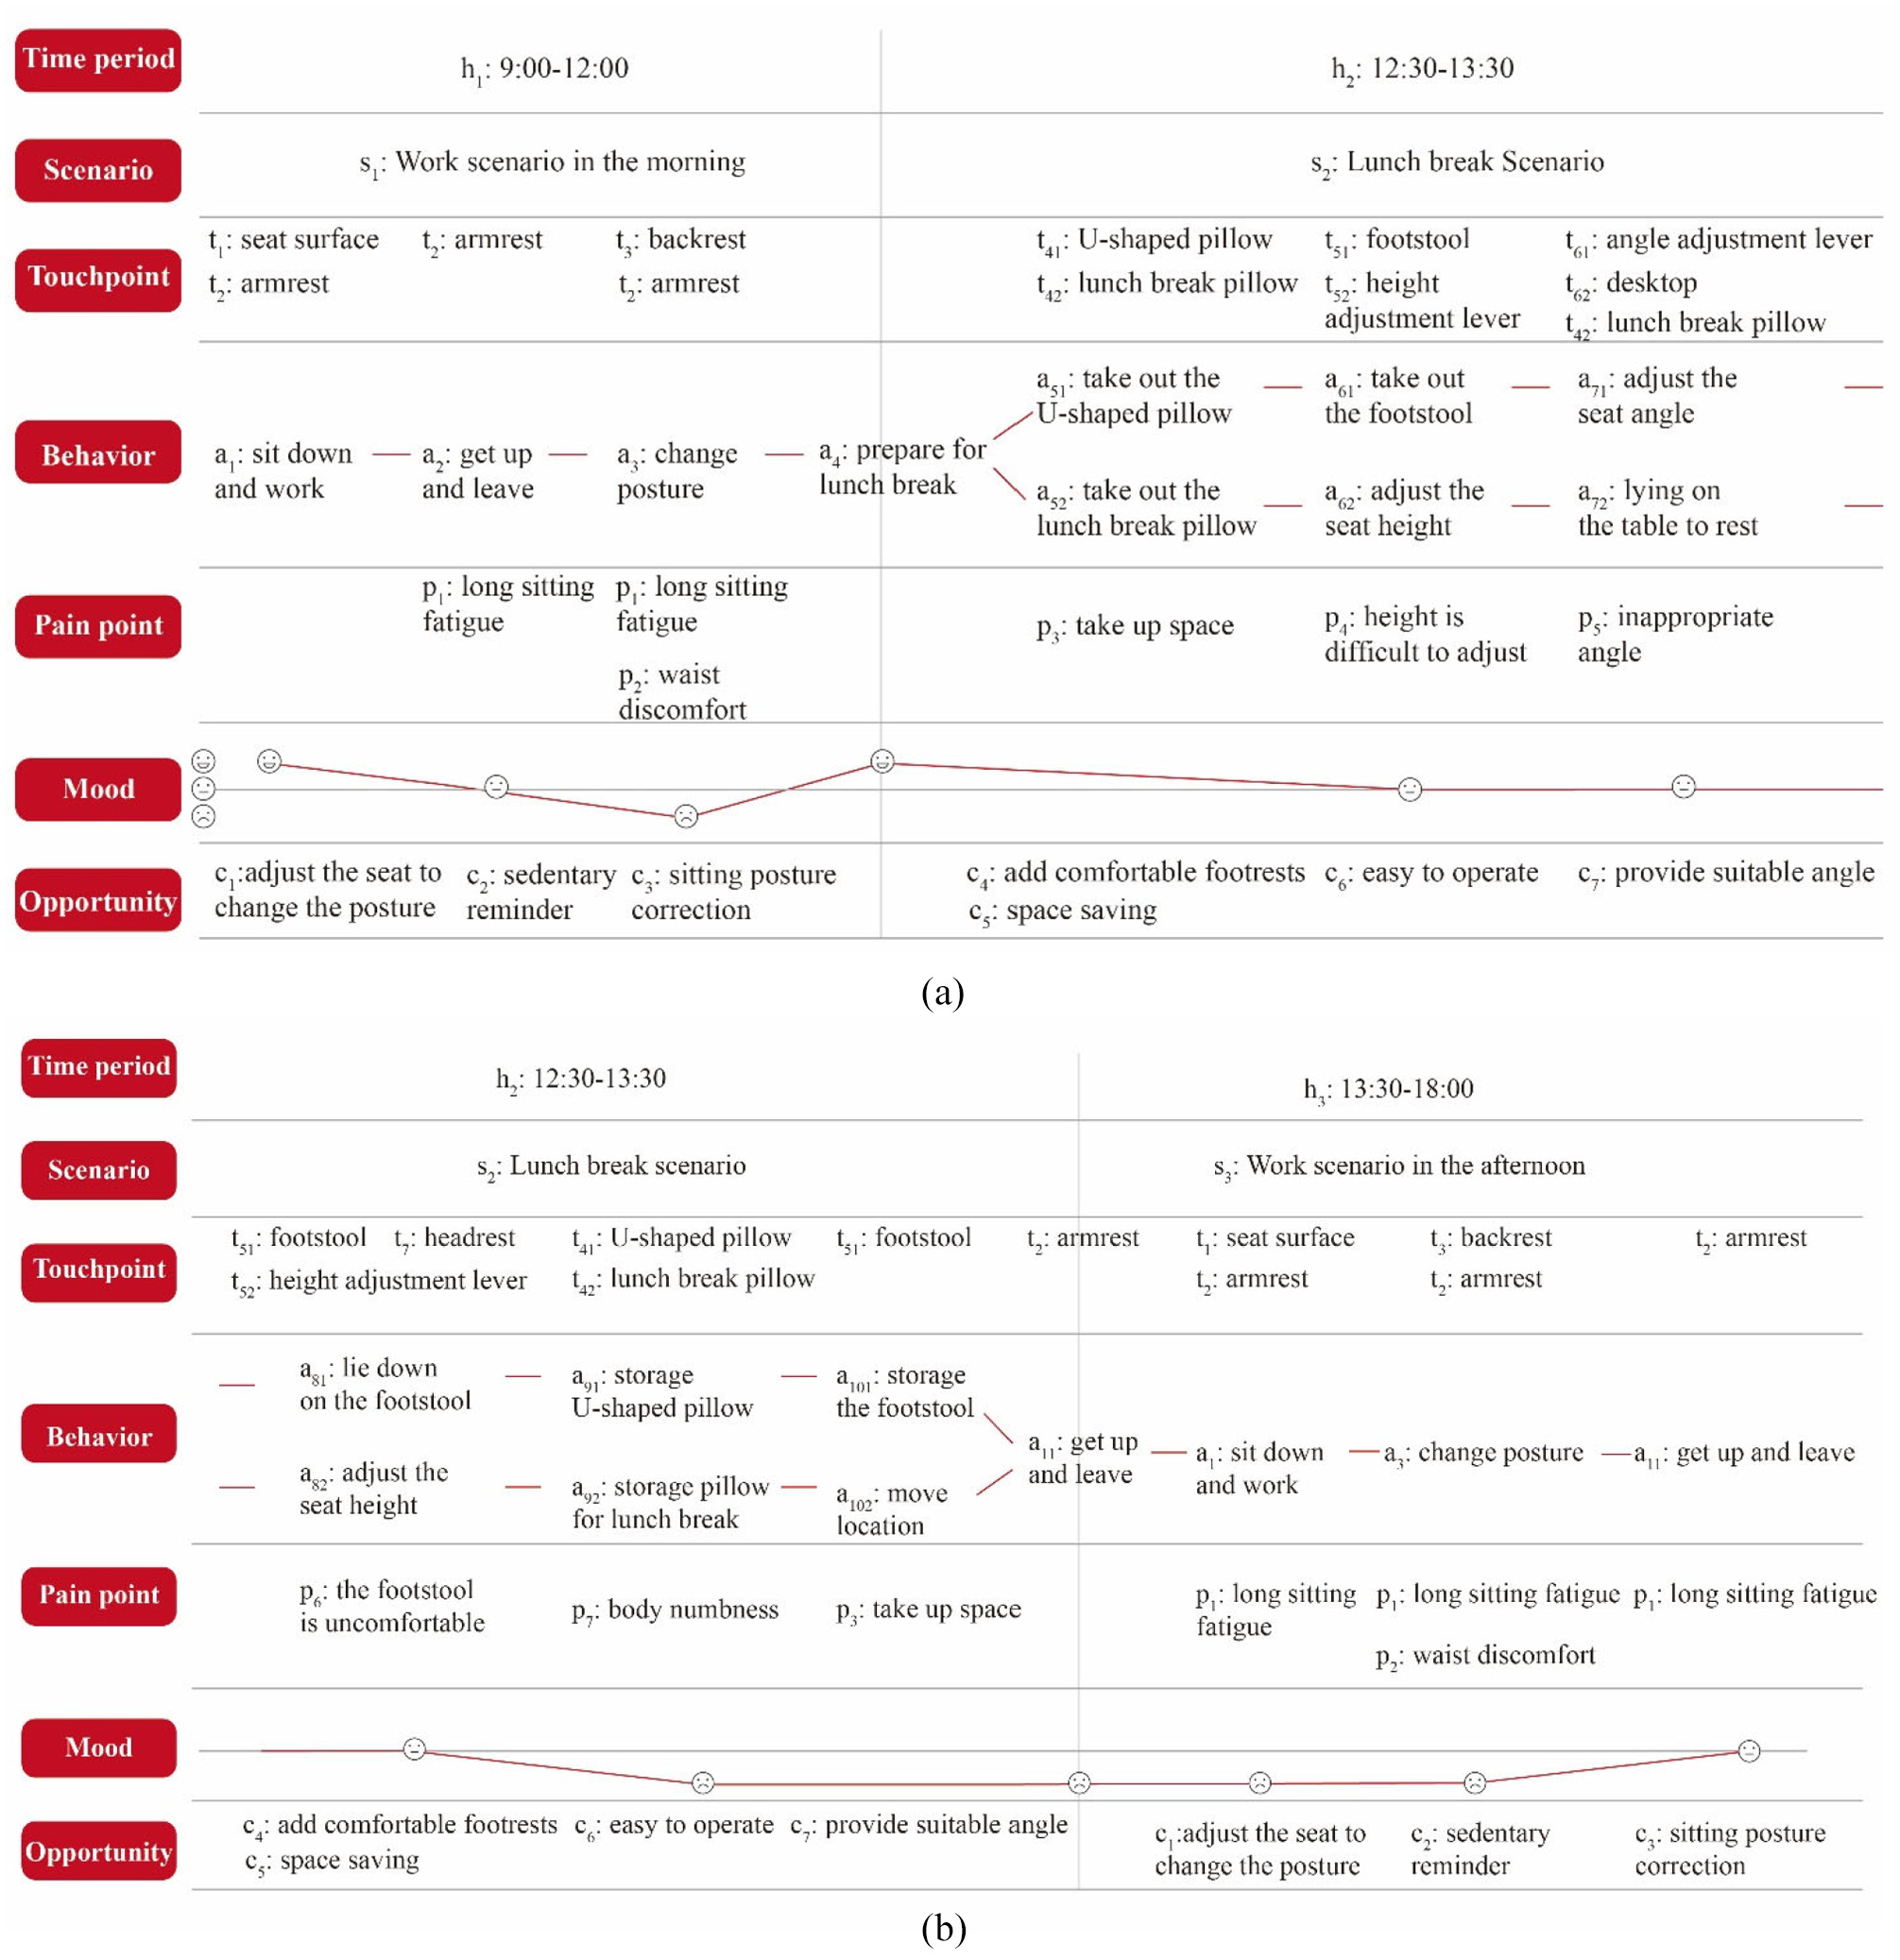
(a) User experience map of the user using the office chair and (b) user experience map of the user using the office chair.
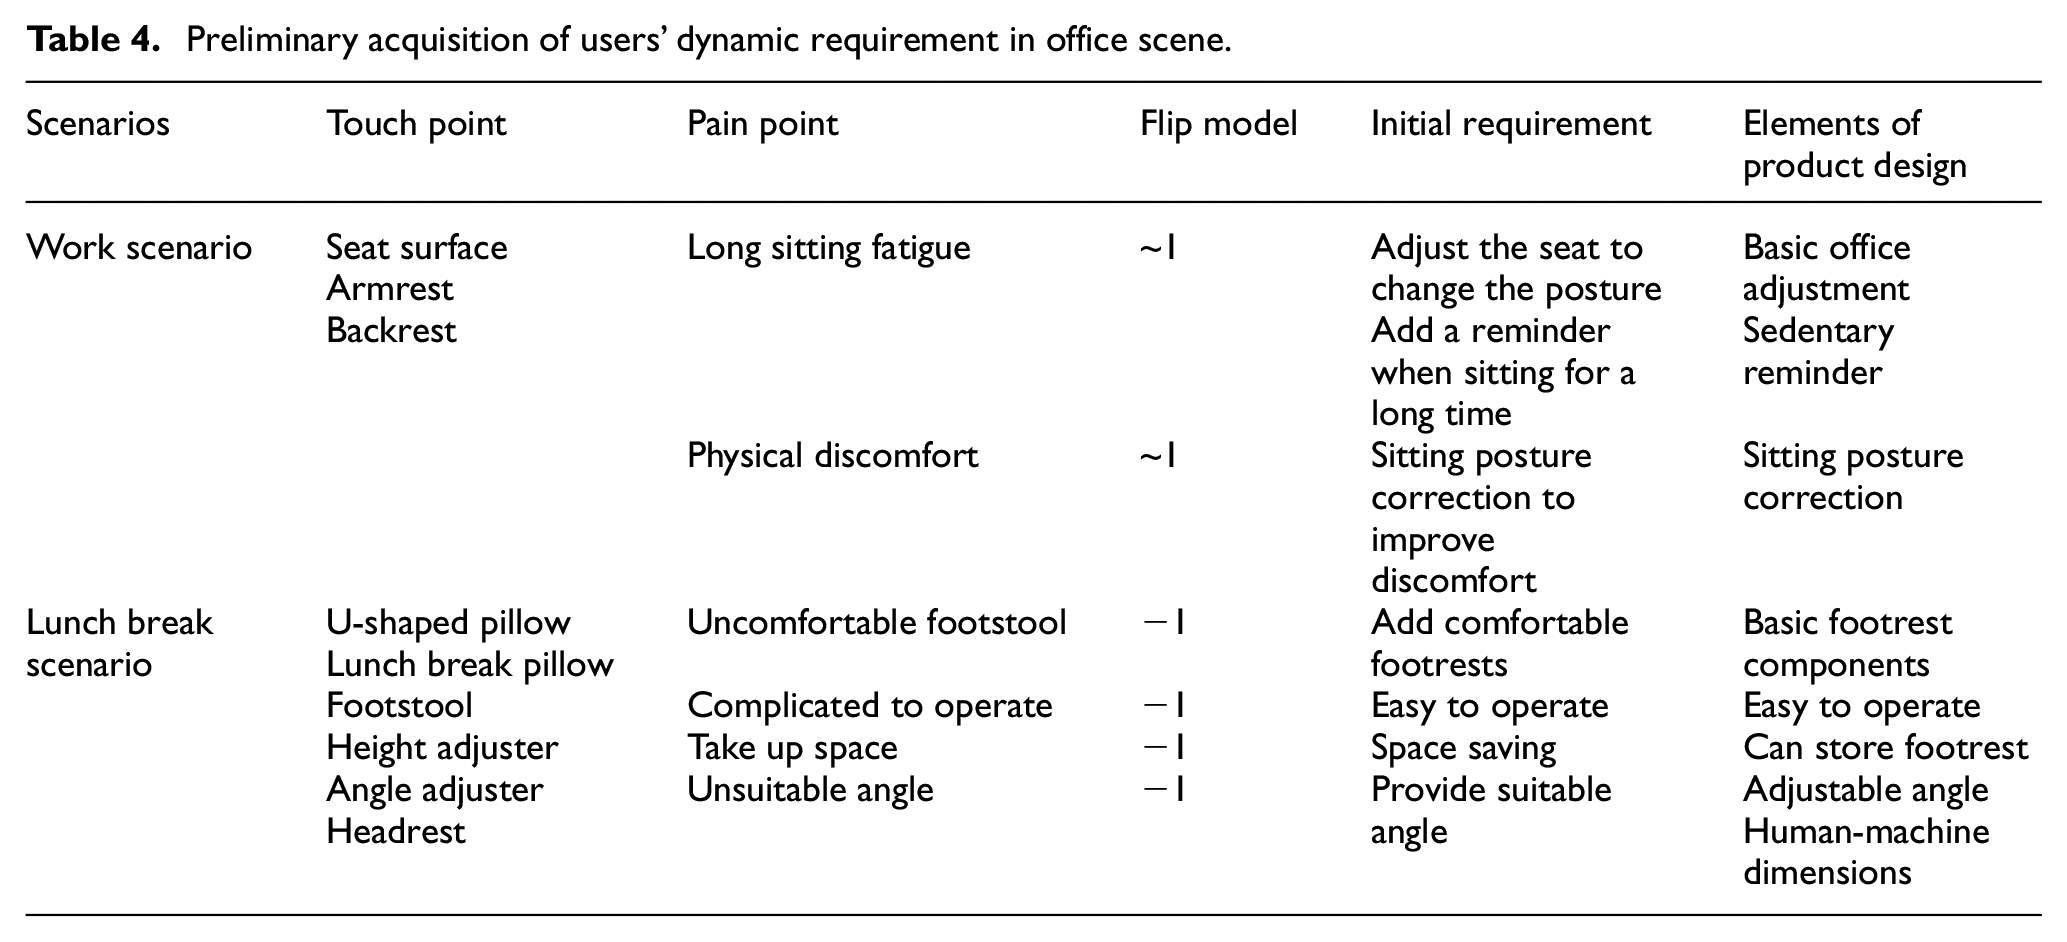
The users’ behavior changes under different scenarios and their emotions also fluctuate constantly, so does their requirements for seats. According to user interviews, the obvious changes are in office scenario and lunch break scenario. Under working conditions, users need to constantly adjust their postures to satisfy the comfort of sitting. However, sitting for a long time may easily cause physical discomfort, resulting in sub-health status. Setting a sedentary reminder can timely remind users to get up and do some exercises. If it is found that the user has been sitting incorrectly for a long time, it is also necessary to correct the user’s posture in time. In the state of lunch break, users need a seat that they can have lunch breaks, satisfying the needs of it is a key factor to improve user experience. The pain points in the user experience map are listed and reversed thinking through it, so as to obtain the initial needs of users, as shown in Table 4. The product design elements are stratified, as shown in Figure 6.
Preliminary acquisition of users’ dynamic requirement in office scene.

Product design elements layered.
Construction of office chair requirement path model and calculation of requirement correlation
User cluster requirement path model tree
Prioritize the design elements according to the cognitive feedback of users in the user cluster, Compare the requirement correlation between users in pairs and the correlation between each design element. Due to the limitation of space, only the data of user 1 and user 2 are listed in this paper for explanation. The requirement path model tree of user 1 and user 2 are shown in Figures 7 and 8, respectively.

Requirement path model tree of user 1.

Requirement path model tree of user 2.
Assuming that the users’ weight values for the requirements are both 1, the requirement path search network matrices for user 1 and user 2 can be obtained. As shown in Tables 5 and 6. Transforming the path search network matrix into distance vectors, the distance vector T1 = (1, 1, 2, 3, 2, 4, 3, 2, 1, 2, 1, 1, 3, 2, 3, 4, 3, 5, 4, 3, 2, 4, 3, 1, 1, 2, 2, 1, 3) for user 1 is obtained. The distance vector T2 = (1, 1, 1, 4, 2, 3, 3, 2, 2, 3, 1, 2, 2, 2, 5, 3, 4, 4, 5, 3, 4, 4, 2, 3, 2, 3, 1, 1, 1, 2) for user 2 is obtained. Substituting the distance vectors of user 1 and user 2 into equation (1), the overall correlation coefficient of T1 and T2 is calculated to be 0.71, indicating that the requirements of user 1 and user 2 show high similarity.
Path search network matrix of user 1.

Path search network matrix of user 2.

Calculation of requirement correlation degree
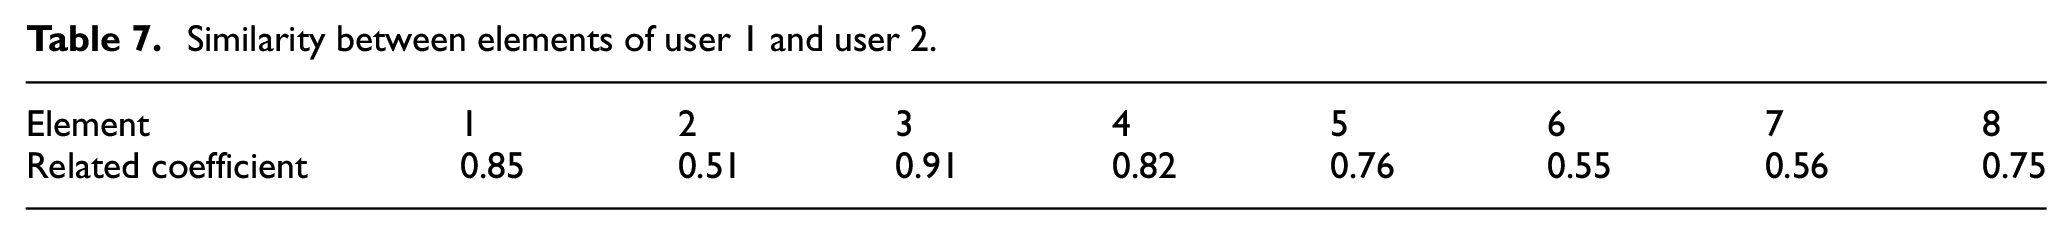
By calculating the relevancy between the design elements of user 1 and user 2, it can obtain that the design elements 1, 3, 4, 5, and 8 of user 1 and user 2 are of high similarity, while elements 2, 6, and 7 are of medium similarity. It indicates that the priority order of these two users in terms of design needs is: sitting posture correction > basic office adjustment > sedentary reminder > adjustable angle > easy to operate > human-machine size > storage footrest > basic footrest parts. As shown in Table 7.
Similarity between elements of user 1 and user 2.
Follow the same method, by comparing the overall relevancy of each user in the user cluster and the relevancy of each factor, the correlation coefficient of the overall user cluster is 0.72 and the similarity between each element is shown in Table 8. The priority order of user clusters in terms of design needs is: sitting posture correction > basic office adjustment > sedentary reminder > storage footrest > easy to operate > adjustable angle > human-machine size > basic footrest parts. It can be seen that for users, sitting posture correction and sedentary reminder are the problems of concern to users. It is related to their healthy working state of users, at the same time, meeting the basic office adjustment is also the necessary user needs when using the office chairs. Secondly, the user’s needs are to be provided with a storage footrest to meet the lunch break and simple angle adjustment operation, and the last is to meet the human-machine size needs. It also proves that most of the existing chairs in the market meet the ergonomic design requirements of users.
Similarity between elements of user cluster.

Design verification
According to the requirement priority order output by this method, designers developed a design scheme. To verify the effectiveness of this method, the design scheme was tested in prototype, 29 as shown in Figure 9. By inviting 30 users in the user cluster as test subjects, user testing can obtain user experience data and guide designers to better optimize products .User satisfaction reaches its peak when the experience turns to be pleasure and exceeds users’ expectations. 30 The process of prototype testing simulates the state of users at work, steps are as follows: prepare an office, provide standard desks and office supplies, provide an office chair prototype and fix the pressure cushion on the prototype to determine the pressure distribution of the user under different sitting positions. The test lasted for a total of 3 h, which are 2.5 h of office time and 0.5 h of lunch break. Before the test, the user cluster will start with simple product learning, and the designer will introduce the features and functions of this office chair. Secondly, the user will experience the comfort and operation mode of the office chair in person. When the user is in sedentary state or sitting incorrectly for a long time, the designer will actively remind him according to the time of pressure distribution and the change of pressure value. During the lunch break, record the user’s process of using the prototype through camera and conduct user interviews after completion. Through the KANO model used for user satisfaction testing, the requirements for attractive quality and one-dimensional quality are: sitting posture correction, sedentary reminder, adjustable angle, storage of the footstool, and easy operation as must-be quality. This office chair meets the priority of user requirements and has high user satisfaction. As shown in Table 9.

Prototype test of office chair prototype.
KANO requirement satisfaction evaluation form.

Discussion
From the perspective of user scenarios, we combine pathfinder algorithm to explore the problem of capturing and prioritizing dynamic requirements, and propose an innovative idea of cutting and decomposing scenarios. Using questionnaires and interviews to organize clusters of users with similar cognition and taking user clusters as research objects, the problem of requirement ambiguity due to user cognitive bias is reduced, which is more stable and accurate compared with traditional requirement analysis methods. The user experience map is used to decompose user scenarios horizontally in the time dimension and vertically in the experience dimension, providing intuitive feedback on the dynamic changes of users’ requirements in different scenarios, which is more fine-grained in capturing users’ requirements and reduces ambiguity of requirements compared with AHP, QFD and other methods. The evaluation and relevance ranking of the acquired requirements are also more in line with users’ perceptions and help designers improve user experience.
Conclusion
In this paper, a dynamic requirement capture and requirement prioritization method based on user scenario is proposed. Compared with the traditional requirement capture idea, this method emphasizes more on the dynamic requirement changes of users, and the visual presentation of dynamic requirements by scene decomposition is helpful for designers to find potential design opportunities. By forming user clusters and calculating the similarity of requirements among user clusters, we can more accurately determine user requirements preferences and thus provide guidance for improving the user experience solutions of products. In view of the ambiguity and dynamism of the current requirements, an effective exploration has been conducted, but since the weights between users and design elements are calculated according to one in the paper, without taking into account the business focus of enterprises and the weight preference value of users for products, the next work needs to further explore the acquisition of dynamic user requirements priority under non-equal weights to optimize the breadth and depth of the method.
Footnotes
Acknowledgements
The author would like to thank the mentor for his constructive comments and suggestions, which are very helpful in improving the quality of the paper.
Handling editor: James Baldwin
Declaration of conflicting interests
The author(s) declared no potential conflicts of interest with respect to the research, authorship, and/or publication of this article.
Funding
The author(s) disclosed receipt of the following financial support for the research, authorship, and/or publication of this article: The author would like to thank the subjects for their participation in the experimental study. This research was supported by Ministry of education of Humanities and Social Science project (14YJC760008), Doctoral research project of Shaanxi University of Science and Technology (BJ12-07). Shaanxi Province Innovation Capability Support Program Funded Project (2021PT-025) and Shaanxi University “Outstanding Youth” Talent Support Project.