
Abstract
User experience plays an indispensable role in intelligent product design. Building a system for user research, capturing firsthand information from users and turning insights into achievable product design solutions is the key to innovation. This article introduces service design into product design and studies the design cue construction method through intelligent product design case. First, the authors capture customer touchpoints in the process of user interaction with the product by observing the user behavior and perform the correlation analysis of the customer touchpoint to obtain the user’s complaints and dissatisfaction. Second, the authors use positive creation theory to transform requirements and turn the complaints collected in user research into achievable functional requirements. Third, the authors use the KANO model for sensitivity analysis of functional requirements and select high-sensitivity requirements for priority development. Finally, using the service design innovation methods to analyze the user experience and stakeholders, the design cue map can be exported, and a new service system was established to enhance the overall user experience.
Keywords
Introduction
T Alvin pointed out the importance of experience in the book The Third Wave. Merchants will win customers by creating more experience activities, and people will be attracted to a series of experience activities. 1 A product not only includes the end-users, but also includes provider of the product and recipient, they together constitute stakeholders. 2 The service of the product needs to meet the interests of the core stakeholders, so as to achieve the user experience of the entire business chain. There are many uncertain factors in the process of intelligent product design and development, 3 such as unclear design requirements, variable design goals, and unclear design problems, resulting in difficult product design, low efficiency, and poor system. In particular, user requirements are increasingly complicated, and sometimes users cannot describe the requirements themselves. It is difficult for designers to grasp the core needs of users, and design failures often result from deviations of design directions.
The customer touchpoint correlation method which was proposed based on the intelligent product design, through the insight into people’s behavioral actions and usage scenarios, outlines the user’s experience map in the process of using the product and subsequently obtains the user’s demand. The user-centered design and the overall experience in the product service should be emphasized. It can find more pain points and export new ideas by correlating customer touchpoints and designing the entire business chain 4 ; also the solution will comprehensively enhance the overall user experience.
Literature review
The user experience can add value to the enterprise or organization. Xu Haisheng emphasized the importance of the design strategy to enhance the value of the brand. By importing design strategies, the company’s design activities could be upgraded to a strategic level, thereby enhancing the brand value and competitive advantage of Chinese companies. 5 S Luo et al. 6 proposed an explicit design model for the hidden elements of the interface. The anthropological method was used to conduct user research and demand analysis to explore the interface design problem of the smart device, and the feasibility of the model was verified. DH Kim and H Lee 7 studied the impact of user experience on user resistance changes and found that user experience can guide platform leaders in designing user interfaces, user experiences, and marketing strategies.
Customers interact with products through digital touchpoints as well as physical touchpoints. It generated negative impact that user experience professionals only focus on the digital channel. FY Guo 8 proposes ways to re-integrate the touchpoints to support an effective customer experience ecosystem that drives revenues and customer loyalty. C Deng 9 proposed an approach to improve the whole service by analyzing touchpoints, finding design entry points, and emphasizing service innovation by transcending new touchpoints. S Clatworthy 10 described the development and use of a card-based toolkit in the area of touchpoint innovation; it suggests that touch-point is one of the methods used by designers to understand, explore, and develop innovative service solutions.
RH McKim 11 describes in detail in Experiences in Visual Thinking that the “Thinking” process is indispensable in manufacturing. This “Thinking” process re-examines the design and solve problems in the product design process through some innovative methods and emphasizes the importance of visualization. B Tim 12 in the book IDEO, Design Changes Everything tells numerous design methods, introduces the three spaces of design, from inspiration to conception and implementation. Therefore, it is crucial to clarify and visualize design issues in a visual form.
In terms of user research, it is necessary to deeply understand the user’s needs and expectations in order to obtain a sufficient user experience. W Wei et al. 13 presented a product requirement modeling method based on configuration design; the customer individual requirements can be satisfied according to the mapping rules of model. B Ferreira et al. 14 proposed to enhance the user experience through user portraits and empathy maps. Y Wang et al. 15 put forward a user requirements-oriented knowledge management concept, constructed a novel distributed concurrent and interactive user requirement database to support collaborative design knowledge management. Some scholars have investigated several design evaluation methods. W Li et al. 16 proposed a hybrid approach based on fuzzy analytic hierarchy process (AHP) and 2-tuple fuzzy linguistic method to evaluate in-flight service quality. AR Millard 17 developed a new service quality management instrument called TNE-Matrix, which used SERVQUAL model to measure perceived airline service quality from the passengers’ viewpoint.
However, there is little information available in the literatures about combining product design with service design; service design is mostly used in interface design or brand experience design. Identifying target users, understanding user needs, and turning requirements into design opportunities are essential elements for successful user experience research. The service design innovation methods can obtain the user’s actions through customer journey map and timely discover the user’s pain points and needs. We aim to apply customer touchpoint for service design in intelligent product development, through the study of user behavior for customer touchpoints correlation, and ultimately achieve an overall user experience improvement. This article reorganizes the service design methods and the innovative methods of design thinking and realizes the user experience research of intelligent product design in a more comprehensive way. In addition, KANO model has been applied to select product features and perform user satisfaction calculations, which effectively reduced the number of calculations.
Methodology
Touchpoint18–20 (also touch point, contact point, point of contact) is a business jargon for any encounter where customers and business engage to exchange information, provide service, or handle transactions. Touchpoints within the customer journey help define a lot of moments, both good and not-so-good. It can be defined as any way a consumer can interact with a business, whether it is person-to-person, through a website, an app or any form of communication. The customer touchpoint is the connection point that constitutes the user’s behavior and is also the experience point.
This framework is based on an extended analysis of the customer journey map in the service design. The framework consists of the problem and requirements; we obtain the problem through touchpoint correlation analysis, then use the positive creation theory to turn the problem into a requirement, and finally get the design cue map. First, we identify the effective customer touchpoints by understanding the user information. Second, by analyzing the user behavior to capture the customer touchpoints, we analyze the user’s use in different scenarios. Third, we construct the customer touchpoint matrix map and associate the possible customer touchpoints, finding the problems and complaints, flipping the user complaint into the requirements by positive creativity theory, exporting the user experience map to convert the requirements into new design opportunities,21,22 and finally, we can get the design cue map. Intelligent product design cue construction framework is shown in Figure 1.
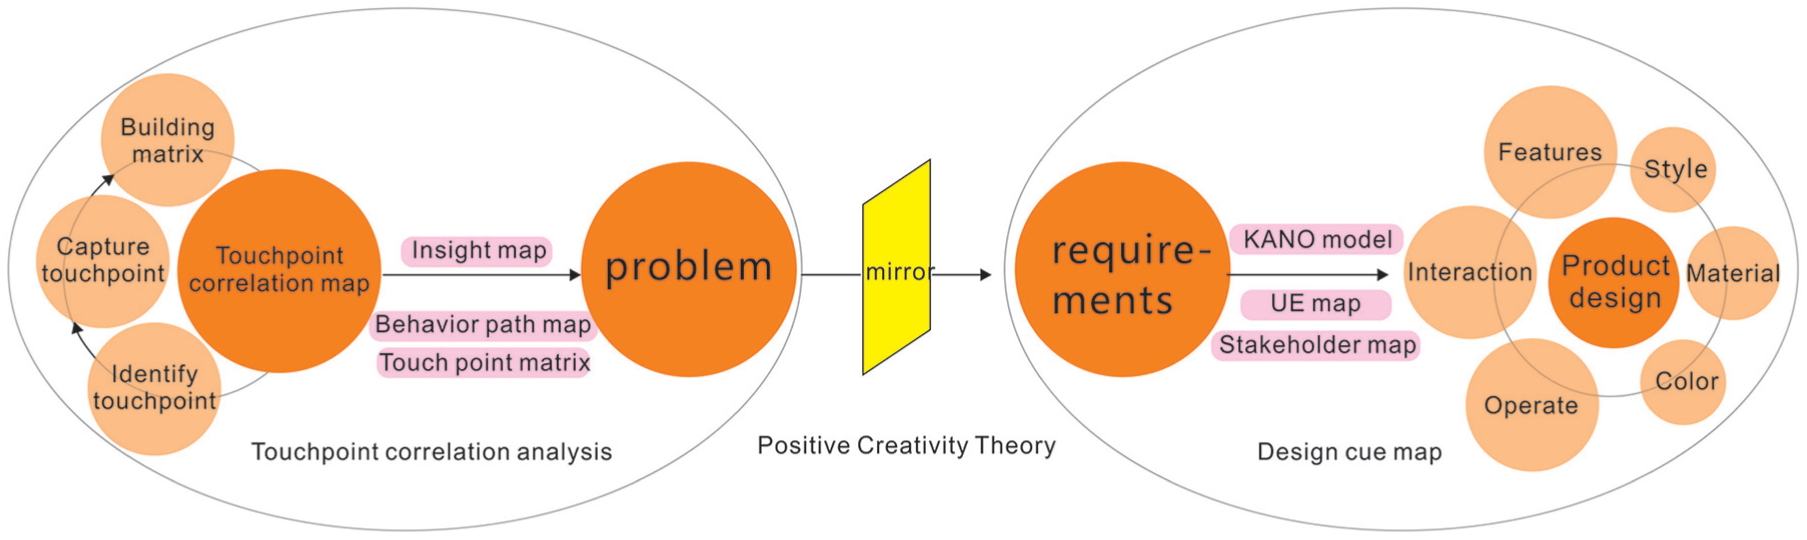
The framework of intelligent product design cue construction.
Positive creativity theory is proposed by Professor Lu Dingbang of National Cheng Kung University, which is a creative method that uses design rationality to directly create the future expectations and needs of users from the current situation. Analyze and summarize the complaints in the process of users using the product, through the desire flip model, flip the user complaint into the user’s desire, and get user demands. The concept of ∼1 and −1 is used in the flip model, and ∼1 is an innovative flip for user negative behavior, improving or mitigating complaints and finding acceptable solutions. −1 means finding a solution that completely eliminates user complaints or problems by simply flipping.
KANO model was created by Professor Noriaki Kano in 1984 while studying the contributing factors to customer satisfaction and customer loyalty.
23
It is a theory to improve the user satisfaction from a product or service by determining the function of the product, which is better than the general user satisfaction method. The KANO model classifies and prioritizes user requirements in the form of questionnaires and divides the service quality characteristics into five types: excitement quality, performance quality, basic quality, indifferent quality, and reverse quality24,25; the classification of the evaluation results is shown in Table 1. Through the KANO model, the satisfactory influence and unsatisfactory influence of each functional requirement are analyzed to judge the sensitivity of users on the variation of product functional requirements. The selection of more sensitive functions is also preferably developed, which is more conducive to improving user satisfaction. The professor classified customer requirements into five unique categories. The designers hope that 3 of them will end up in the offering and the other 2 should be taken out, as shown in Table 1. In Table 1,

The table of KANO model characteristics and assessment classification.

Research on customer touchpoint correlation
Identify customer touchpoints
The paper uses the smart home terminal product as a case to analyze the customer touchpoint correlation; in this way, the user’s home environment is the main using scenario of the product. The identification of customer touchpoints is mainly achieved by the user empathy map. The empathy map can classify the user’s life information intuitively and clearly. Through the analysis of the user’s basic information, designers can understand what the user wants to get and the point where the user feels pain, that is, the contradiction point.
Capturing customer touchpoints
Simulate the user’s life, observe the user’s behavior, and capture key actions. Two designers are responsible for observing and recording the user’s life. We choose cameras and video recorders to assist in observation. Based on a smart home terminal product, we have locked the user into a young person with strong ability to accept new things. In the case, a single white-collar woman was selected as a typical user for research. Draw user insight map with a full-day as the horizontal axis and the time, location, touchpoint as the vertical axis. 26 Using the whiteboard to visualize the acquired information and tagging the same information in the same color are favorable to help designers view the information list and get valid information quickly, as shown in Figure 2.

User activity insight map from return home to leave home.
According to the results of the whiteboard analysis, the main living area is connected according to the daily behavior path, and the time spent by the user in each active area is displayed. The range circle of user behavior is used to indicate the time the user stays in the area. If the circle is larger, it means the time is longer. It is obvious that the most common activity areas of the user in the family can be judged. In this case, except for sleep time, the user’s main active area is the living room, followed by the kitchen, as shown in Figure 3.

User behavior range circle and path map.
Building a customer touchpoint matrix
Based on the user behavior path, we need to predict the events that the user might have in each activity scenarios in order to discover the user’s behavioral purpose and design opportunities, as shown in Figure 4. Through the analysis of the usage scenario, it can be known that in any case, there may be a visitor event, and the user needs to frequently use the customer touchpoints of the access control, the peep hole, and the door handle to reach the door opening and closing activities. Designers can discover design requirements by observing the user’s events in all scenarios, analyze possible problems, and then summarize them into a single table, as shown in Table 2.

Events and customer touchpoints analysis for different scenarios.
Problems in different scenarios.

The user’s main activity is the horizontal axis, and the scene is the vertical axis for the scene customer touchpoint matrix 27 construction, as shown in Figure 5. Customer touchpoint matrix built from user activities and scenes can visually represent the user’s experience. It can be seen from Figure 5, the porch is where the user must start and end all activities in the family, as well as the activity centers that connect the interior and exterior. The porch is therefore the contact center for the user to control the home. It is also the best place to install a smart home terminal. At present, the home products on the porch have access control indoor units, while the traditional access control indoor unit is only responsible for the switch of the building access control, and are fixed on the wall and cannot be moved, thus bringing a lot of inconvenience to the user.
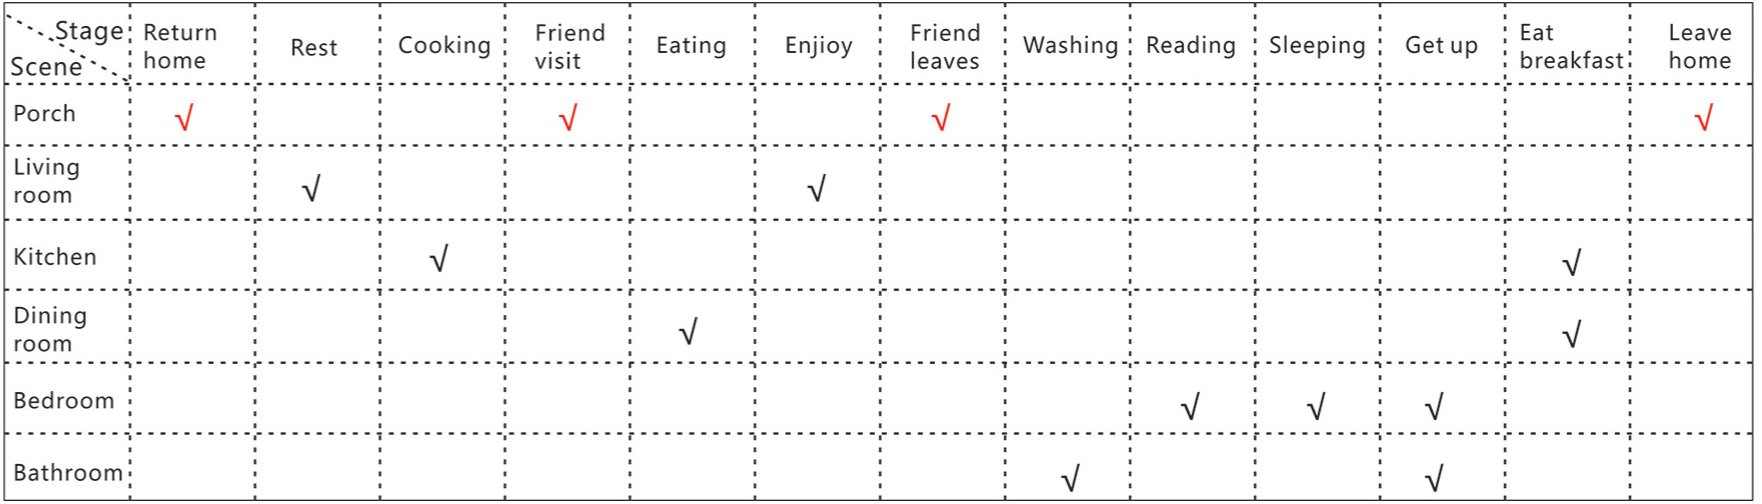
Customer touchpoints matrix built from user activities and scenes.
Simulating the situation when the user is at home and not at home, the smart home terminal gives the user a good experience to predict the behavior that the user may take, let the product understand the user’s life, and be familiar with the user’s preferences. The situation simulates the user’s process of going home from work to eating with friends and predicts all behaviors of the user. The authors create user experience map based on visual information from scenario simulations and describe in the diagram some of the feature points associated with all customer touchpoints from the beginning of the situation to the end. The user activity is decomposed into multiple subtasks, each column starts from a scene, describes the user’s thoughts and pain points, as well as the emotional experience map when the task occurs, and finally summarizes the product function requirements, as shown in Figure 6.
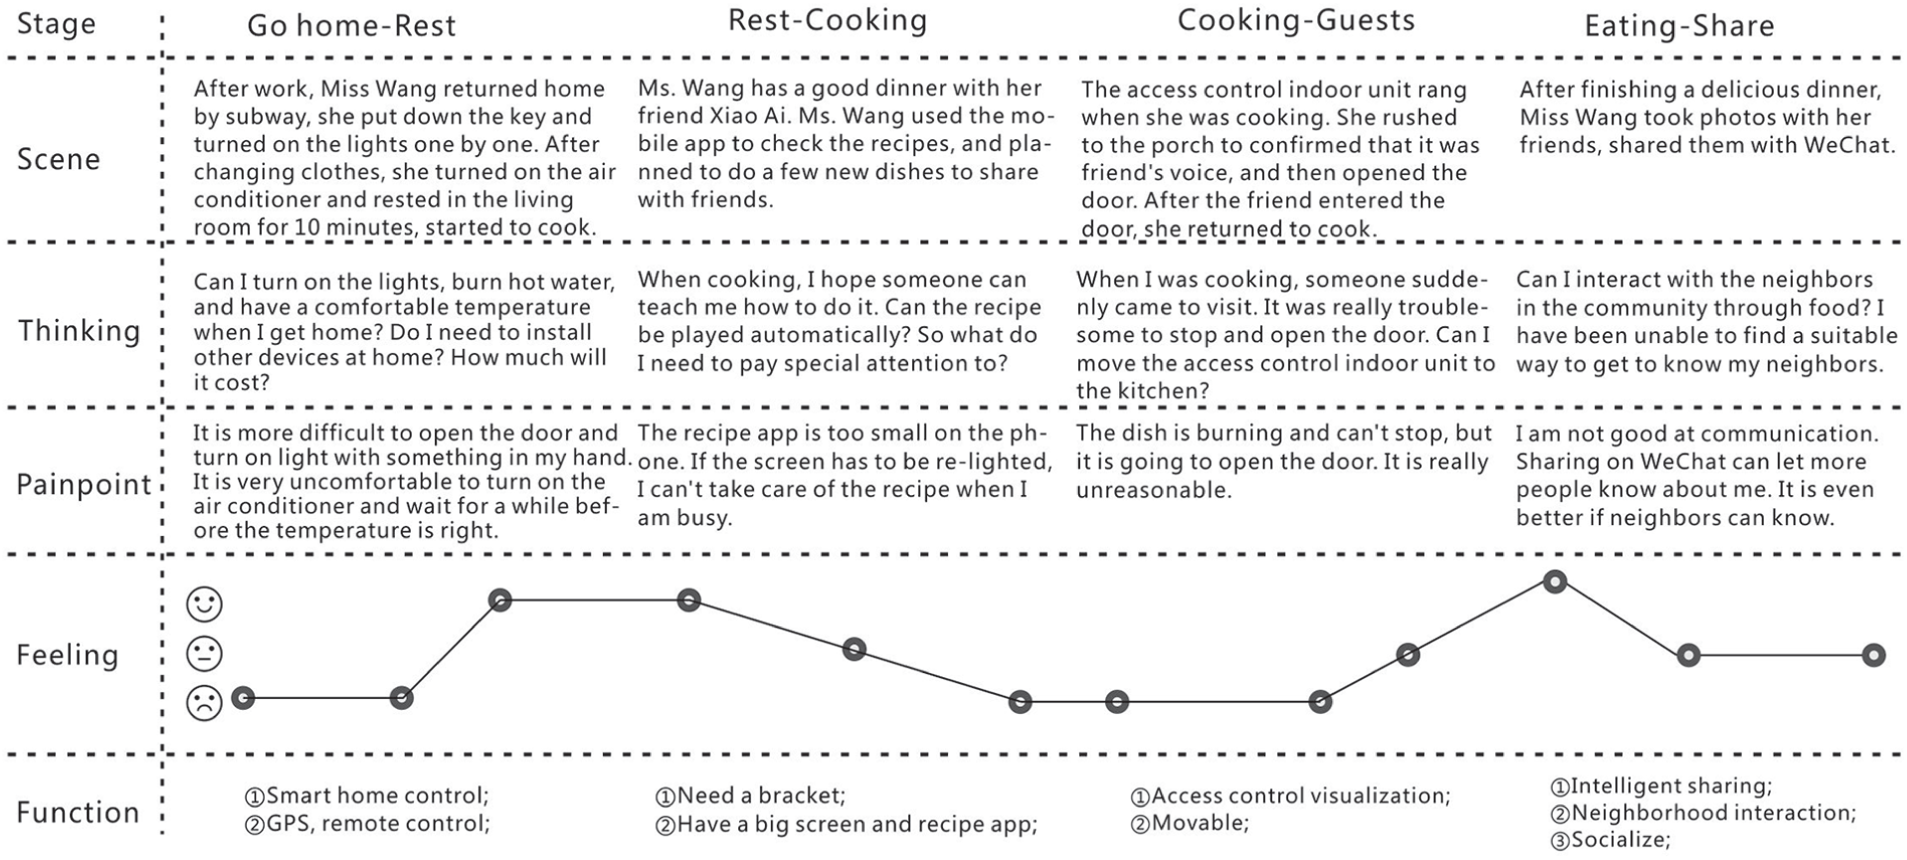
User experience map based on customer touchpoints correlation.
Functional demand transformation
A focus group of five people was set up for the project, consisting of a manager, a marketing director, two designers, and a design director. As the decision maker of the project, the manager can grasp the design direction and make timely decisions. The marketing director can consider the market development and stakeholder relationship of the project. The design director is responsible for the progress of the project and the quality control. The two designers are responsible for observing and documenting customer touchpoints and turning them into design requirements. The focus group members made bold assumptions about the user’s pain points, discussed the problems obtained from the previous behavior analysis, and used the desire flip model to classify the problems into 17 requirements, as shown in Table 3. We select functional requirements and sort them to get a list of achievable requirements, as shown in Table 4.
Functional demand of desire flip model.

Functional requirements classification table.

A questionnaire is designed to address both positive and negative issues for each requirement, such as “How do you feel if the product gets this feature” and “How would you feel if the product does not have this feature?” Establish a matrix of questions and provide five assessment criteria for each question, including like, should be so, does not matter, can endure and dislike. The study has collected 18 questionnaires; the goal is to include enough users to perceive differences with statistical confidence. The number of users required to accomplish this goal depends on the diversity of the people included in the study.
The authors distribute and collect valid questionnaires and analyze the survey data by EXCEL and statistical methods. An evaluation matrix is established through KANO model analysis to identify customer needs. Through the data obtained from the questionnaire, the frequency of occurrence of each demand can be calculated, as shown in Table 5. According to the KANO model, the indifference attribute, the reverse attribute, and the suspicious result are eliminated, and the remaining attractive attributes include the functional requirements b, c, d, e, f, i, and k. The expected attributes include the functional requirements a, g, j.
Classification of product functional requirements based on KANO model analysis.

Through the KANO model, the satisfactory influence and unsatisfactory influence of each functional requirement are analyzed to judge the sensitivity of the user to changes in product functional requirements. It is conducive to the selection of more sensitive functions to prioritize development and is more conducive to improving user satisfaction. Sensitivity matrices are built through data calculations, quality prototypes for product functional requirements are analyzed, and the sensitivity of each functional requirement is identified. The sensitivity matrix is established by taking all the functional requirements as the abscissa with satisfactory influence and unsatisfactory influence as the ordinate. Satisfaction influence is also called as the better coefficient, which is generally positive and means that this function can improve user satisfaction. The dissatisfaction influence, also known as the worse coefficient, is generally negative, indicating that the satisfaction of the user who does not provide this function will be reduced. The arc is drawn with the radius of the OP as the radius, as shown in Figure 7. The farther away from the origin, the greater the sensitivity is. It can be determined that the functional requirements a, b, d, e, j, g are more sensitive and are key elements. Demand f, c and demand l are in the arc, so the sensitivity is small, and development can be ignored first.

SI and DSI sensitive map.
Product touchpoint analysis
As a control terminal for the user’s home, the smart home terminal should fully consider the way the user interacts with the product. According to the correlation analysis of the customer touchpoints, the interaction mode of the product 28 is simulated.
Take the kitchen scene as an example, to simulate the process of cooking, customer touchpoints are walk into the kitchen, put down the screen, function selection, cooking, accident, end of cooking. The user removes the home smart terminal host, takes it to the kitchen, and places the host on the base. By touching the button to select the recipe function, it can assist the user to cook by voice broadcast. If an accident occurs, you can press the emergency call button to automatically open the door and ask for help. When the alarm went off, you can continue cooking and return the device to the porch, as shown in Figure 8.
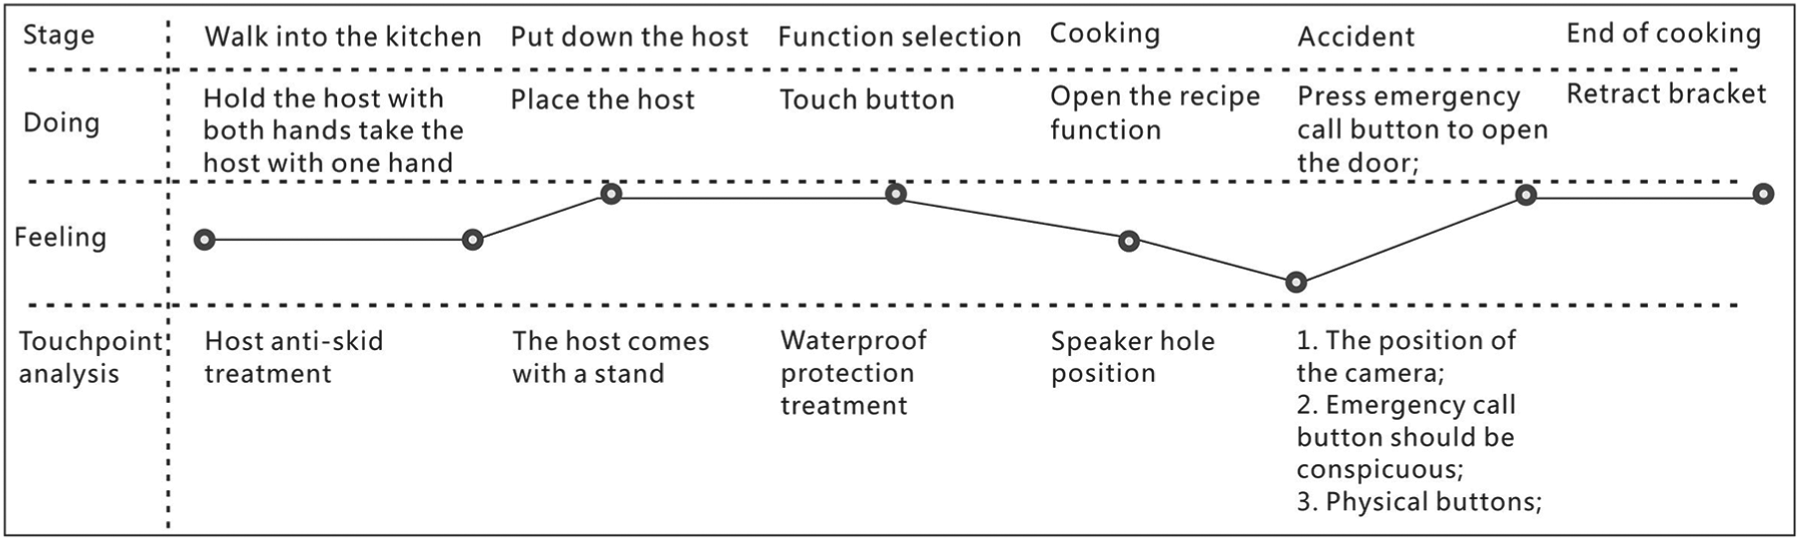
Customer touchpoints analysis in kitchen use scene.
Stakeholder analysis
Because the smart home terminal is based on the background of the smart community, it connects the interests of user, property managers, and real estate agents. Real estate agents, property managers, and installers, functionalized as service providers, provide users with a smart home terminal product with a good experience through analysis of the correlation of customer touchpoints. In the process of using the product, communication between users is performed through the correlation of customer touchpoints, and then the users can provide feedback and experience to the property manager. These stakeholders form a map of interpersonal customer touchpoints through mutual interest, as shown in Figure 9.
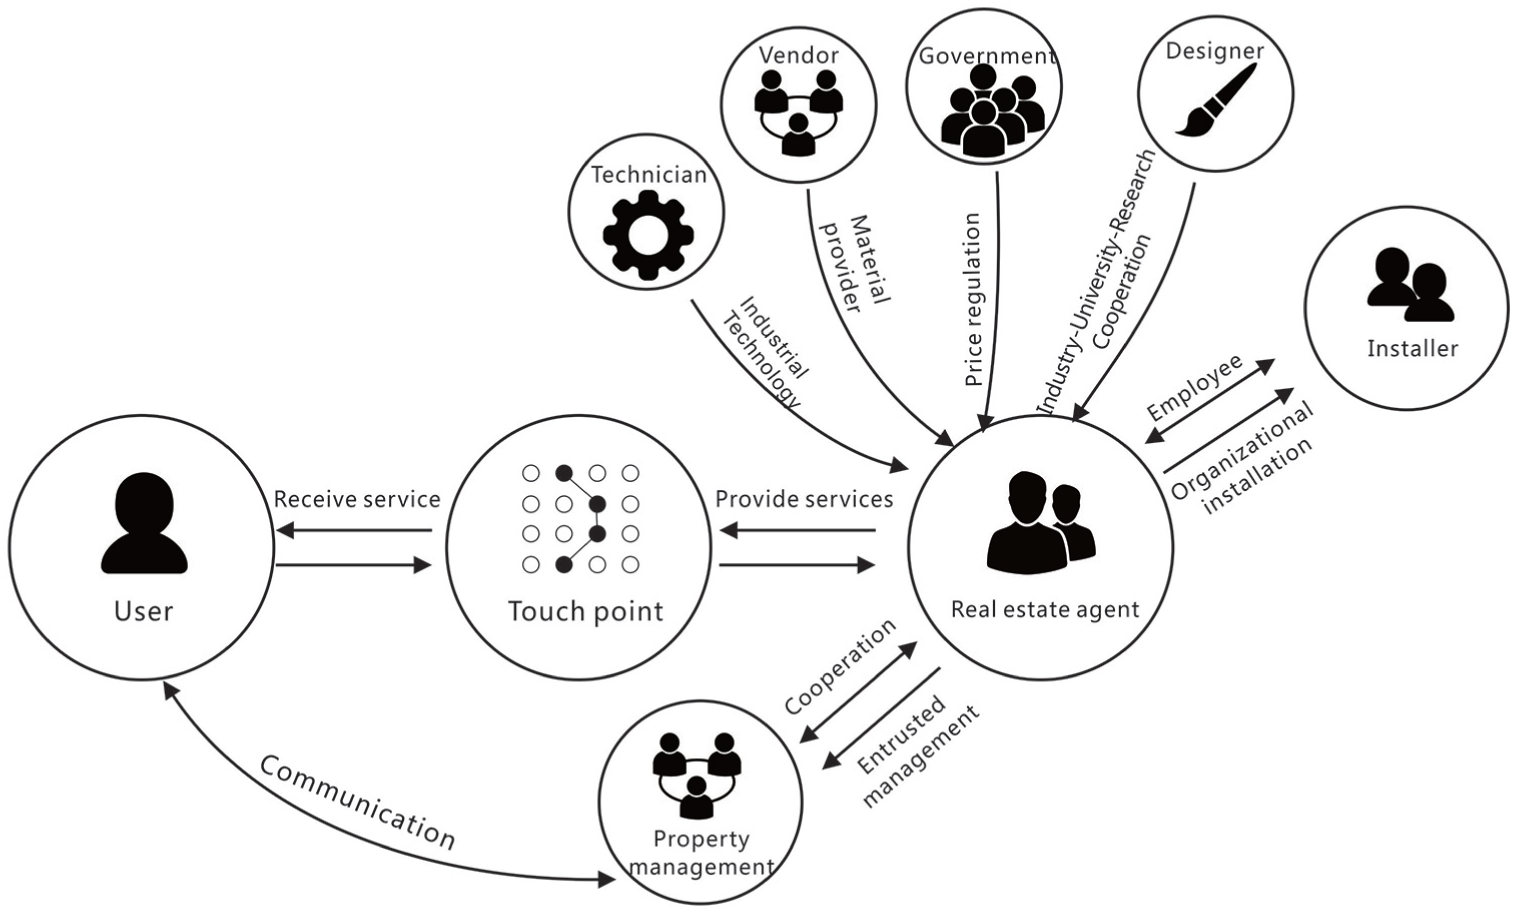
Stakeholder map of smart home terminal.
Design cue map
Design cues are some kind of contextual and directional information that guides the entire process of design, user, and design communication. 29 Based on the above analysis, the final design cue map can be obtained, which includes the style of the product, color, material and finishing (CMF), features, interaction, and operation. Among them, the features of the product are derived from the analysis of the KANO model, and the interaction and operation are derived from service design analysis, as shown in Figure 10.

Design cue map for smart home terminal.
Conclusion
A customer touchpoint correlation model is proposed by the authors, which effectively connects users and products through customer touchpoints, user behavior habits, and discovers design opportunities. It solves the crucial problem related to difficulty in positioning and low efficiency in the traditional product design process, and thereby effectively transforms the demand, grasps the core needs of users, and improves the user experience of the entire product.
Through the KANO model, the functional requirements of the smart home terminal are transformed, the opposite problems are designed to conduct a questionnaire survey, and the functional requirements of the products are prioritized to determine the product functions for further improving the overall user experience.
Footnotes
Acknowledgements
The author would like to thank the mentor for his constructive comments and suggestions, which are very helpful in improving the quality of the paper. The author is also grateful to the editors and participating managers.
Handling Editor: Shengfeng Qin
Declaration of conflicting interests
The author(s) declared no potential conflicts of interest with respect to the research, authorship, and/or publication of this article.
Funding
The author(s) disclosed receipt of the following financial support for the research, authorship, and/or publication of this article: The author would like to thank the subjects for their participation in the experimental study. This research was supported by Ministry of Education of Humanities and Social Science project (14YJC760008) and Doctoral research project of Shaanxi University of Science and Technology (BJ12-07).