
Abstract
The paper presents results of investigations of compressive strength and shrinkage of concrete samples made on the basis of the Portland cement CEM I 32.5R, after 2, 7, 14, 28, 90, and 365 days of maturation in four different maturation conditions. It was shown that after 28 days the samples cured according to the standard in the cuvettes with water achieved the highest compressive strength, although the early-age compressive strengths after 7 and 14 days were lower than those for the samples cured in building film and in dry conditions. A determined correlation between the compressive strength and shrinkage of the concrete proves that wet curing also allows a total elimination of the shrinkage in the first 28 days. Along with the growth of the compressive strength, the drying shrinkage reduces. Obtained results confirmed that the best way of concrete curing, among the analyzed methods, from the point of view of both compressive strength and volume changes is the wet curing.
Introduction
To achieve good and quality concrete, the characteristic compressive strength must be reached. The compressive strength of a concrete mix is a major index of its quality.1,2 Neville and Brooks 3 proved that the strength of concrete increases with time due to improved degree of hydration. Thus, a suitable curing method should be applied, especially at the early stage of hardening.
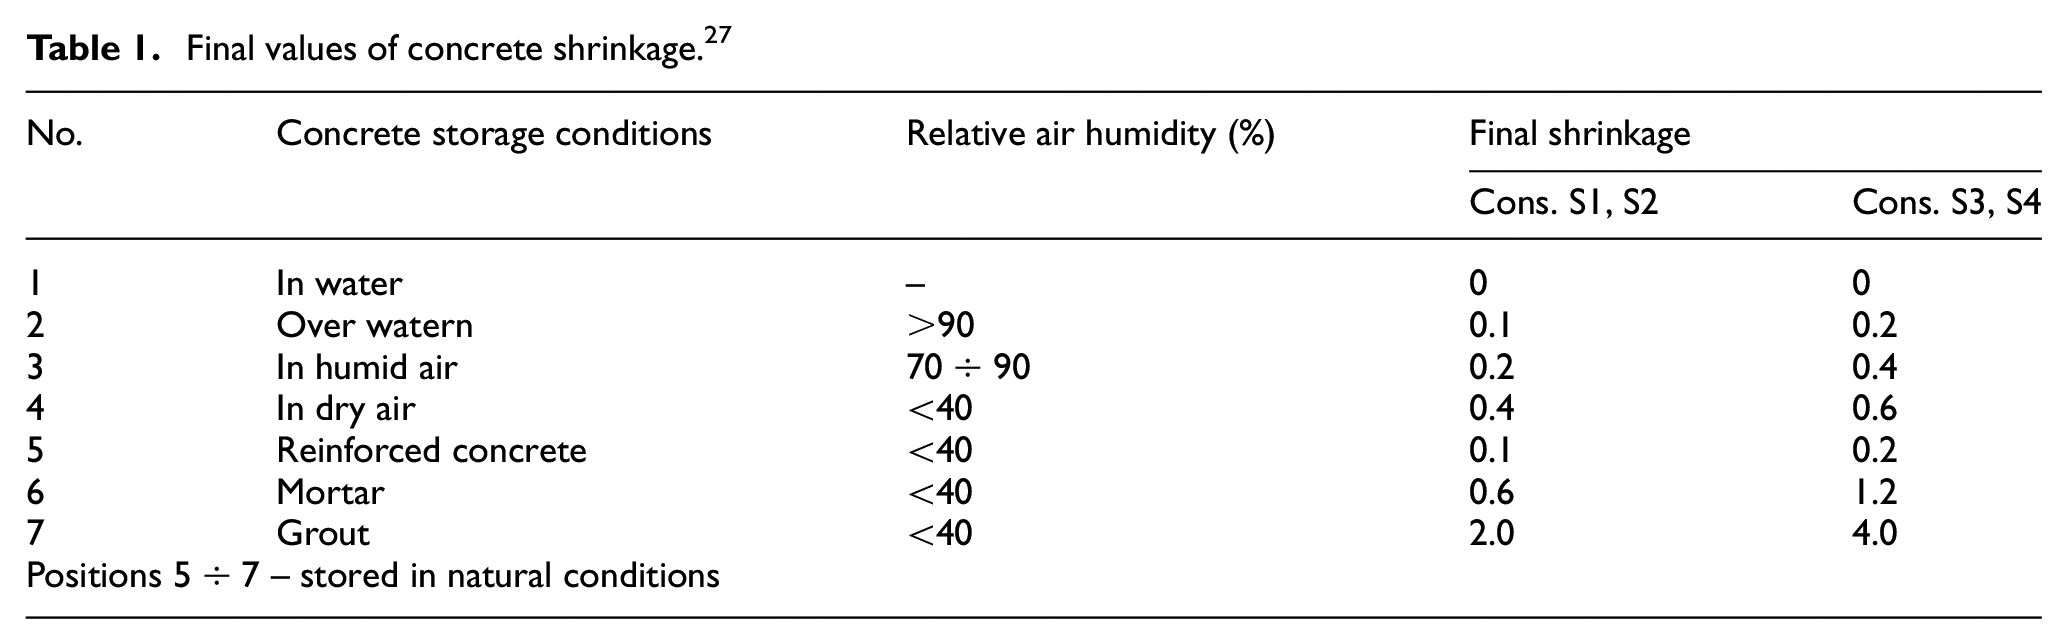
Concrete as a building material deforms not only under external loads but also as a result of spontaneous rheologic deformations not connected to mechanical loads. This phenomenon is described by a general term “shrinkage” and it is evoked structural changes occurring in a cement grout of a concrete mix as a result of physical and chemical processes of water loss due to binding, hardening, maturing, and drying of the concrete. It means that volumetric changes in the concrete are the outcome of changes evoked by various reasons connected both to an internal structure of the concrete, physical, and chemical processes occurring there (autogenous shrinkage and swelling) and influence of external environment (shrinkage and swelling evoked by changes in humidity and/or temperature, carbonation shrinkage). Concretes with denser consistency, cured for a longer time as well as containing less cement grout are less prone to a final shrinkage (cf. Table 1). In aim to reduce the final drying shrinkage, it has to be ensured in an earlier period of maturation that the concrete is cured in proper humidity conditions.4,5 Various methods of curing includes immersion in water, 6 sprinkling, 7 wet coverings, 8 plastic sheet covering, 9 open air curing, 10 and curing with use of chemical admixtures 11 or internal curing with use of natural fibers.12,13 Many researchers have studied the effect of curing conditions on the strength development and shrinkage of ordinary concrete, 14 high-performance concrete,15–17 lightweight concrete, 18 self-compacting concrete,19,20 concrete containing supplementary cementitious materials as silica fume,21,22 fly ash, 23 geopolymers,24,25 clay, fly ash-clay, or shale ceramsite. 26
Final values of concrete shrinkage. 27
The actual concrete curing starts in the moment of compaction – maintaining ambient relative humidity over 90% limits shrinkage deformations to a large extent. Due to shrinkage limitation, it is recommended to maintain the wet curing within 7 days for stocky elements as well as within 14 days for flat and spacious elements. Duration of wet curing can also depends on type of cement. Ozer and Ozkul 28 proved that poor curing conditions have a more adverse impact on the compressive strength of concretes made based on pozzolanic cement than that of Portland cement, and it is necessary to apply water curing at least for the initial 7 days to expose the pozzolanic activity. Other factors affecting the process and size of the shrinkage, apart of environmental conditions and proper curing, are also worth mentioning17,29–31:
W/C ratio,
quantity of cement groat,
type of the cement used,
type and quantity of the aggregate,
designed concrete class,
age of a concrete,
ambient humidity and temperature,
dimensions of an element,
limitation of shrinkage possibility, for example, by reinforcement, friction with a ground, clamping on the ends.
However, the resulting shrinkage deformations of the concrete are usually proportional, in general, to the water loss rate.32–34
Due to reactions between cement and water, pores reduce their volume what is often referred to as a chemical (spontaneous, internal, structural) shrinkage. 35 The magnitude of volume changes in this phase is affected mainly by a mineral composition of the cement because, for example, in a hydration process of the Portland cement, the products of reactions occurring between the minerals contained in the cement occupy a lower volume than substrates taking part in this reaction 36 If there is no access for water in this time (no standard curing), the chemical shrinkage will be accompanied by a shrinkage connected to a so-called self-dehumidification of the concrete. Water required to continue the already begun hydration process is being “absorbed” from resources of internal (intercrystalline) water – pores in the cement grout are then being successively emptied. The higher the hydration water shortage, the higher the self-dehumidification shrinkage share in the volume changes. 37 The risk of the autogenous shrinkage (chemical and connected to the self-dehumidification) concerns mainly concretes with low W/C ratio and with high content of pozzolanic materials and some superplasticizers.
For example, Mazloom et al. 38 conducted research on total, autogenous, and drying shrinkage in high-performance concretes with silica addition. The obtained results confirmed that the silica fume had no significant effect on the total shrinkage. On the other hand, it was confirmed that silica significantly influenced the contraction of closed pores. Addition of silica fume in the range of 10%–15% increased the autogenous shrinkage by 33% and 50%. The content of various dosages of silica fume (SF) in concrete was also the subject of research by Shen et al. 21 They estimated the degree of cracking resistance of young high strength concrete (HSC) concrete with SF addition and their impact on thermal processes, autogenous shrinkage, restrained stress, and creep. The analysis indicated that, when the SF dosage in the HSC increased the cracking resistance of HSC decreased at early age and the autogenous shrinkage increased. Zhang et al. 39 also compared autogenous shrinkage of concrete based on Portland cement and silica fume concrete. It turned out that both the W/C ratio and the addition of SF had a significant effect on the autogenous shrinkage strain. The autogenous shrinkage increased with decreasing W/C ratio and increasing with silica content.
The autogenous shrinkage develops very rapidly (especially in high temperatures) and occurs when the cement grout is fresh and its mechanical properties are poorly developed. 15 It leads mainly to developing scratches in the concrete and then to reductions in strength and durability.40,41 The autogenous shrinkage is not a reversible phenomenon. Second type of shrinkage is a drying shrinkage. Its main developing mechanism, like in the case of the autogenous shrinkage, is a process evoked by the self-dehumidification but it occurs at a wider scale. It results from water evaporation from the concrete surface and it depends on environmental conditions (temperature, humidity) in which the concrete is. Contrary to the autogenous shrinkage, the drying shrinkage is a partly reversible phenomenon because if water is re-supplied to the concrete, it minimizes harmful changes which already have occurred. Thus, the proper concrete curing in early maturation period ensures reduction of the final drying shrinkage. 32
One can also distinguish a carbonation shrinkage which results from developing calcium carbonate (CaCO3) and unbound water (H2O) which are products of a reaction between calcium hydroxide (Ca(OH)2), calcium-silicate-hydrate (C-S-H) gel and carbon dioxide (CO2). The evaporating water evokes shrinkage but, due to the presence of CaCO3, the concrete carbonation process goes slowly and the shrinkage evoked by it is weak and concerns subsurface layers of a concrete element. As a result of the carbonation shrinkage, microscratches can develop or the concrete durability can reduce. 42 Next type of shrinkage is a plastic shrinkage which occurs before the concrete hardening. It is caused by an excessive velocity of water evaporation from a concrete surface and lack of possibility to supplement this water. If the quantity of evaporating water is higher than that being supplied to the concrete surface, then plastic shrinkage cracks can occur, usually in form of parallel scratches having significant depth. 43
Limiting shrinkage have a practical importance in the concrete industry as it helps to reduce scratches and cracks. Volumetric changes in the concrete is not only the shrinkage but also swelling. In an initial phase of maturation (several first hours), the concrete is usually subjected to a short-time autogenous swelling resulting from hydration heat release leading to thermal expansion of components. On the other hand, the concretes cured or exploited under water are subjected to a humidity swelling. 44 Contrary to the changes evoked by the shrinkage, the swelling does not cause scratches and in the case of hydration occurring in a humid environment it can lead to sealing the structure and growth of the concrete strength.
It is the shrinkage, however, which is one of less desired features of the concrete, significantly affecting development of deformation of construction elements, for example, size reduction, shape changes, buckling or cracks, hence evoking reduction of the concrete durability. Knowledge of the magnitude and timeline of the shrinkage is a base in planning, development, and curing of concrete elements and constructions. 45
The aforementioned facts are the reasons for which this paper focuses mainly on experimental determination how various curing conditions, excluding the use of chemical compounds, affect volumetric changes of samples made of an ordinary concrete on the basis of the Portland cement, what a correlation between volumetric changes and compressive strength is and whether any of the analyzed curing methods significantly mitigation or elimination of shrinkage scratches. The autogenous shrinkage stops very quickly and evokes small volumetric changes if compared to the drying shrinkage, being still in progress; therefore the this investigations neglect the influence of the analyzed factors on the autogenous shrinkage which is very well recognized in the literature, not only in ordinary concretes but also in high performance and light concretes.32,46–48
Taking into account the willingness to propose a simple method of determining the relationship between the drying shrinkage and the compressive strength depending on the curing conditions, the volume changes of the samples were determined with the use of the Amsler method. 49 The choice of such an approach contributes to the fact that the obtained results will be easy to interpret.
Materials and realized research methods
Concrete mix composition
The concrete mix was prepared on the basis of the Portland cement CEM I 32.5R manufactured in the Ożarów S.A. cement plant. The cement CEM I 32.5R, according to Ref, 50 is characterized by a moderate hydration heat, moderate dynamics of increase of early-age strength, wide scope of application, and moderate dynamics of cooperation with chemical admixtures for concretes and mortars. Average values of physical and chemical features of this cement, according to the manufacturer’s data, are presented and compared to the standard requirements in Table 2.
Physical and chemical features of the cement CEM I 32.5R. 50

In aim to make a concrete mix, it was assumed the concrete strength class C20/25 and exposition class XC1. The components were chosen so that to achieve the wet consistency of the concrete mix, that is, the consistency class S1 according to the concrete slump test,51,52 and to prevent so-called bleeding, that is, occurrence of water on the surface of samples evoked by a separation of concrete components. In aim to make the concrete mix, a coarse-grained, natural aggregate with maximum diameter of grains Dmax = 16 mm was used. The obtained grading curve for the aggregate lies between the limit curves (Figure 1).

Upper and lower limit curves of grain size and graining curve of the aggregate.
The superplasticizer CHRYSO®Optima 185 was added to the mix as well and its quantity was equal to 1% of the cement mass. This admixture reduces quantity of water and is manufactured on the basis of modified polycarboxylates and phosphonates. It elongates a duration of a given consistency and supports a good workability of the mix without delay in binding. 53 The components from the mix recipe were mixed in a mechanical concrete mixer. It was added sand and gravel, then a half of water, then cement. The admixture was added to the remaining half of water and this solution was gradually poured to the mix until a homogeneous mass was obtained.
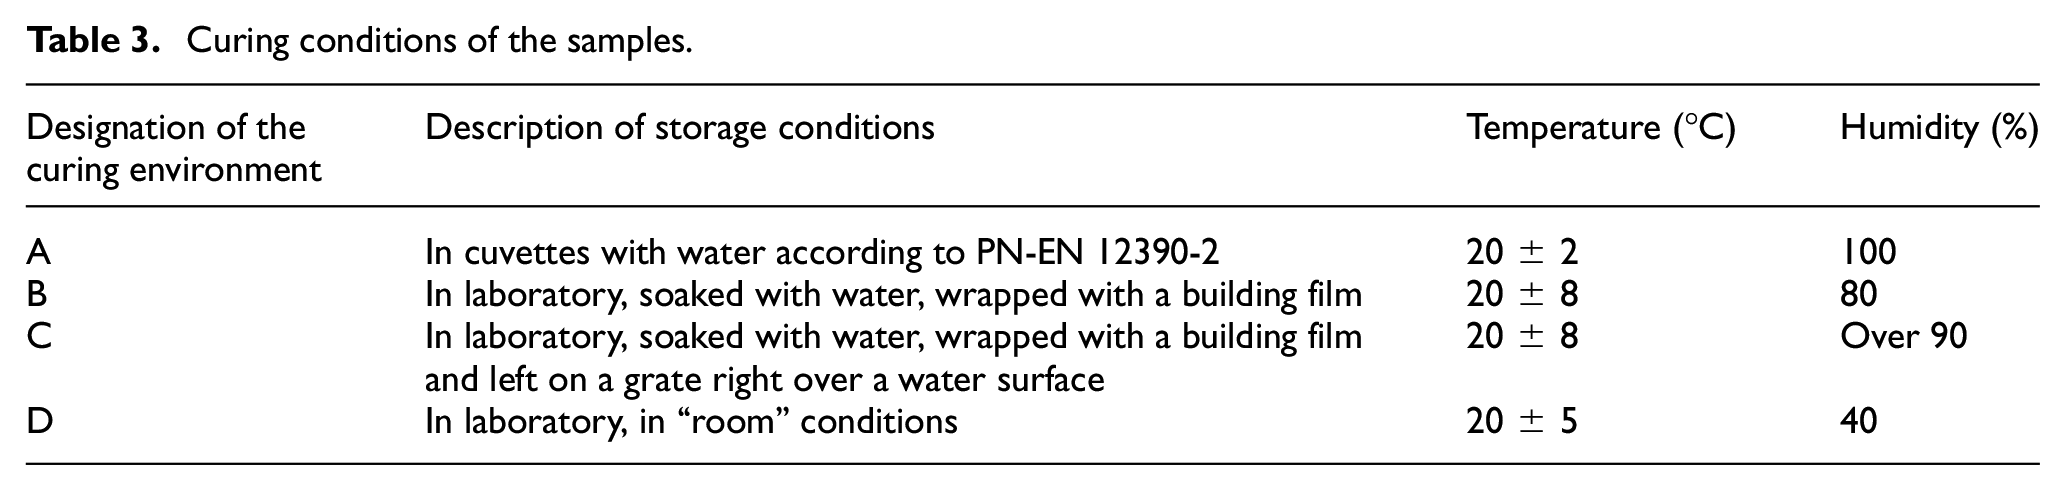
Conditions of concrete curing
The concrete samples to be tested were prepared in steel molds with dimensions 100 mm × 100 mm × 100 mm (for compressive strength tests) and 100 mm × 100 mm × 500 mm (for shrinkage tests). After molding and compaction, the samples were stored 24 ± 4 h in the laboratory in temperature 20 ± 2°C and humidity ca. 50% under building film. Then, the samples were demolded and placed in the assumed curing environment. Following curing conditions were assumed: the samples are stored in cuvettes with water (A), soaked with water, wrapped with a building film, and left in the laboratory (B), soaked, wrapped with a building film and left on a grate over a water surface (C), left in dry, “room” conditions in the laboratory (D). The curing conditions of the samples are presented in Table 3.
Curing conditions of the samples.
Determination of concrete compressive strength
The compressive strength tests were performed according to the standard 54 after 28 days of curing. According to this standard, in aim to determine a strength increase/decrease within the concrete maturation and exploitation periods, early-age strength tests after 2 and 7 days from manufacturing the samples and beyond the standard period, that is, after 14, 90, and 365 days, were performed as well.
Investigations of the maximum destroying force which can be withstood by an individual sample were performed in the MATEST testing machine by loading the samples with a constant load velocity 0.6 MPa/s. The strength of an individual sample was determined according to the formula:

where:

F– maximum force withstood by the sample (kN),
Ac– cross-section area of the cubic sample (mm2).
After each trial, a destruction type (destruction cone development) was determined in aim to confirm the test validity because any improper destruction negatively affects the correctness of the tests. Three measurement trials were performed in each test series.
Determination of shrinkage of the concrete samples
A shrinkage magnitude was determined with use of the Amsler method according to the standard PN-84/B-06714/23. 49 The Amsler apparatus, presented in Figure 2(a), is equipped with a micrometer screw, measuring with accuracy of 0.01 mm. The screw required for measurements is axially mounted on a shorter side of the frame, whereas on the opposite side an axially mounted pin is placed which stabilizes the sample. The apparatus has a 500 mm long measurement standard, used to calibrate the apparatus before each measurement. This standard is made of a stainless steel core in a wooden housing. Figure 2(b) presents steel molds in which the samples were molded. Each mold, on its ends, has plates with openings; through each opening passes a bolt on which a threaded conical pin − a measurement ending − is screwed. When concrete is pouring into the mold, the bolts are cast-in – after demolding they leave in the samples and the conical pins constitute reference points for the measurements.
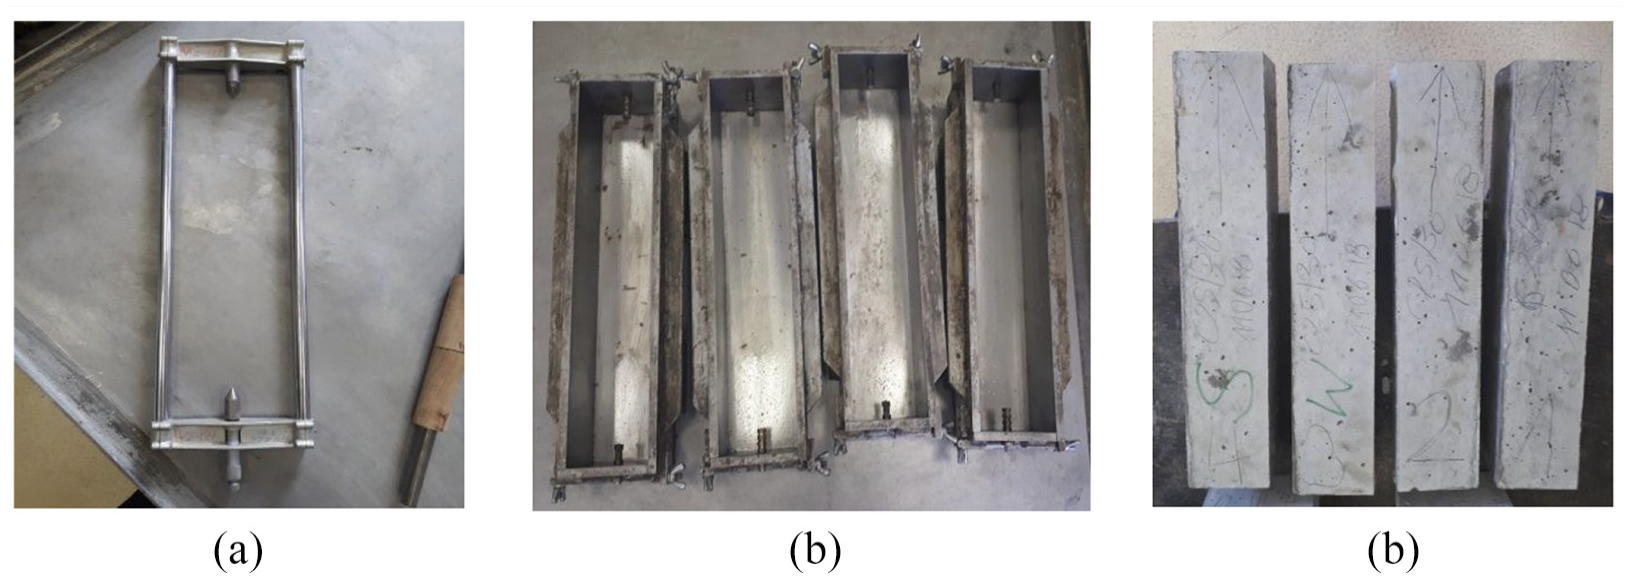
(a) Amsler apparatus, (b) molds, and (c) beams for concrete shrinkage measurement. 55
The samples were demolded after 24 ± 4 h and the frame was mounted on each of them so that the pin at the frame touches one of the measurement endings. The screw was screwed to touch the other ending and thus a zero measurement was performed; it must be remembered to mark a top side of each sample with a sign (e.g. an arrow) before the zero measurement in aim to enable making next measurements always in the same way. This measurement was the reference for next measurements. The test was recognized as finished after 300 days.
The beam length change after n days, expressed in mm/m, is calculated according to the formula:

where:
ln– result of a measurement [mm] after a time n, corrected by a difference between the read on the standard after this time n and the first read on the standard,
l 1– result of the first measurement after the sample demolding [mm].
According to Form (2), values with the sign “−” correspond to the shrinkage whereas those with the sign “+” to the swelling. Changes of the length are to be calculated with the same accuracy as the read from the micrometer screw, that is, 0.01 mm/m.
Results of the investigations and their analysis
Consistency class, density, and air content of the concrete mix
After the consistency measurement with the concrete slump test it has been stated that the mix has the wet consistency S1 – the slump was equal to 40 mm.
The density of the concrete mix, according to the standard requirements, was equal to 2360 kg/m3, what falls within the characteristic range 2000–2600 kg/m3 for an ordinary concrete. The air content in the concrete was equal to 4.2%.
Compressive strength of the hardened concrete
The results of compressive strength tests are presented in Table 4. There are presented the values averaged from three measurements, along with the value of standard deviation, coefficient of variation and expanded uncertainty for a confidence level of 95%, calculated according to the formulas 56 presented below to maintain the consistency of the article:
Statistical parameters for compressive strength of concrete.

− average (arithmetic mean) value

where: n− number of samples, xi−i-th measurement,
− standard deviation (root mean squares)

− coefficient of variation showing the extent of variability in relation to the mean value

− expanded uncertainty

where:
Changes in the average compressive strength as a function of time are presented in Figure 3.

Changes in the compressive strength as a function of time: (a) in the whole period of testing and (b) in the first 28 days.
Table 5 and Figure 4 present a ratio of the average compressive strength after 2 days to that after 28 days, being a measurement of concrete strength development, as well as ratios of the compressive strengths after 7 and 14 days to that after 28 days. The presented results are averaged values from three measurements.
Ratios of compressive strengths after individual periods to the standard compressive strength.


Ratios of compressive strengths after individual periods to the standard compressive strength.
Shrinkage
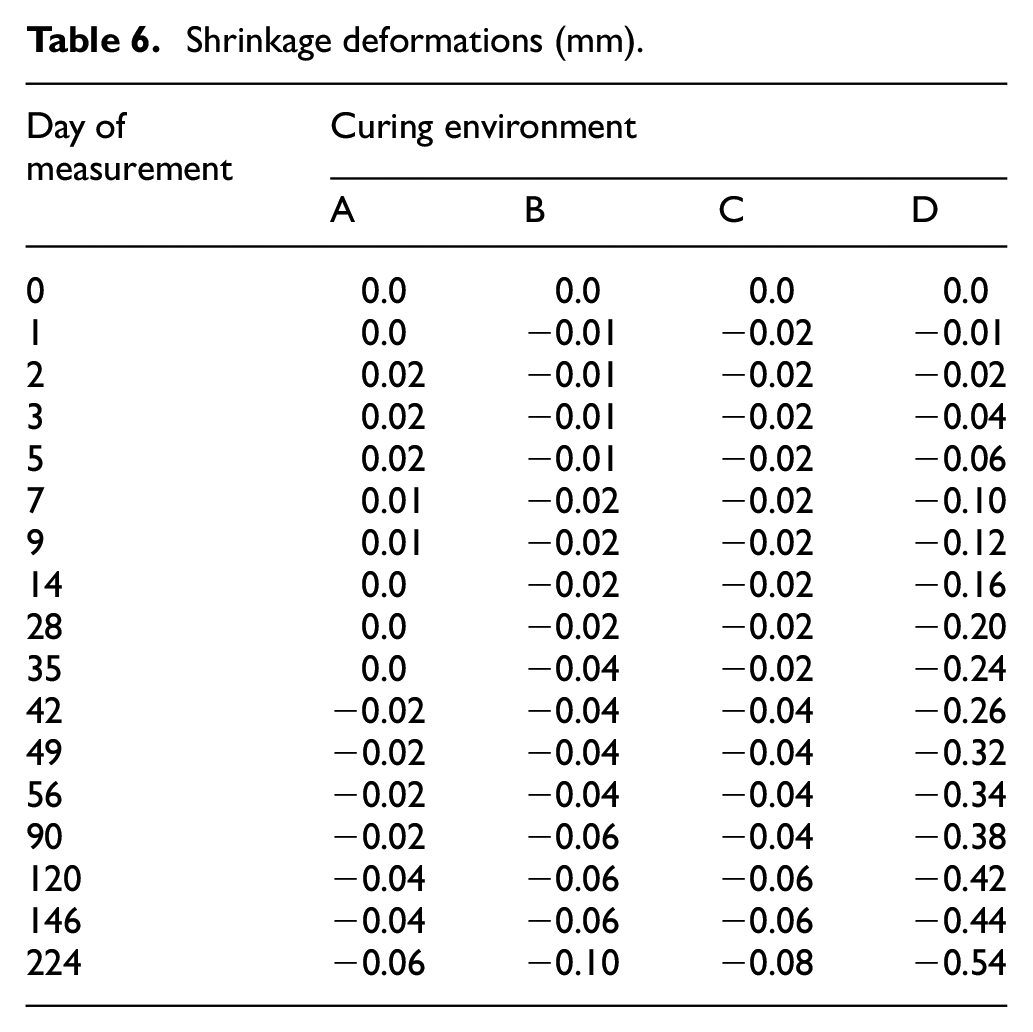
Average values of the concrete shrinkage for three samples, that is, values of deformation for individual days in various curing environments, are presented in Table 6 and in Figure 5. The presented values are the mean values from three measurements.
Shrinkage deformations (mm).

Shrinkage development: (a) within the whole test period and (b) in the first 28 days.
The dependence between the shrinkage and compressive strength varies in time. Therefore, Figure 6 presents this dependence in selected days of development of the compressive strength.

Dependence between shrinkage and compressive strength for four periods of concrete maturation.
Figure 6 presents an impact of environmental conditions on the dependence between the shrinkage and compressive strength, even in a hardened concrete.
Discussion and conclusions
The curing of the samples in water (A) was aimed on counteracting the drying shrinkage. It is applied in atmospheric conditions disadvantageous for the concrete (high temperatures, strong insolation, strong, and warm wind) to avoid overdrying.
The curing of the samples in building films (B) had to ensure that heat released by the hardening concrete is kept inside and water does not evaporate from the concrete. Unfortunately, this type of curing can evoke discolorations resulting from uneven condensation of water vapor on the concrete surface. Due to this fact it was deemed advisable to check if it is possible to ensure stable conditions by leaving soaked samples, wrapped with building films, over a water surface (C). The samples stored in room conditions in the laboratory (D) were not subjected to changes of heat and humidity, however the concrete hardening process could have been disturbed, negatively affecting the strength and evoking scratch development on the surface of the samples.
Although according to the standard classification 51 the parameter fcm,2/fcm,28 allows to evaluate the strength development as rapid for the samples stored in all analyzed curing environments (because always fcm,2/fcm,28 > 0.5), this parameter assumed diversified values depending on the way of curing.
It has been proven that along with the increase of the compressive strength the drying shrinkage reduces as well as an appropriate curing during the concrete maturation can delay shrinkage movements but it will not eliminate them totally. Analyzing the value of the parameter fcm,2/fcm,28, one can note that the concrete compressive strength developed most rapidly in the samples cured in building films (B, C) and most slowly – in the case of the dry curing in a room (D).
The performed investigations showed that after 28 days the samples cured according to the standard in the cuvettes with water (environment A) achieved the highest compressive strength, although the early-age compressive strengths after 7 and 14 days are still lower than those for the samples cured in building film and in dry conditions.
It is worth mentioning that the compressive strength values after 28 days are practically the same both for the samples stored in building films (B, C) and in room conditions (D) – the difference does not exceed 0.8 MPa. It is due to a type of the used cement: the cement 32.5 R releases moderate hydration heat and it is not as temperature-sensitive as pozzolanic cements with addition of fly-ashes.
Similar results were obtained in Witkowska-Dobrev et al., 57 where the influence of the care method, excluding the use of chemical compounds, on the compressive strength of ordinary concrete samples based on Portland cement and pozzolanic ash cement was investigated. Samples were placed in individual curing environments: in cuvettes with water, soaked and wrapped with construction foil, left in room conditions in the laboratory, placed outside the laboratory, and being exposed to the atmospheric conditions. The obtained compressive strength results confirmed that the best way of curing concrete, among the analyzed methods, is the wet cure (in cuvettes with water). Compressive strength of Portland cement samples after 28 days rich 43.5 MPa, and was higher compared to compressive strength of samples: in wet film curing with 6.9 MPa, in air conditions in room with 7.3 MPa, in atmospheric curing with 4.3 MPa. In the case of water, foil, and weathering treatments, concrete with pozzolanic ash cement has a higher compressive strength. Only in the case of samples curing under air-dry conditions in a laboratory room, the samples with Portland cement had a higher compressive strength, this was due to the relatively low air humidity maintained at about 40%, to which, as it turns out, pozzolanic ash cement with low hydration heat is sensitive.
It is worth emphasizing, however, that in the context of concrete curing with the use of additional chemicals, tests conducted for example by Mohamed and Najm 58 confirm that with regard to compressive strength, the best method regardless of the type of cement used is ponding curing.
Regardless the way of curing, all the samples are of class C25/30, that is, one class higher than it had been assumed at the stage of design of the concrete mix. The concrete class was determined with use of the method A according to the standard. 51 Although the standard strength value (after 28 days) does not allow concluding on any impact of curing conditions for the environments B, C, and D, it has been stated that these conditions affected the long-standing strength (after 90 and 365 days). It means that the way of curing of the concrete in its early age is of fundamental meaning for its long-standing compressive strength and essentially determines its shrinkage magnitude.
It is clearly visible that the curing in water (A) allows a total elimination of the shrinkage in the first 28 days what results in rapid and undisturbed strength development. For the samples cured over the water surface (C) and in the building films (B), a relation between the strength and shrinkage is practically the same. In the case of the samples cured in the wet conditions – in the cuvettes with water (A) – within the first 5 days the sample volume increases with the pace 0.02 mm/m, then within the next 4 days the volume decreases but the sample is still subjected to humidity swelling. The shrinkage was noted only in 42nd day of measurement. The remaining samples do not present any swelling in the first days. The highest shrinkage changes were noted for the sample stored in the room conditions without any additional wetting (D). The shrinkage distribution within the investigated period for the samples cured in the environments B and C was similar.
The dependences between the shrinkage and compressive strength presented in Figure 6 show that for the samples cured in water, within the first 2 weeks after molding, there is not only no shrinkage deformation but even the swelling occurs, reaching 0.02%. Figure 6 show also that within the first 4 weeks after molding the shrinkage increment in relation to the strength was quite typical. The dependences clearly prove as well that the drying shrinkage reduces along with the increase of the compressive strength.
Analysis of the obtained results and performed observations points that the best way of concrete curing among the analyzed methods from the point of view of the compressive strength value is the wet curing (A). This is due to the fact that in the case of wet curing (in cuvettes with water), the changes in compressive strength are not affected by the drying shrinkage. The main phenomenon affecting the compressive strength of analyzed ordinary concrete is the autogenic shrinkage.
Footnotes
Handling Editor: James Baldwin
Declaration of conflicting interests
The author(s) declared no potential conflicts of interest with respect to the research, authorship, and/or publication of this article.
Funding
The author(s) received no financial support for the research, authorship, and/or publication of this article.