
Abstract
The purpose of this combined laboratory and field study was to evaluate field-curing methods of concrete specimens for estimating the early opening strength of an in-place concrete item. One Illinois Department of Transportation (IDOT) class PV mix was used to cast cylinders, beams, and in-place concrete slabs in October 2021 and February 2022. Concrete cylinders were cured using three methods: ambient air (method #C1), an insulated box/cooler (method #C2), and a power-operated box (method #C3). Beams were cured using two methods: ambient air (method #B1) and an insulated plywood box (method #B2). The cast-in-place specimens from each slab and cylinder were tested for compressive strength, and beams were tested for flexural strength after 1, 3, and 7 days of curing. One cylinder and one beam in each curing method along with slabs were embedded with sensors to collect temperature variation with time. Only methods #C1, #C2, and #B1 were selected for evaluating further in the field, and data were collected from the IDOT District 5 box culvert demonstration project. Laboratory results showed that the insulated box (method #C2) estimated early (1–3 days) and ambient air (method #C1) estimated the 7-day compressive strength of an in-place concrete item within an acceptable range. Field results showed that method #C2 cylinders mimic the in-pour temperature better than method #C1 cylinders. Further statistical analyses supported the results observed in the laboratory and field.
Keywords
The American Association of State Highway and Transportation Officials (AASHTO) R 100 standard recommends using field-cured strength specimens to determine when to put a concrete structure into service or to remove formwork or falsework. Specifically, AASHTO R 100 recommends storing cylinders in or on the structure as near to the point of deposit of the concrete and cured in the same manner as the structure. Specimens should be removed from the molds at the same time as removing formwork. For field curing of beams, AASHTO R 100 recommends curing beams in the same manner as the concrete in the structure. At the end of the initial 48 ± 4 h cure time, beams, still in the molds, should be taken to the storage location and removed from the molds. Beams should be stored by placing them on the ground with their top surface facing up. Further, the sides and ends of the beams should be banked with earth or sand and kept damp, leaving the top surface exposed to the specified curing treatment.
In a recent nationwide survey (30 states in the United States and two provinces in Canada) conducted by Solanki et al. ( 1 ), it was found that most (22 out of 32) transportation agencies use field-cured cylinders, followed by the maturity method (16 out of 32). Only 5 out of 32 agencies use beams for opening the pavement to traffic, and several agencies (17 out of 32) use more than one method for deciding when to open the pavement to traffic. One of the major concerns among agencies dissatisfied with the current method was the curing procedure, which is not a real representation of the structure itself.
The decision for the early opening of a concrete structure to traffic is based on the compressive strength of concrete cylinders ( 2 , 3 ), the flexural strength of beams ( 4 – 6 ), or both. If the early opening strength of concrete is not monitored in the field, longer closure times (7–28 days) are specified to ensure sufficient strength gain. Considering the differences in strength gain between the field-cured specimens and in-place concrete items, there is an urgent need to develop a field-curing method that can match the strength of an in-place concrete item. To fill this gap, advanced concrete curing techniques such as temperature-match curing ( 7 ), the maturity method ( 8 ), and piezoelectric sensors ( 9 , 10 ) were developed.
For example, a review of the literature reveals that temperature-match curing provides better field representation. There are three principal temperature match-curing systems in use: the water bath, the air chamber, and insulated jacket molds. All three types of match curing have been shown to provide test specimens that match the strength of the in-place concrete item, compared with conventionally cured specimens ( 7 ). However, commercially available controlled temperature-matched curing test systems are fairly expensive ( 7 ).
The maturity method is another nondestructive approach to testing concrete that allows the estimation of the compressive strength of an in-place concrete item in real time. The maturity method is simply a technique for predicting concrete strength based on the temperature history of the concrete. Adopting the maturity approach in a construction project requires embedding a temperature sensor in the in-place concrete item and eliminates the need for concrete cylinder break tests. The maturity technique is a well-established standardized testing method documented in AASHTO T327 and ASTM C1074. However, the maturity concept has not found momentum in several states, including Illinois, because of the number of unique mix designs producers generate from changing source materials. Thus, a simpler cost-effective approach independent of the specific mix design that provides better field representation of the in-place concrete item strength is needed.
As noted in the above paragraphs, these methods are time-consuming and not cost-effective. Therefore, a laboratory study was conducted to develop a cost-effective and time-efficient field-curing method of specimens that can match the strength of an in-place concrete item. The laboratory study was validated by analyzing field data collected from the Illinois Department of Transportation (IDOT) District 5 box culvert demonstration project and statistical analyses.
Materials and Methods
Laboratory Concrete Mixes and Casting
For the laboratory study, one IDOT class PV (pavements) mix was used. The mix design had a design water-to-cement ratio (w/c) of 0.42, cement content of 255 kg/m3 (430 lb/yd3), fly ash content of 86 kg/m3 (145 lb/yd3), coarse aggregate content of 1,067 kg/m3 (1,798 lb/yd3), and fine aggregate content of 720 kg/m3 (1,213 lb/yd3). Refer to Solanki and Xie ( 11 ) for more information about the actual quantity of ingredients. The design requirements of 14-day compressive and flexural strengths were a minimum of 24 MPa (3,500 pounds per square inch [psi]) and 4.5 MPa (650 psi), respectively. Concrete was poured on October 1, 2021, and February 25, 2022. Three small 600 × 600 × 200 mm (24 × 24 × 8 in.) cast-in-place (CIP) test slabs, three large 900 × 900 × 300 mm (36 × 36 × 12 in.) CIP test slabs, thirty 100 × 200 mm (4 × 8 in.) cylinders, thirty 150 × 300 mm (6 × 12 in.) cylinders, and fifteen 150 × 150 × 500 mm (6 × 6 × 20 in.) beams were prepared during each pour in this study. To mimic field conditions, all slabs, cylinders, and beams were cured outside in the parking lot area (the concrete experiment site) of the Turner Hall building at Illinois State University (ISU). Specimens were tested after 1, 3, and 7 days of curing.
Each small and large slab consisted of four 100 × 200 mm (4 × 8 in.) and four 150 × 300 mm (6 × 12 in.) CIP cylinder molds, respectively, inside the slab formwork in accordance with modified ASTM C873 ( 7 ) (Figure 1a). After pouring and placing the CIP cylinders in accordance with AASHTO R 100, a temperature sensor was embedded at the center of the slab, and then the slab was covered with polyethylene sheeting for curing until the day of testing. Additionally, the slab was sealed with a 2.5 cm (1/2 in.) curing blanket (R = 5.7) on the top to ensure better (i.e., less gradient) heat distribution within the CIP specimens ( 7 ). Photos of the slabs immediately after casting and during curing (covered with a blanket on top of a plastic sheet) are shown in Figure 1, b and c , respectively. One small slab and one large slab were opened on each testing day after curing to extract four 100 mm (4 in.) and four 150 mm (6 in.) CIP cylinders, respectively.
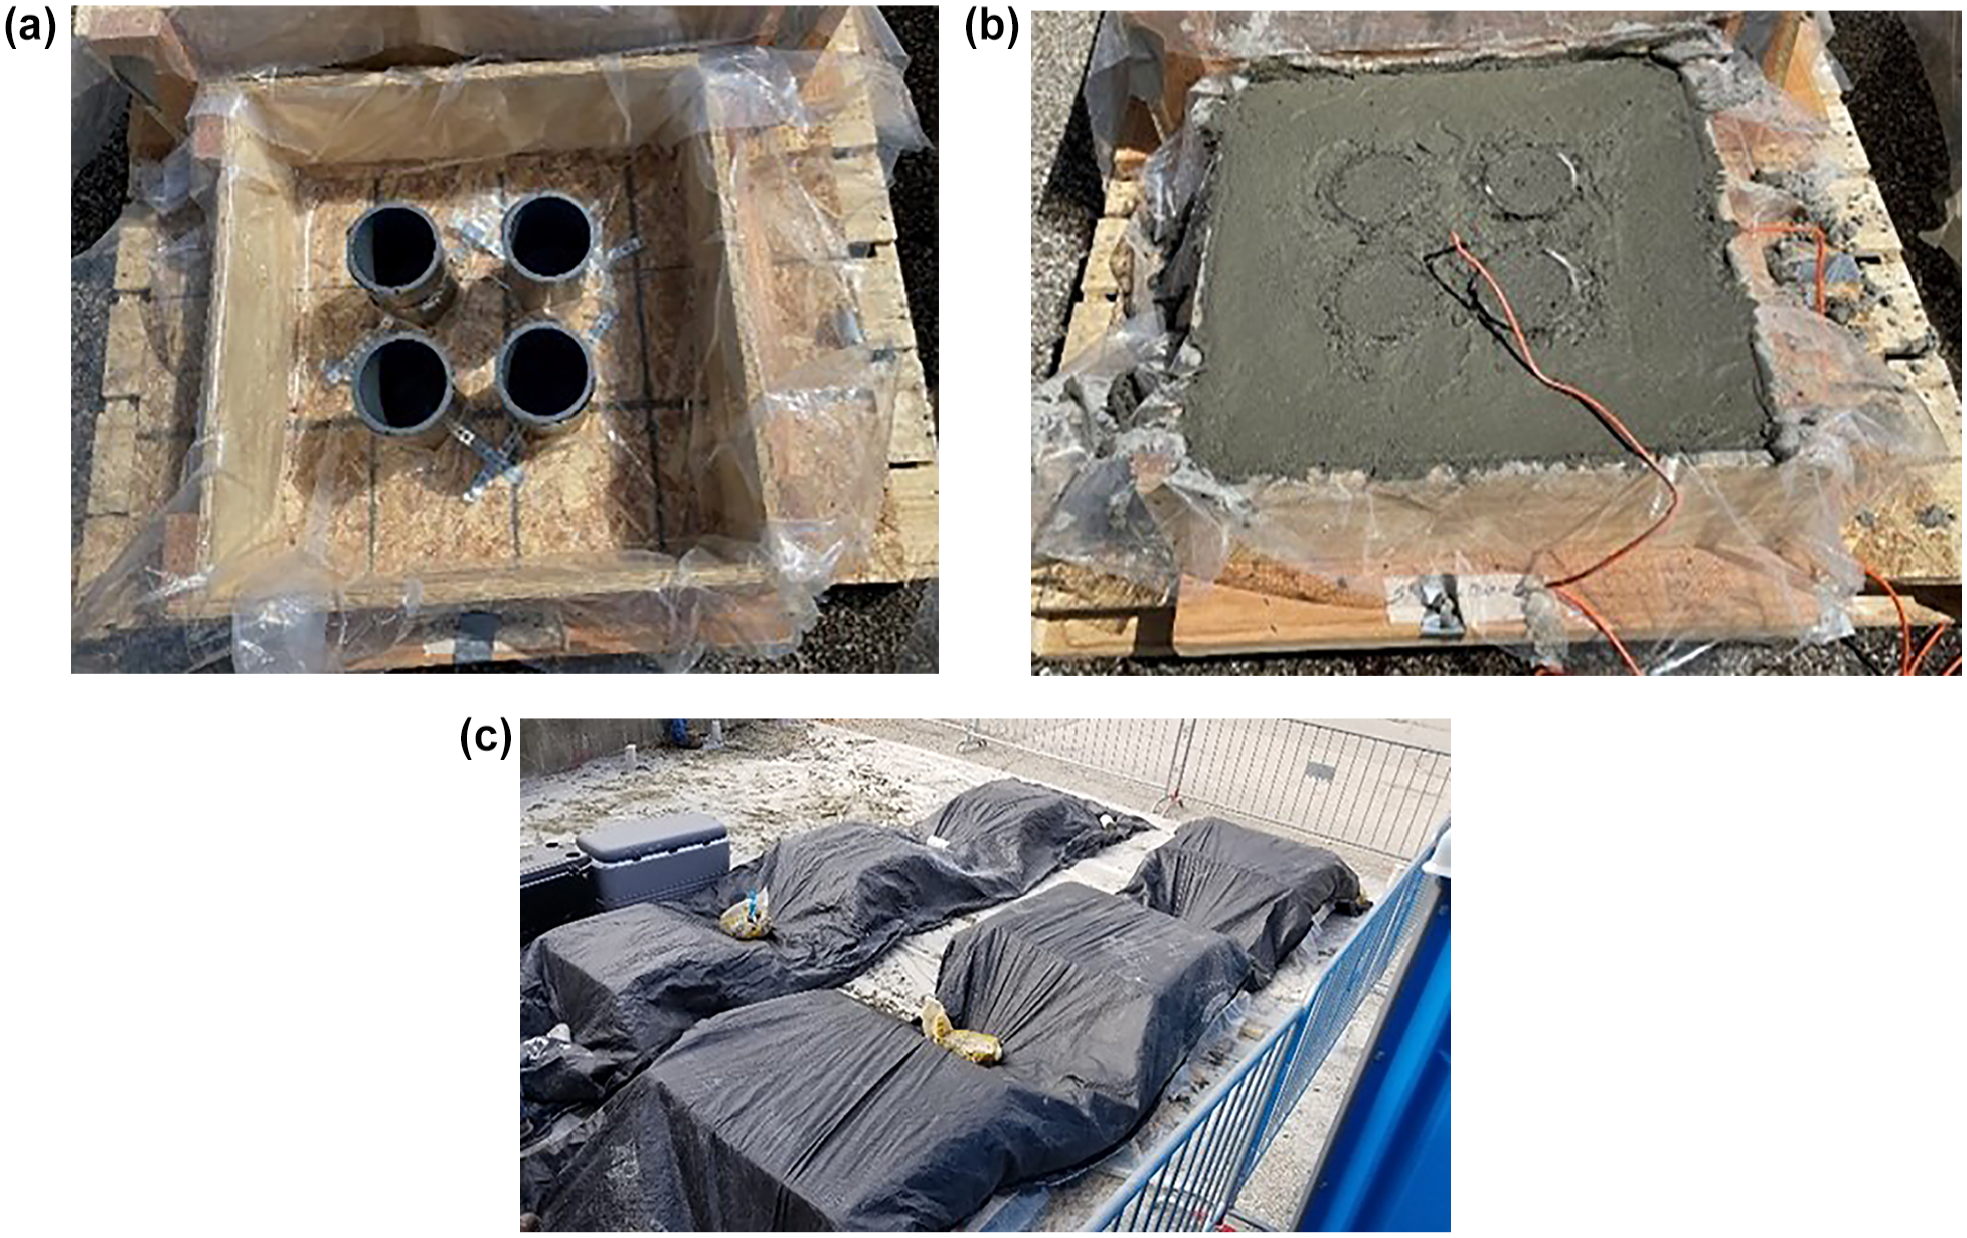
Slab with four cast-in-place cylinders (a) before casting, (b) after casting, and (c) covered with a blanket during curing.
Both 100 mm (4 in.) and 150 mm (6 in.) concrete cylinders were cast in accordance with AASHTO R 100 and cured using three cost-effective methods: method #C1, method #C2, and method #C3.
In method #C1 (Figure 2a), the cylinders were cured in ambient air in direct sunlight on the lab loading dock of the outdoor concrete experiment site and stripped on the day of the test ($1.64 per plastic cylinder mold).
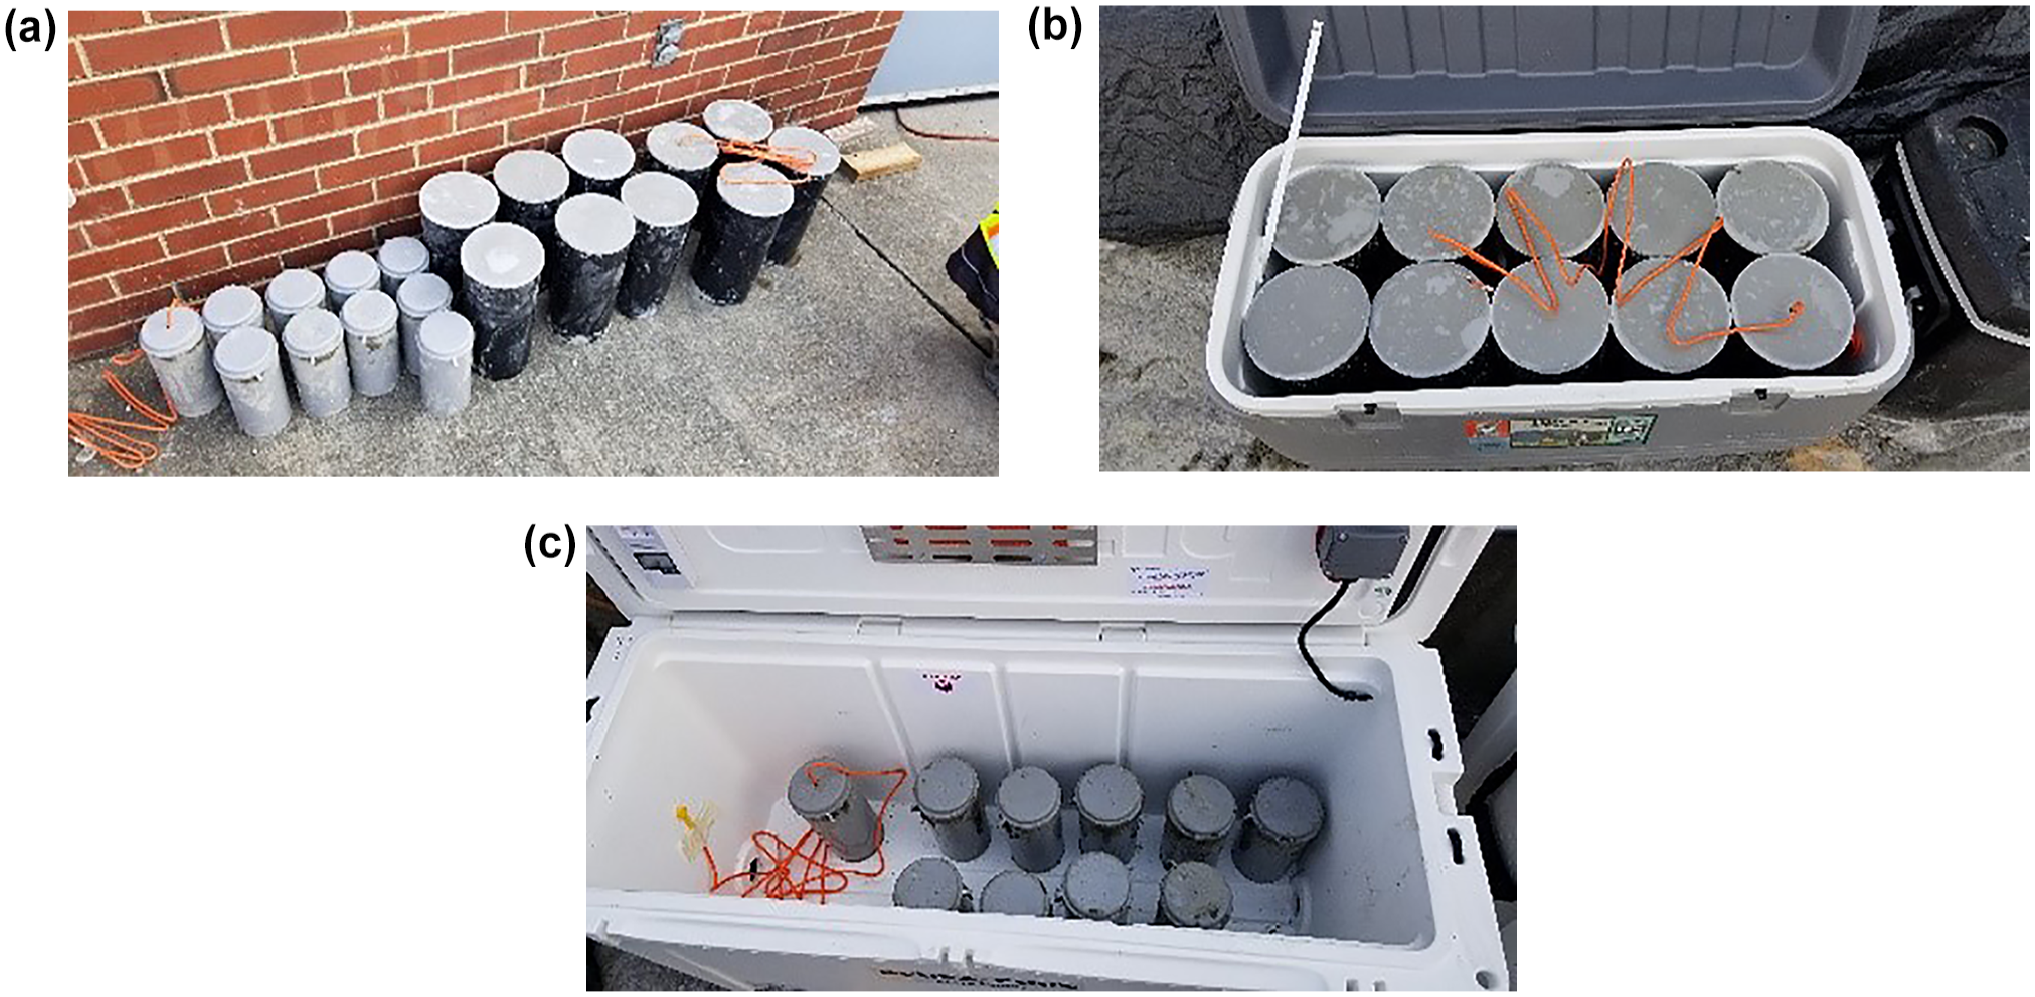
Cylinders under curing for (a) method #C1—October 2021 (ambient air), (b) 150 mm (6 in.) method #C2 (insulated box), and (c) 100 mm (4 in.) method #C3 (power-operated box).
In method #C2 (Figure 2b), the cylinders were gang cured (10 in a box) in an insulated box (cooler) in direct sunlight in the parking lot of the outdoor concrete experiment site and stripped on the day of the test ($1.64 per plastic cylinder mold + $70 cooler, which is reusable). The cooler used was rated as a “5-day cooler,” which keeps ice for up to 5 days in temperatures as high as 32°C (90°F).
In method #C3 (Figure 2c), the cylinders were gang cured (10 in a box) in a thermostatically controlled curing box (power operated) in direct sunlight in the parking lot of the outdoor concrete experiment site and stripped on the day of the test ($1.64 per plastic cylinder mold + $1,185 reusable box + power supply). The power was kept on for 24 h at 21°C (70°F) after casting of cylinders and then turned off.
Each curing method consisted of 10 specimens. Of the 10 specimens, nine were tested for compressive strength after 1, 3, and 7 days of curing. Three replicates were tested on each day. The remaining specimen was embedded with a sensor for monitoring temperature with time.
Each 500 mm (20 in.) long beam was cast in accordance with AASHTO R 100. After casting, all concrete beams were covered using an insulated wet curing cover (see Figure 3a) and cured using two types of cost-effective methods. It is also important to note that all beams were demolded after 24 h of casting and placed back for curing, consistent with IDOT practice.
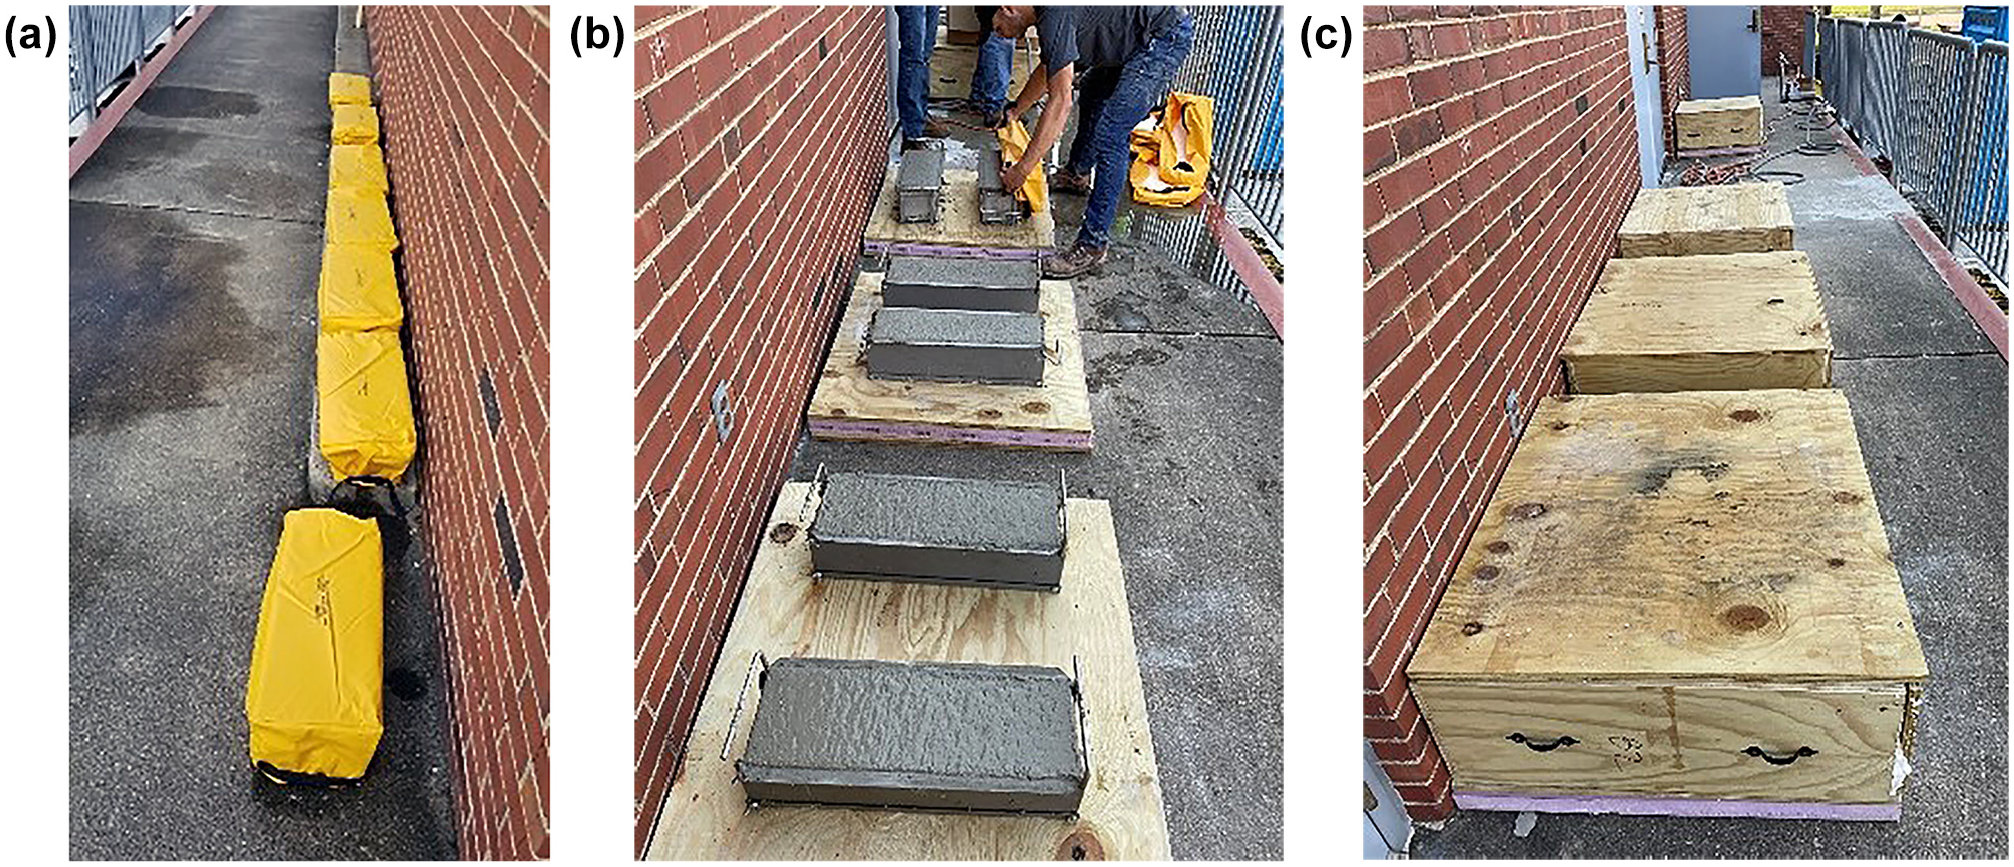
Beams under curing for (a) method #B1—October 2021 (ambient air), (b) method #B2 (beam box) without a top lid, and (c) method #B2 (beam box) with a top lid.
In method #B1 (Figure 3a), the beams were cured in ambient air in direct sunlight on the lab loading dock of the outdoor concrete experiment site ($158.50 per beam mold, which is reusable).
In method #B2 (Figure 3b without top lid, Figure 3c with top lid), the beams were gang cured in a beam box in direct sunlight in the parking lot of the outdoor concrete experiment site ($138.60 per box, which is reusable). Five beam boxes were manufactured in the lab using foam board (R = 10) sandwiched between two plywood sheets to insulate the beams (total R = 12; see Figure 3c). Two beams were placed inside each box.
Seven and eight beams were prepared for method #B1 and method #B2, respectively. Of the seven beams, six were tested for third-point flexural strength after 1, 3, and 7 days of curing, and duplicates were tested each day. The remaining beam was embedded with a sensor for monitoring temperature with time.
Field Concrete Mixes and Casting
The field data were collected from a box culvert demonstration (IDOT District 5) project. Figure 4, a and b , shows the construction site and specimen curing location, respectively. For this project, an IDOT Class SI mix (with a shortened cure period) was used. The mix design had an initial target w/c of 0.38, cement content of 374 kg/m3 (630 lb/yd3), coarse aggregate content of 1,086 kg/m3 (1,831 lb/yd3), and fine aggregate content of 697 kg/m3 (1,174 lb/yd3). The design requirements of 3-day compressive and flexural strengths were a minimum 24 MPa (3,500 psi) and 4.5 MPa (650 psi), respectively.
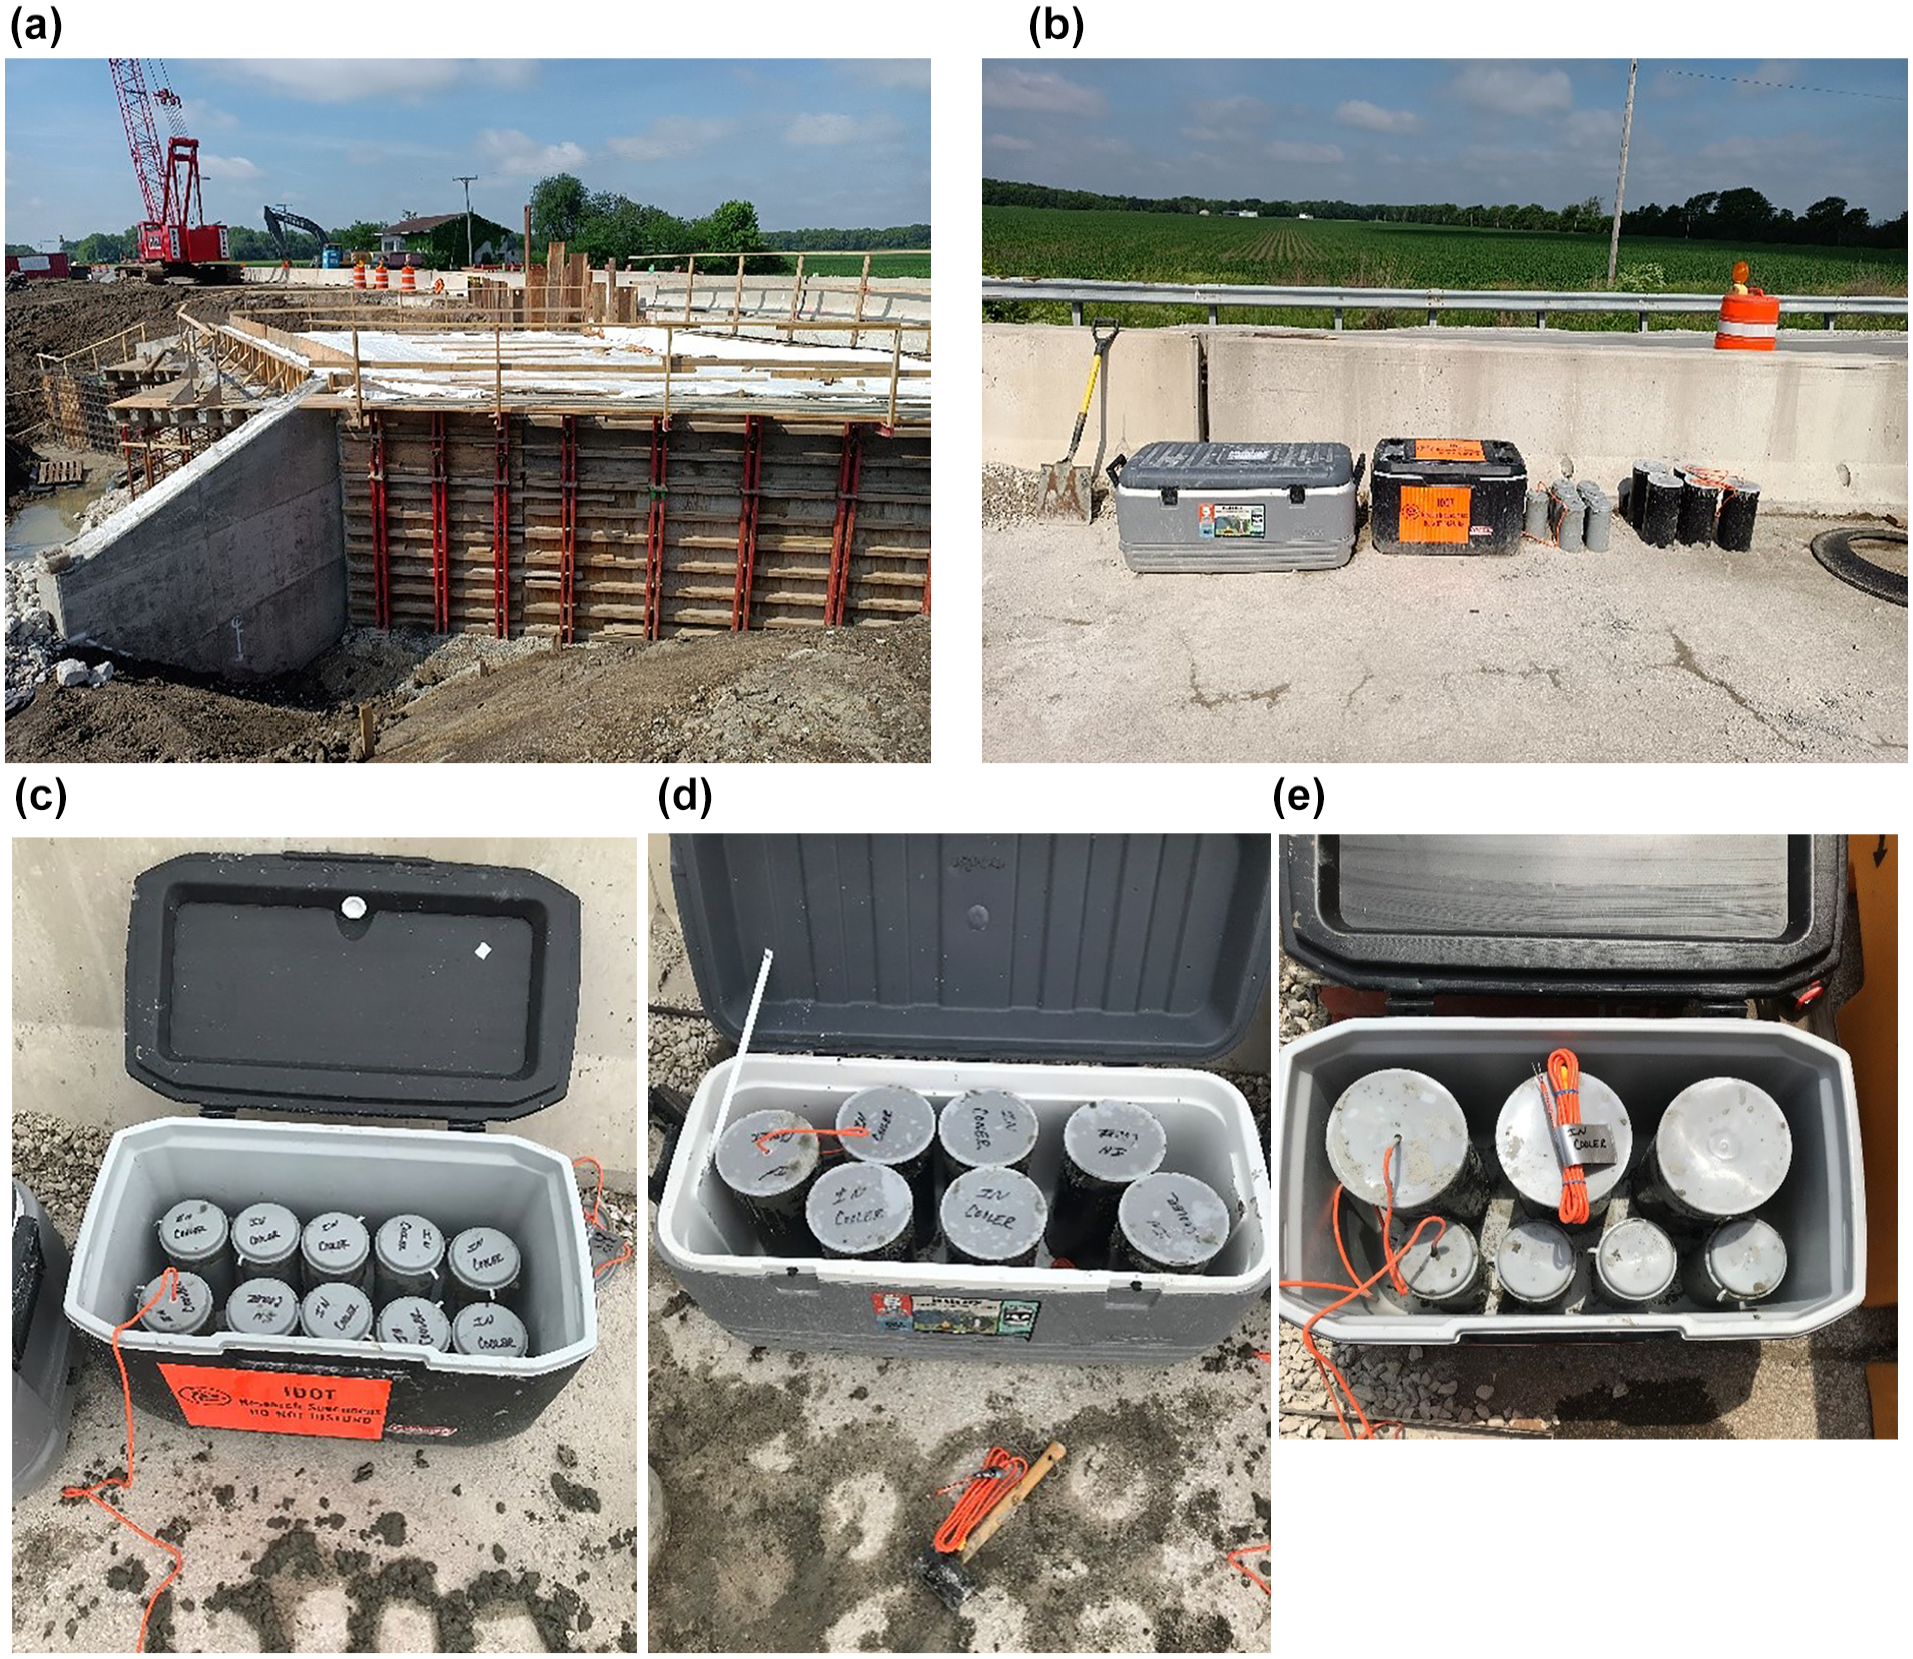
View of (a) box culvert construction site, (b) specimen curing location taken on June 11, 2022, (c) example of 4 in. cylinders cured using method #C2 (insulated box) on June 8, 2022, and August 22, 2022, (d) example of 6 in. cylinders cured using method #C2 on June 8, 2022, and August 22, 2022, and (e) example of 4 in. and 6 in. cylinders cured together using method #C2 on May 20, 2022, and August 11, 2022.
The concrete was poured in two stages: without a rheology-controlling admixture (stage I) and with a rheology-controlling admixture at 44 oz. per cubic yard (stage II). All specimens were prepared and cured at the site on concrete pouring day. The stage I mixes were poured in the field on May 12, May 20, May 27, and June 8, 2022. The stage II mixes were poured in the field on June 21, August 11, and August 22, 2022. Figure 4, c–e, shows the specimens under curing. Note that for the pours on May 20 and August 11, three replicates of 100 × 200 mm (4 × 8 in.) cylinders (total = 3 cylinders + 1 cylinder with a sensor) and two replicates of 150 × 300 mm (6 × 12 in.) cylinders (total = 2 cylinders + 1 cylinder with a sensor) were placed in the same cooler and tested after 3 days (Figure 4e). The concrete specimens prepared in the field were tested after 2, 3, and 7 days of curing. All pours were installed with temperature sensors for monitoring the in-pour temperature. These sensors were located in the center of the slab and a couple of feet from the end of the slab/wall. Refer to Solanki and Xie ( 11 ) for more information about the mix design, construction, pouring, and testing.
Laboratory Results and Discussion
October 2021 Cast
Figures 5 and 6 present the variation of compressive strength of 100 mm (4 in.) and 150 mm (6 in.) cured cylinders, respectively, for the October 21 cast. Figure 7 presents the variation of the temperature inside cylinders cured using various methods, 7-day cured small/large slabs, and ambient air temperature. As demonstrated in Figures 5 and 6, method #C1 estimated the lowest 1-day and 3-day strength among all three curing methods. As indicated in Figure 7, this could be attributed to the lower temperature inside the cylinders cured using method #C1 compared with the slab. On day 7, method #C1, compared with methods #C2 and #C3, had an estimated strength closest to the corresponding CIP cylinders (within +0.2 MPa [+34 psi] for 150 mm [6 in.] cylinders).
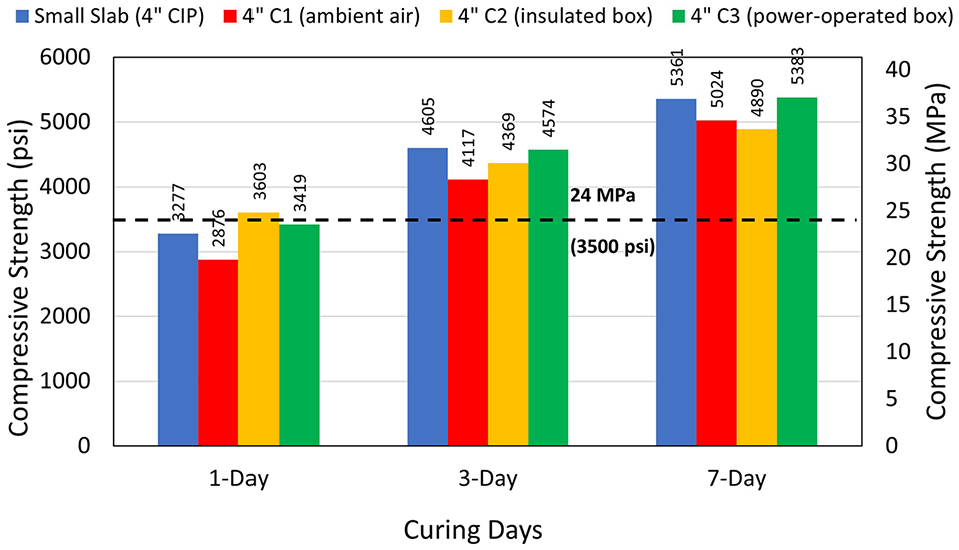
Compressive strength of 100 mm (4 in.) cylinders for the October 2021 cast.
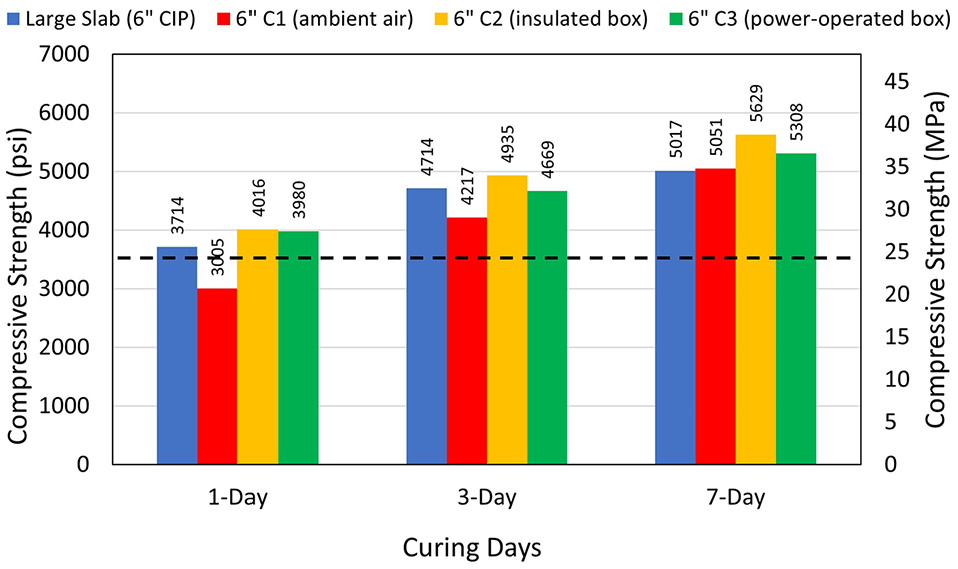
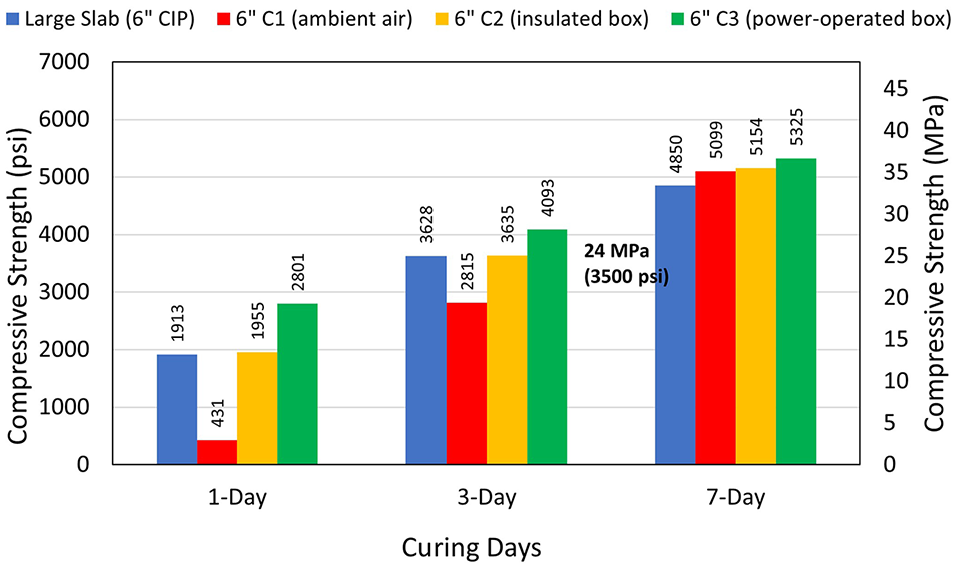
Compressive strength of 150 mm (6 in.) cylinders for the October 2021 cast.
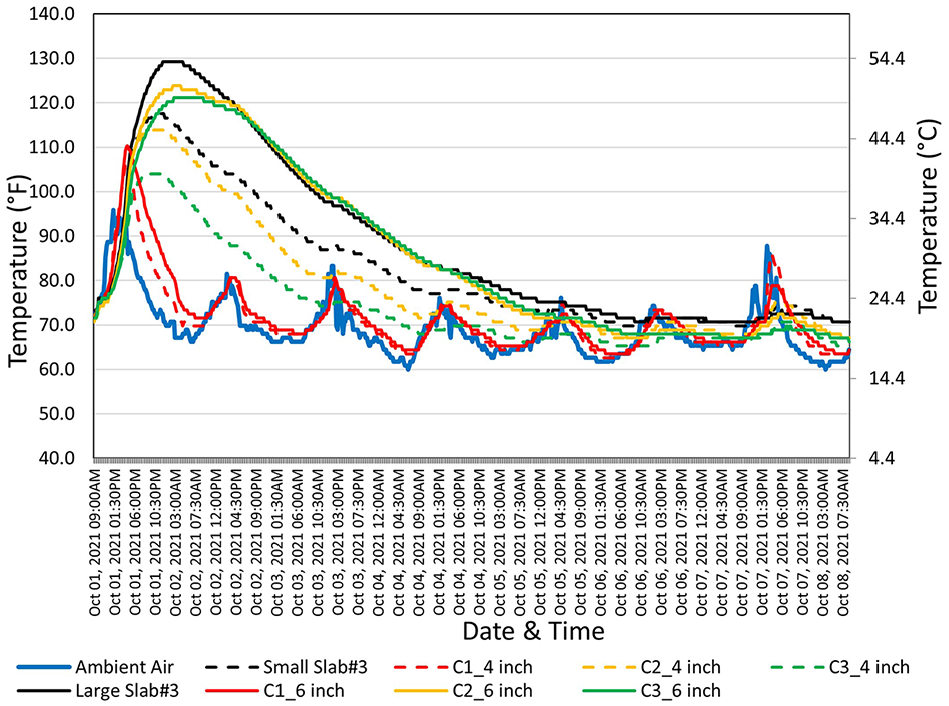
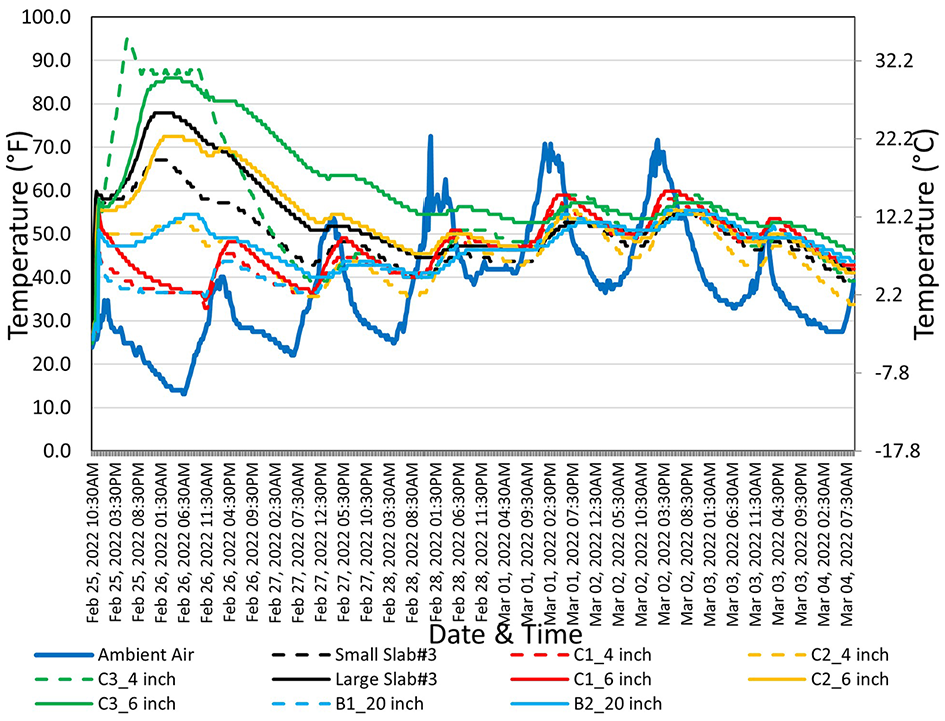
Temperature variation with time of specimens for the October 2021 cast.
Methods #C2 and #C3 estimated the 1-day and 3-day compressive strength closest to the corresponding CIP cylinders. For example, 100 mm (4 in.) cylinders of methods #C2 and #C3 estimated 1-day strength by +2.3 MPa (+327 psi) and +1 MPa (+142 psi), respectively. Further, method #C2 provided higher 1-day strength values compared with corresponding cylinders cured using method #C3. This could be attributed to slightly higher temperature values at the beginning inside the cylinders cured using method #C2 compared with method #C3. During the first 24 h, the average temperature difference between methods #C2 and #C3 was 4.2°C (7.6°F) for 100 mm (4 in.) cylinders and 1.2°C (2.2°F) for 150 mm (6 in.) cylinders (see Figure 7). One reason for the higher temperature in method #C2 could be the thicker insulated walls of the cooler compared with the power-operated box used for method #C3. It is also interesting to note that concrete attained more than the required 14-day compressive strength of 24 MPa (3,500 psi) on day 1, as indicated by method #C2 (both 100 mm and 150 mm cylinders) and method #C3 (only 150 mm cylinders) results.
February 2022 Cast
Figures 8 and 9 present the variation of compressive strength of 100 mm (4 in.) and 150 mm (6 in.) cured cylinders, respectively, for the February 2022 cast. Figure 10 presents the variation of temperature inside cylinders cured using various methods, 7-day cured small/large slabs, beams, and ambient air temperature. Figures 8 and 9 demonstrate that method #C1 estimated the lowest 1-day and 3-day strength. This behavior could be attributed to the lower temperature inside the cylinders cured using method #C1 compared with the slab (Figure 10). On day 7, method #C1, compared with methods #C2 and #C3, had an estimated strength closest to the corresponding CIP cylinders: within +0.4 MPa [+56 psi] for 100 mm (4 in.) cylinders and within +1.7 MPa [+249 psi]) for 150 mm (6 in.) cylinders.
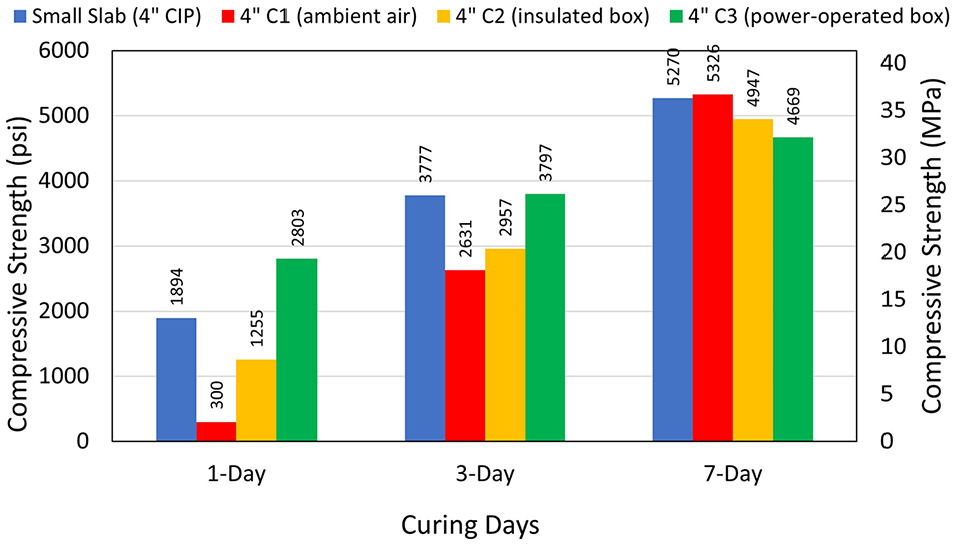
Compressive strength of 100 mm (4 in.) cylinders for the February 2022 cast.
Compressive strength of 150 mm (6 in.) cylinders for the February 2022 cast.
Temperature variation with time of specimens for the February 2022 cast.
Method #C2 estimated the 1-day compressive strength closest to the corresponding CIP cylinders. For example, 100 mm (4 in.) cylinders of methods #C2 and #C3 underestimated and overestimated 1-day strength by −4.4 MPa (−638 psi) and + 6.3 MPa (+ 910 psi), respectively. The better estimation of 1-day strength by method #C2 compared with method #C3 could be attributed to temperature differences. In the first 24 h, method #C3 provided slightly warmer temperatures (an average 24-h temperature difference of +17.1°C [+30.7°F] for 100 mm [4 in.] cylinders and +5.6°C [+10.0°F]) for 150 mm [6 in.] cylinders) compared with method #C2 because of power-operated heating, which resulted in overestimation of in-place strength (Figure 10). For instance, method #C3 overestimated in-place 3-day compressive strength by +0.1 MPa (+20 psi) for 100 mm (4 in.) cylinders and by +3.2 MPa (+465 psi) for 150 mm (6 in.) cylinders. Therefore, method #C3 may not be a good option for estimating early strength in cold weather. Note that the concrete slab attained more than the required 14-day compressive strength of 24 MPa (3,500 psi) on day 3, as indicated by CIP cylinders and estimated by methods #C2 (only 150 mm cylinders) and #C3 (both 100 mm and 150 mm cylinders).
500 mm (20 in.) Beams
Figure 11 presents the variation of flexural strength of 500 mm (20 in.) cured beams with respect to curing days for the October 2021 and February 2022 casts. Figure 11 demonstrates that for the October 2021 cast, method #B1 estimated slightly higher 1-day and 3-day flexural strength compared with method #B2 (within 0.3 MPa [50 psi]). In contrast, the 7-day flexural strength estimated by method #B2 was slightly higher than the corresponding flexural strength estimated by method #B1 (within 0.2 MPa [35 psi]).
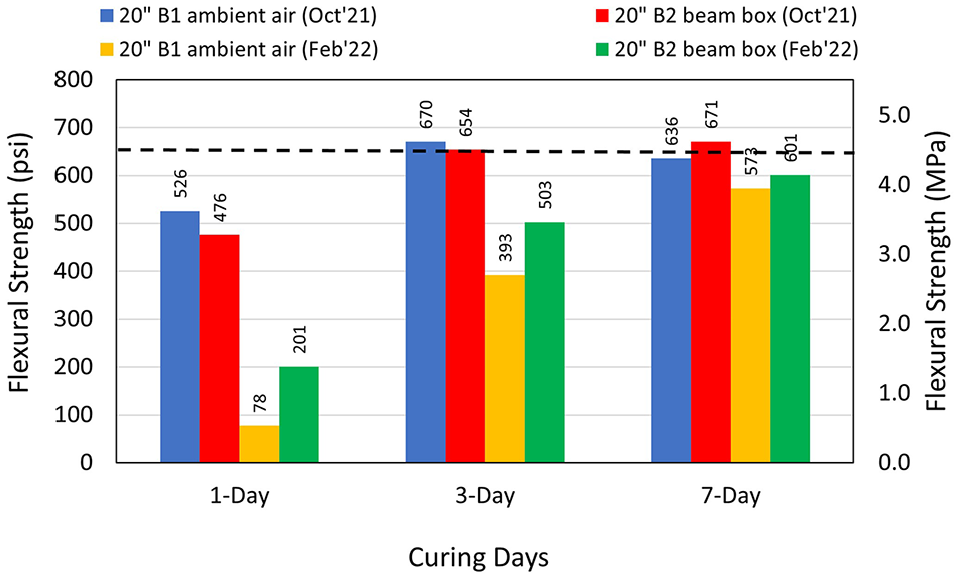
Flexural strength of 500 mm (20 in.) beams for October 2021 and February 2022 casts.
For the February 2022 cast, method #B2 consistently estimated higher 1-day, 3-day, and 7-day flexural strength compared with method #B1. The 1-day, 3-day, and 7-day strength estimated by method #B2 was within +0.8 MPa (+123 psi), +0.7 MPa (+110 psi), and +0.2 MPa (+28 psi), respectively, compared with the strength of corresponding method #B1 beams. This higher flexural strength could be attributed to higher temperature inside beams cured using method #B2 compared with method #B1 (see Figure 9). In the first 24 h, method #B2 provided an average warmer temperature of +6.7°C (+12.1°F) compared with corresponding method #B1 beams.
A comparison of the temperature inside a 7-day cured large slab and cured beams from Figure 9 shows that both methods #B1 and #B2 provided a temperature trend similar to cast slabs. However, beams cured using methods #B1 and #B2 experienced colder temperatures compared with slabs. For instance, beams curing using methods #B1 and #B2 experienced an average temperature difference of −11.5°C (−20.7°F) and −7.9°C (−14.2°F) in the first 72 h, respectively, compared with the large slab.
Note that concrete attained more than the required 14-day flexural strength of 4.5 MPa (650 psi) on day 3 for the October 2021 cast. However, for the February 2022 cast, concrete never attained the required 14-day flexural strength, which is contrary to observations made for cylinders. This could be attributed to the relatively lower temperature inside cured beams compared with cured cylinders. For instance, beams cured using method #B2 experienced an average lower temperature of −7.4°C (−13.4°F) in the first 72 h compared with method #C2 cylinders (Figure 9).
Field Demonstration Results and Discussion
Based on the results from the laboratory, method #C2 was evaluated further in the field. This method was chosen, as it is more field friendly (no power needed) compared with method #C3. For comparison with traditional IDOT methods, methods #C1 and #B1were also evaluated in the field and compared with method #C2, as discussed in subsequent sections.
May 2022 Cast (Stage I Mix)
The compressive strength results from the cast on May 20, 2022, using the stage I mix are presented in Figure 12. Figure 13 presents the flexural strength variation of beams cured using method #B1 that were cast on May 12, May 20, and May 27, 2022. Figure 14 presents the variation of temperature inside the beams and the in-pour and ambient air temperature for the cast on May 12, 2022. Figure 15 shows the variation of the temperature inside cured cylinders and beams and the in-pour and ambient air temperatures for the cast on May 20, 2022.
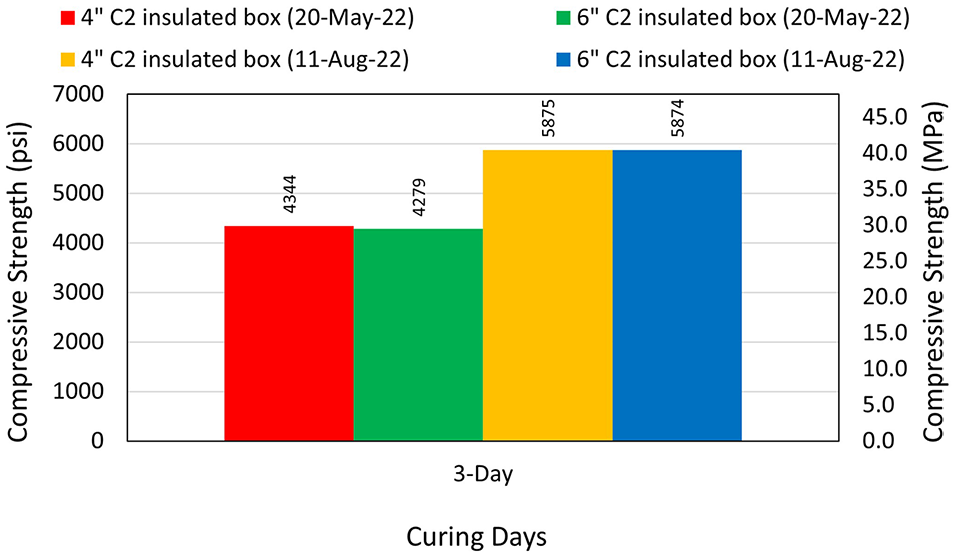
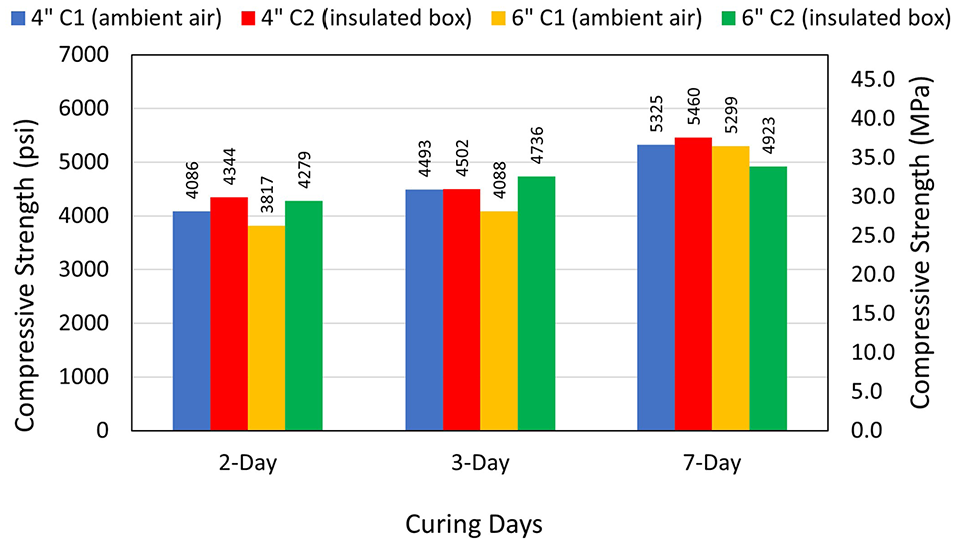
Compressive strength of 100 mm (4 in.) and 150 mm (6 in.) cylinders for the casts on May 20 and August 11, 2022.
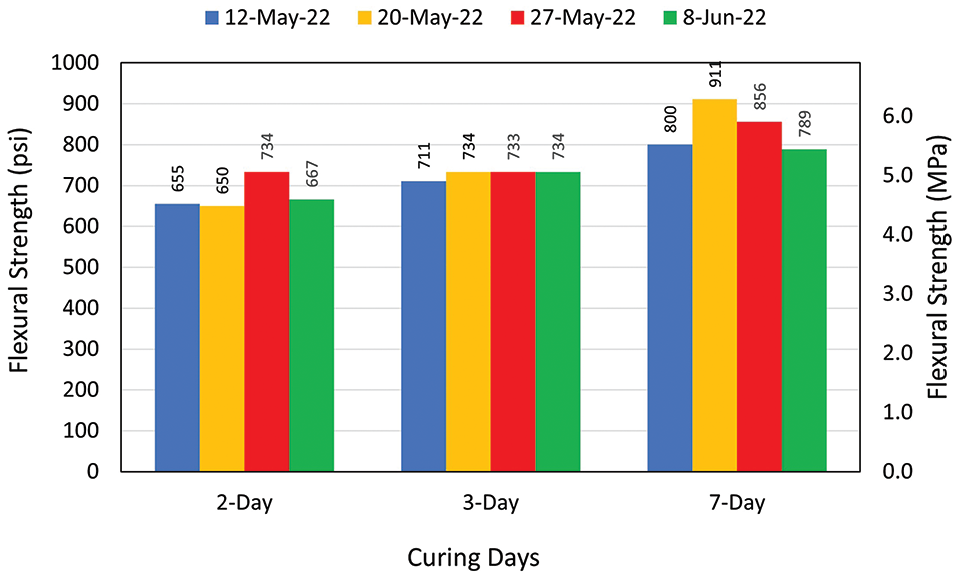
Flexural strength of 500 mm (20 in.) beams using method #B1 (ambient air) for the May and June 2022 casts.
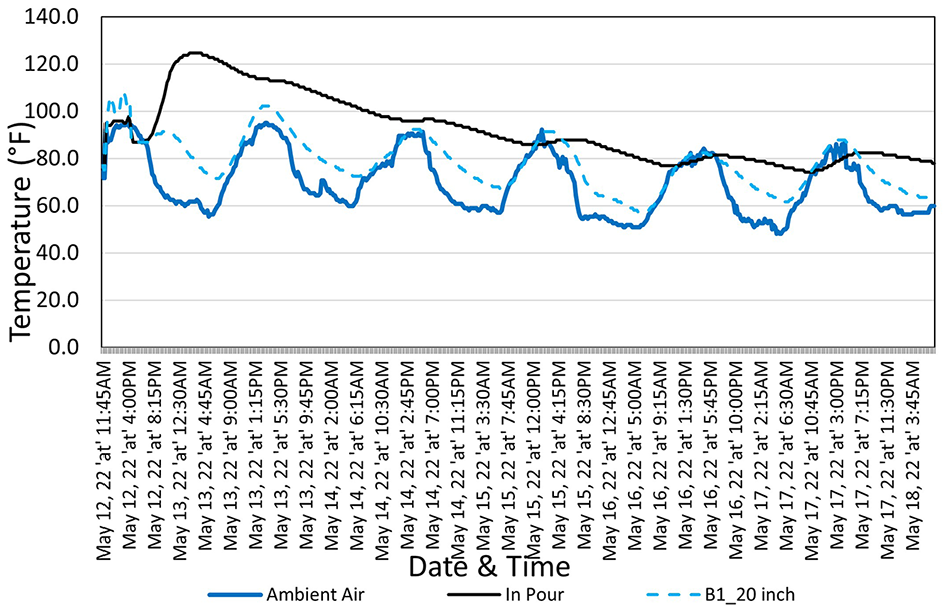
Temperature variation with time of specimens for the cast on May 12, 2022.
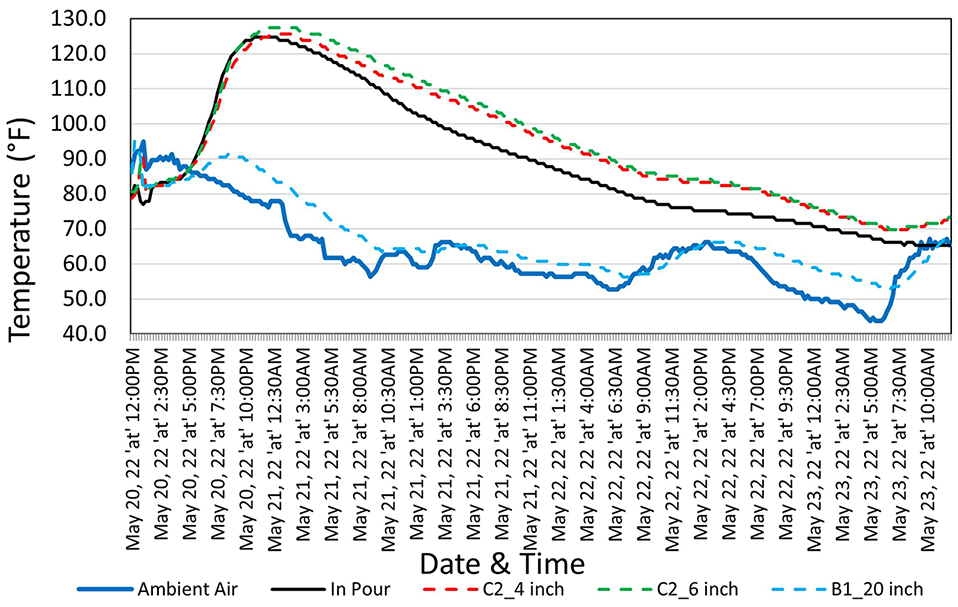
Temperature variation with time of specimens for the cast on May 20, 2022.
For the cast on May 20, 2022 cast, both four 100 mm (4 in.) and three 150 mm (6 in.) cylinders were kept in the same cooler and cured using method #C2. Then, specimens were tested after three days of curing. Both 100 mm (4 in.) and 150 mm (6 in.) specimens provided approximately similar compressive strength. This could be attributed to similar temperature variation inside 100 mm (4 in.) and 150 mm (6 in.) specimens, as shown in Figure 15. Note that 100 mm (4 in.) and 150 mm (6 in.) cylinders produced temperatures ranging slightly higher than the in-pour temperature (Figure 15). This slightly higher temperature caused by method #C2 could result in overestimation of in-place concrete strength. Figure 15 also shows that out of all specimens tested for the cast on May 20, 2022, beams experienced the lowest temperature, and the trend was similar to ambient air temperature.
For both 100 mm (4 in.) and 150 mm (6 in.) specimens from the cast on May 20, 2022, concrete showed compressive strength greater than the required compressive strength of 24 MPa (3,500 psi) on day 3 (Figure 12). Figure 13 demonstrates that the concrete showed flexural strength greater than or equal to the required flexural strength of 650 psi on day 2 for casts on May 12, May 20, May 27, and June 8, 2022.
June 2022 Cast (Stage I Mix)
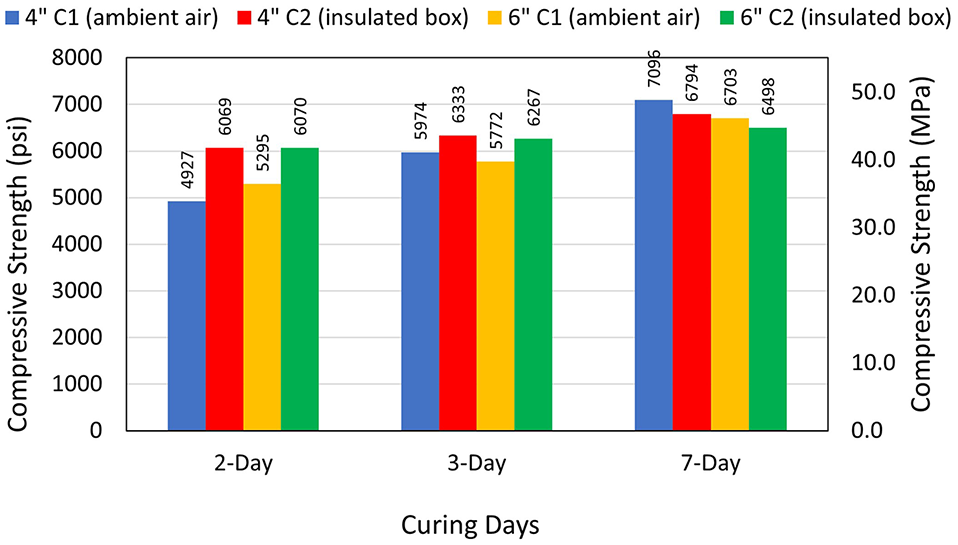
Figure 16 presents the variation of compressive strength of 100 mm (4 in.) and 150 mm (6 in.) cured cylinders with respect to curing days for the cast on June 8, 2022. Figure 17 presents the variation of the temperature inside the cured cylinders and beams and the in-pour and ambient air temperatures. Figure 16 demonstrates that method #C1 estimated the lowest 2-day, 3-day, and 7-day strength among both methods. This could be attributed to the low temperature inside cylinders cured using method #C1 (Figure 17). For both 100 mm (4 in.) and 150 mm (6 in.) specimens, concrete showed strength greater than the required compressive strength of 24 MPa (3,500 psi) on day 2. Figure 13 shows that the concrete showed flexural strength greater than the required flexural strength of 650 psi on day 2. Figure 17 shows that 150 mm (6 in.) cylinders cured using method #C2 provided temperatures closest to in-pour temperatures among all specimens tested.
Compressive strength of 100 mm (4 in.) and 150 mm (6 in.) cylinders for the cast on June 8, 2022.
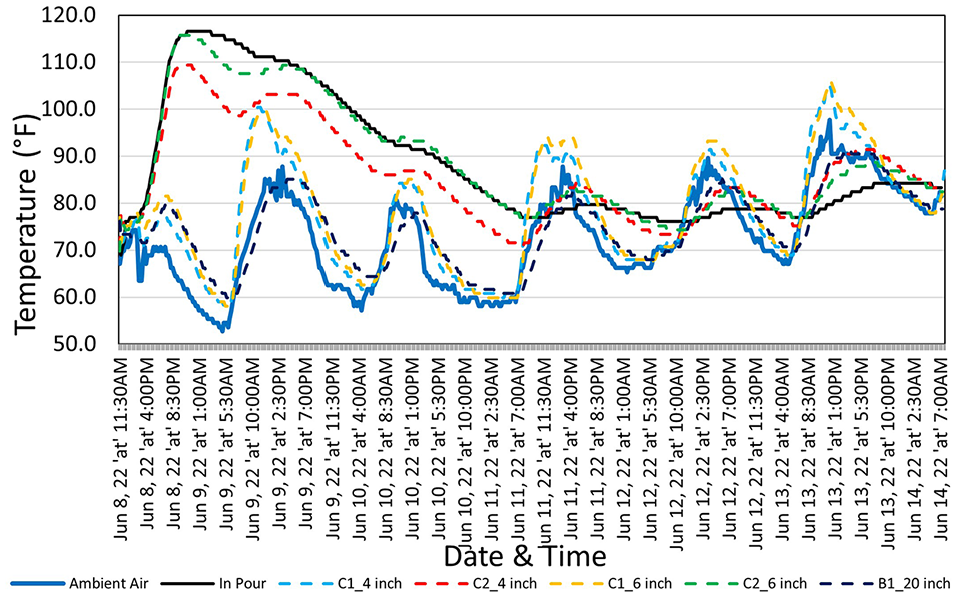
Temperature variation with time of specimens for the cast on June 8, 2022.
July and August 2022 Cast (Stage II Mix)
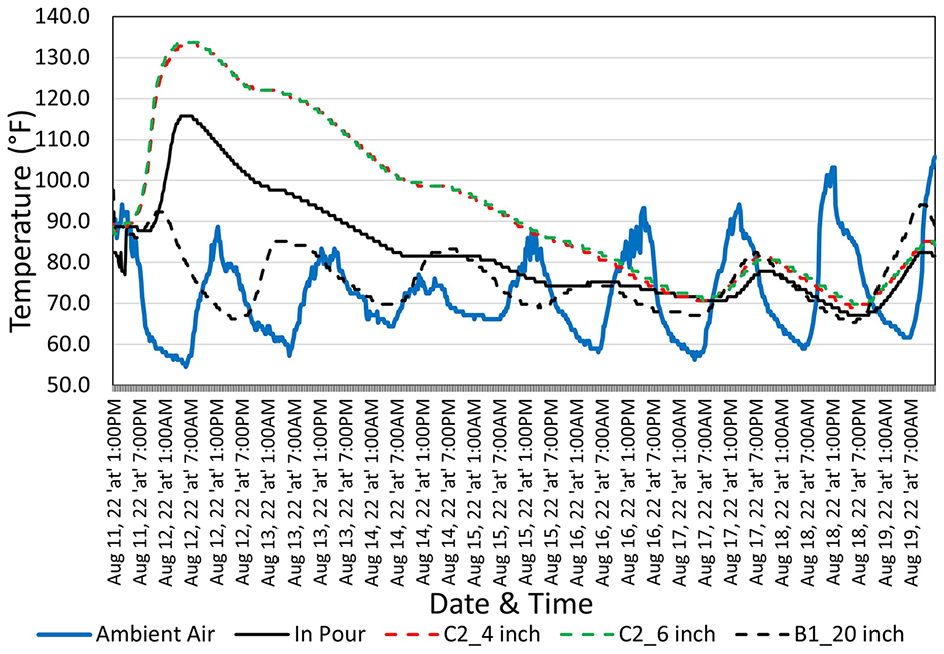
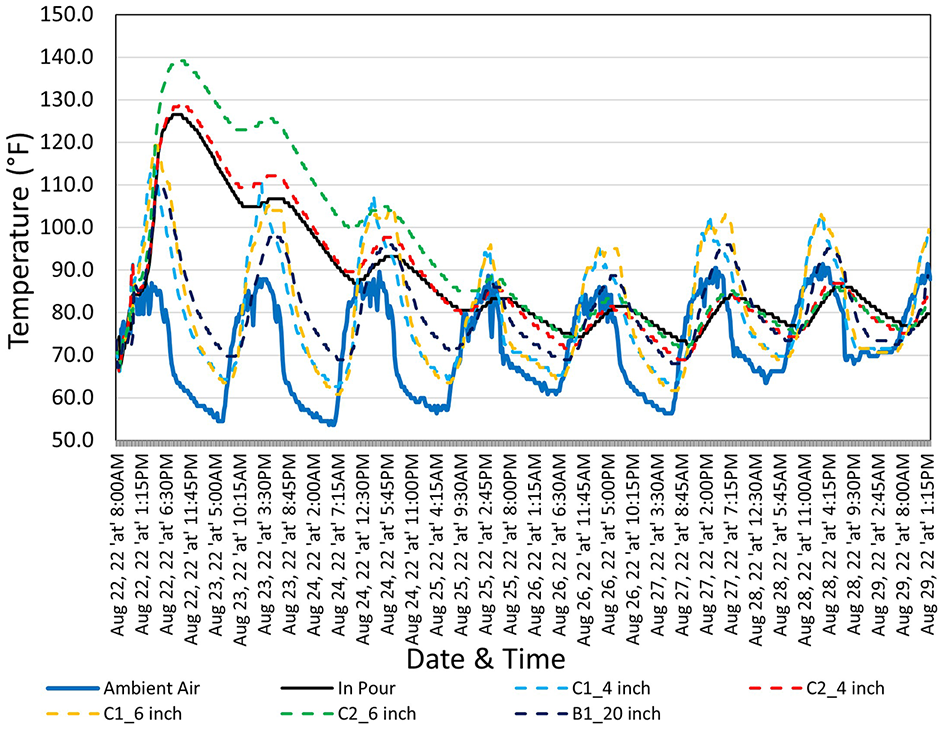
Figure 18 presents the variation of compressive strength of 100 mm (4 in.) and 150 mm (6 in.) cured cylinders with respect to curing days for the cast on August 22, 2022. Figure 19 presents the variation of flexural strength of method #B1 cured beams for casts on July 21, August 11, and August 22, 2022. Figure 20 shows the variation of the temperature inside the beams and the in-pour temperature for the July 21 cast. Figures 21 and 22 show the variation of the temperature inside the cured cylinders and beams and the in-pour and ambient air temperatures for the August 11 and August 22 casts, respectively. The compressive strength results from the August 11 cast using stage II mix are presented in Figure 12.
Compressive strength of 100 mm (4 in.) and 150 mm (6 in.) cylinders for the cast on August 22, 2022.
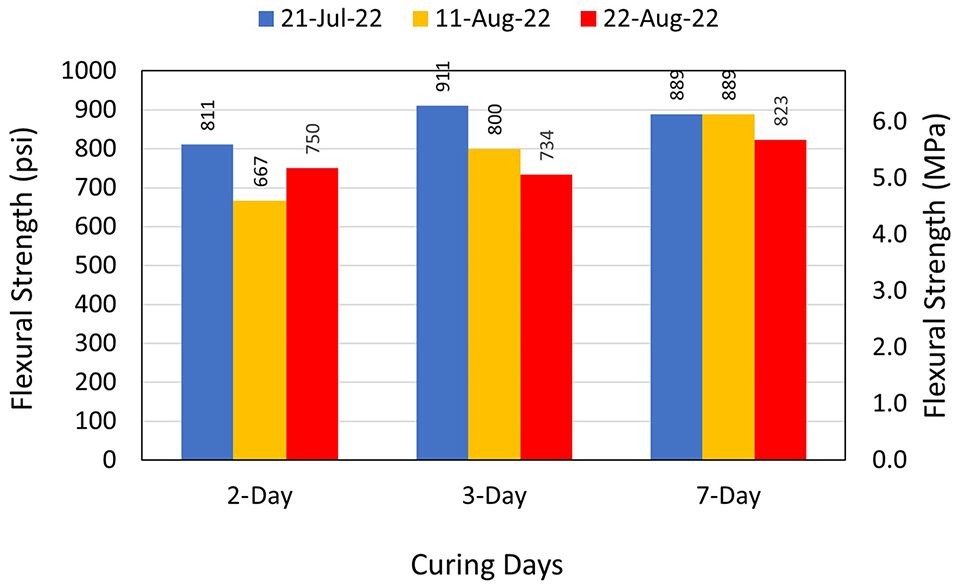
Flexural strength of 500 mm (20 in.) beams using method #B1 (ambient air) for the July and August 2022 cast.
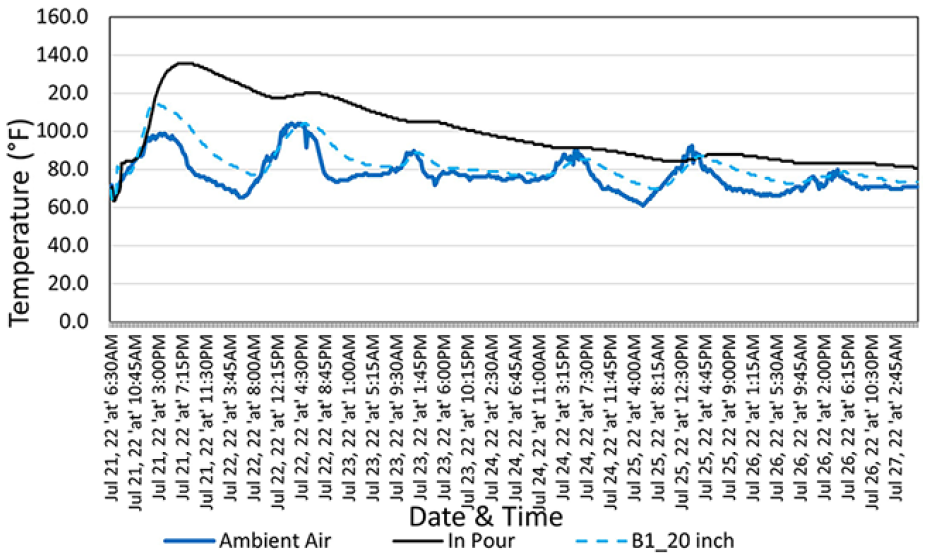
Temperature variation with time of specimens for the cast on July 21, 2022.
Temperature variation with time of specimens for the cast on August 11, 2022.
Temperature variation with time of specimens for the cast on August 22, 2022.
Figure 18 demonstrates that method #C1 estimated the lowest 2-day, 3-day, and 7-day strength among both methods. This could be attributed to the low temperature inside cylinders cured using method #C1 (Figure 22). For both 100 mm (4 in.) and 150 mm (6 in.) specimens, concrete showed strength greater than the required compressive strength of 24 MPa (3,500 psi) on day 2. According to Figure 19, concrete showed flexural strength greater than the required flexural strength of 4.5 MPa (650 psi) on day 2 for all casts on July 21, August 11, and August 22, 2022.
For casts on May 20, 2022, and August 11, 2022, four 100 mm (4 in.) and three 150 mm (6 in.) cylinders were kept in the same cooler and cured using method #C2. Then, specimens were tested after three days of curing. The results are presented in Figure 12. Both 100 mm (4 in.) and 150 mm (6 in.) specimens provided approximately similar compressive strength. This could be attributed to the similar temperature variation inside 100 mm (4 in.) and 150 mm (6 in.) specimens, as shown in Figure 15 for the cast on May 20, 2022, and Figure 21 for the cast on August 11, 2022. Note that 100 mm (4 in.) and 150 mm (6 in.) cylinders produced slightly higher temperatures than the in-pour temperature for casts on May 20, 2022 (Figure 15) and August 11, 2022 (Figure 21). Using method #C2 could result in overestimation of in-place strength. For both 100 mm (4 in.) and 150 mm (6 in.) specimens, concrete showed compressive strength greater than the required compressive strength of 24 MPa (3,500 psi) on day 3.
For the cast on August 22, 2022, Figure 22 shows that both 100 mm (4 in.) and 150 mm (6 in.) cylinders cured using method #C2 provided slightly higher temperatures compared with the in-pour temperature. This could result in overestimation of in-place strength.
Statistical Analyses
Correlation Analysis
The research discussions above presented the specimens’ strengths and changes because of temperature variations and curing method designs. The following correlation analysis examines the strength and curing method relationships between different types of test specimens. The purpose was to improve the understanding of the linear or nonlinear correlation models so that practitioners can perform reliable comparisons of concrete strengths when using different cylinder diameters or estimate early flexural strengths using early compressive strengths. The compressive and flexural strengths of 210 specimens (105 specimens were poured on October 1, 2021, and 105 specimens were poured on February 25, 2022) were analyzed to develop correlations.
A pair of (x, y) coordinates was plotted to help understand the correlation between the two variables. For example, taking the compressive strength of a 100 mm (4 in.) cylinder as the x coordinate and the compressive strength of a 150 mm (6 in.) cylinder as the y coordinate, a pair of (x, y) coordinates was generated for the group of experimental results collected from the concrete cylinders cured using method #C1. These pairs of coordinates can be plotted on a scatter chart for correlation analysis. The correlation analyses presented in this study implemented a crossmatching method to create coordinate pairs. Using crossmatching can significantly increase the number of data points for a scatter plot chart. The approach can help increase validation accuracy and reduce the possibility of model overfitting ( 12 ).
After crossmatching, the individually extracted results were verified as correct. Then, the individual data files were combined into one Microsoft Excel file to analyze the correlations. The correlations analysis aimed to find out whether there are linear or nonlinear relationships between the strengths of the group of 100 mm (4 in.) cylinders, the group of 150 mm (6 in.) cylinders, and the group 500 mm (20 in.) beams using methods #C1, #C2, and #B1. Several linear and nonlinear correlation models were tried, and four indicators—R2, root-mean-square error (RMSE), mean absolute error (MAE), and mean absolute percentage error (MAPE)—were used to examine the performances of the correlation equations.
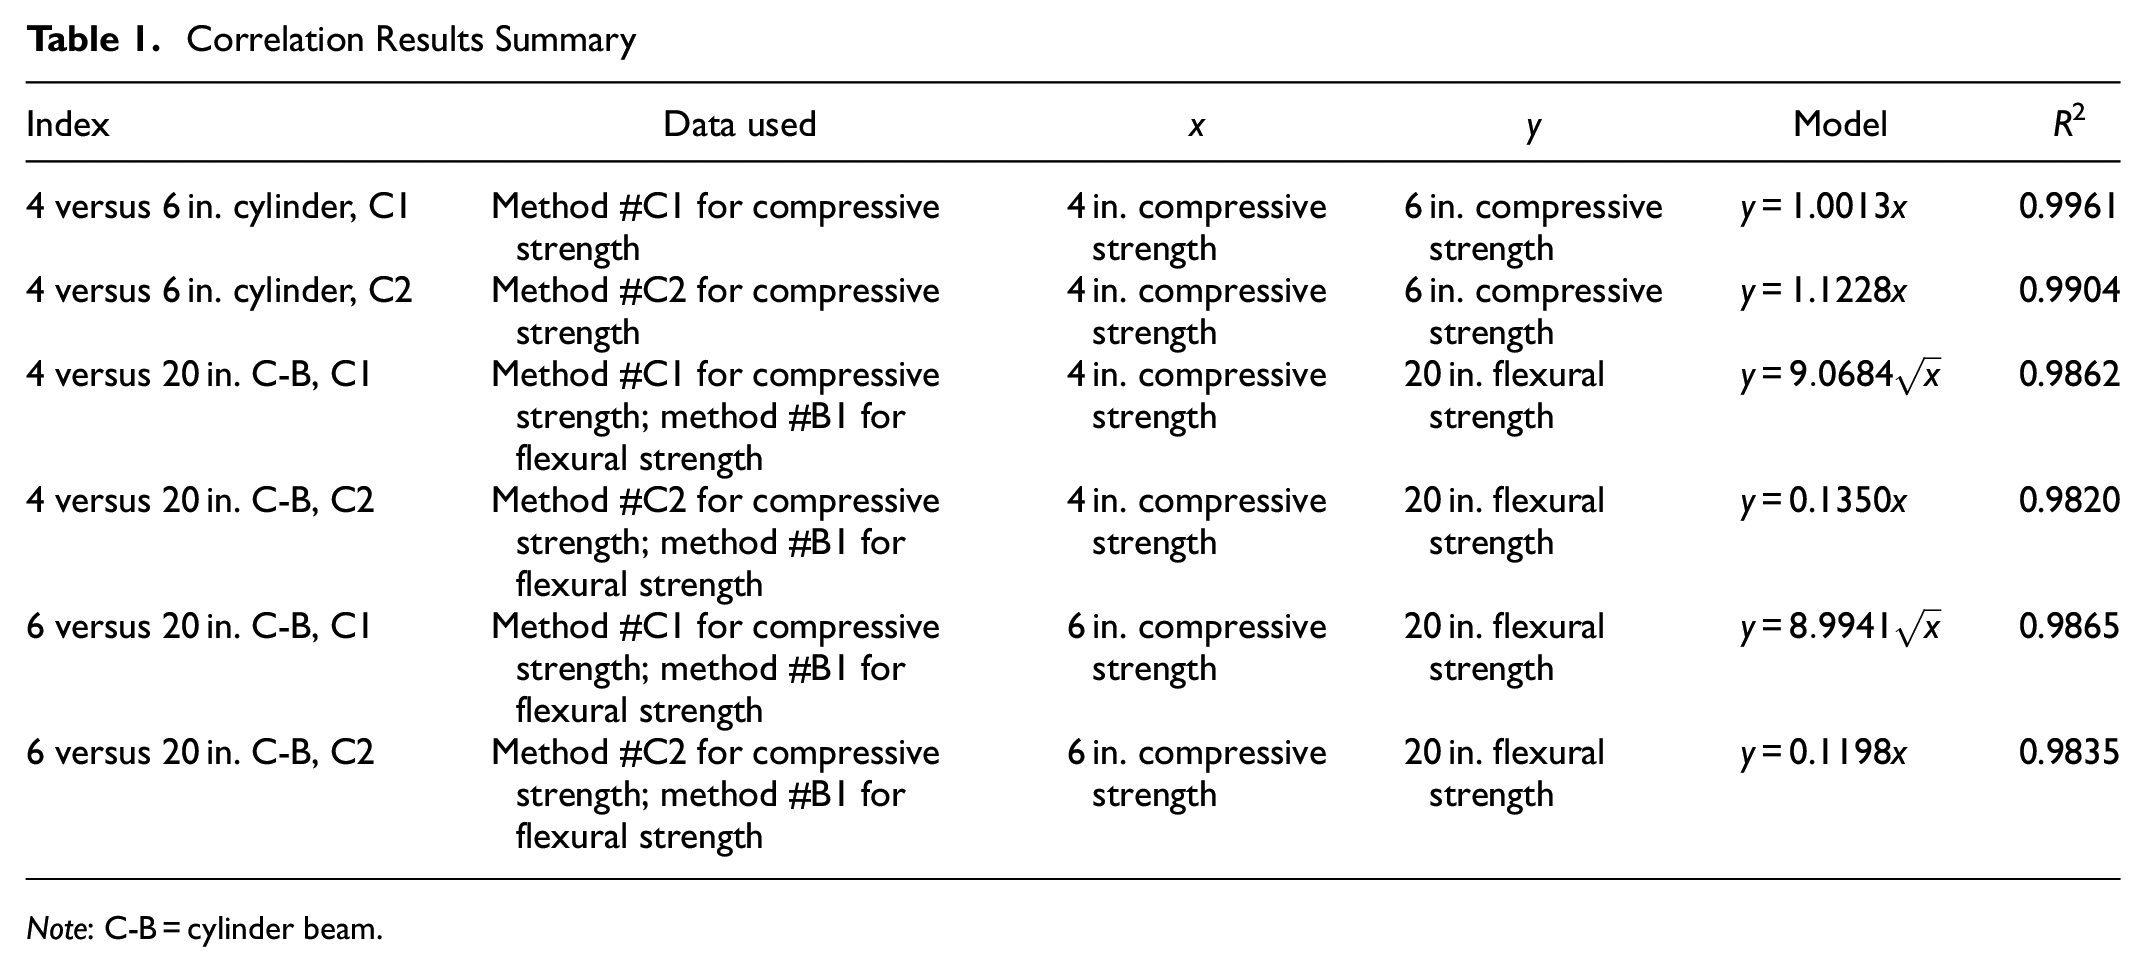
Table 1 summarizes the results of the best correlations found with only the R2 value reported as a performance indicator. As discussed by Chicco et al. ( 13 ), R2 measurements are informative for correlation and regression analysis evaluation. Refer to Solanki and Xie ( 11 ) for additional details on correlation analysis and the measurements that were used to compare the precisions of the correlation estimates. The evaluation results in Table 1 indicate that it is reliable to compare the compressive strengths of 100 mm (4 in.) cylinders and 150 mm (6 in.) cylinders when they are cured in ambient air in direct sunlight (using method #C1) or gang cured in an insulated box (using method #C2).
Correlation Results Summary
Note: C-B = cylinder beam.
Hypothesis Testing
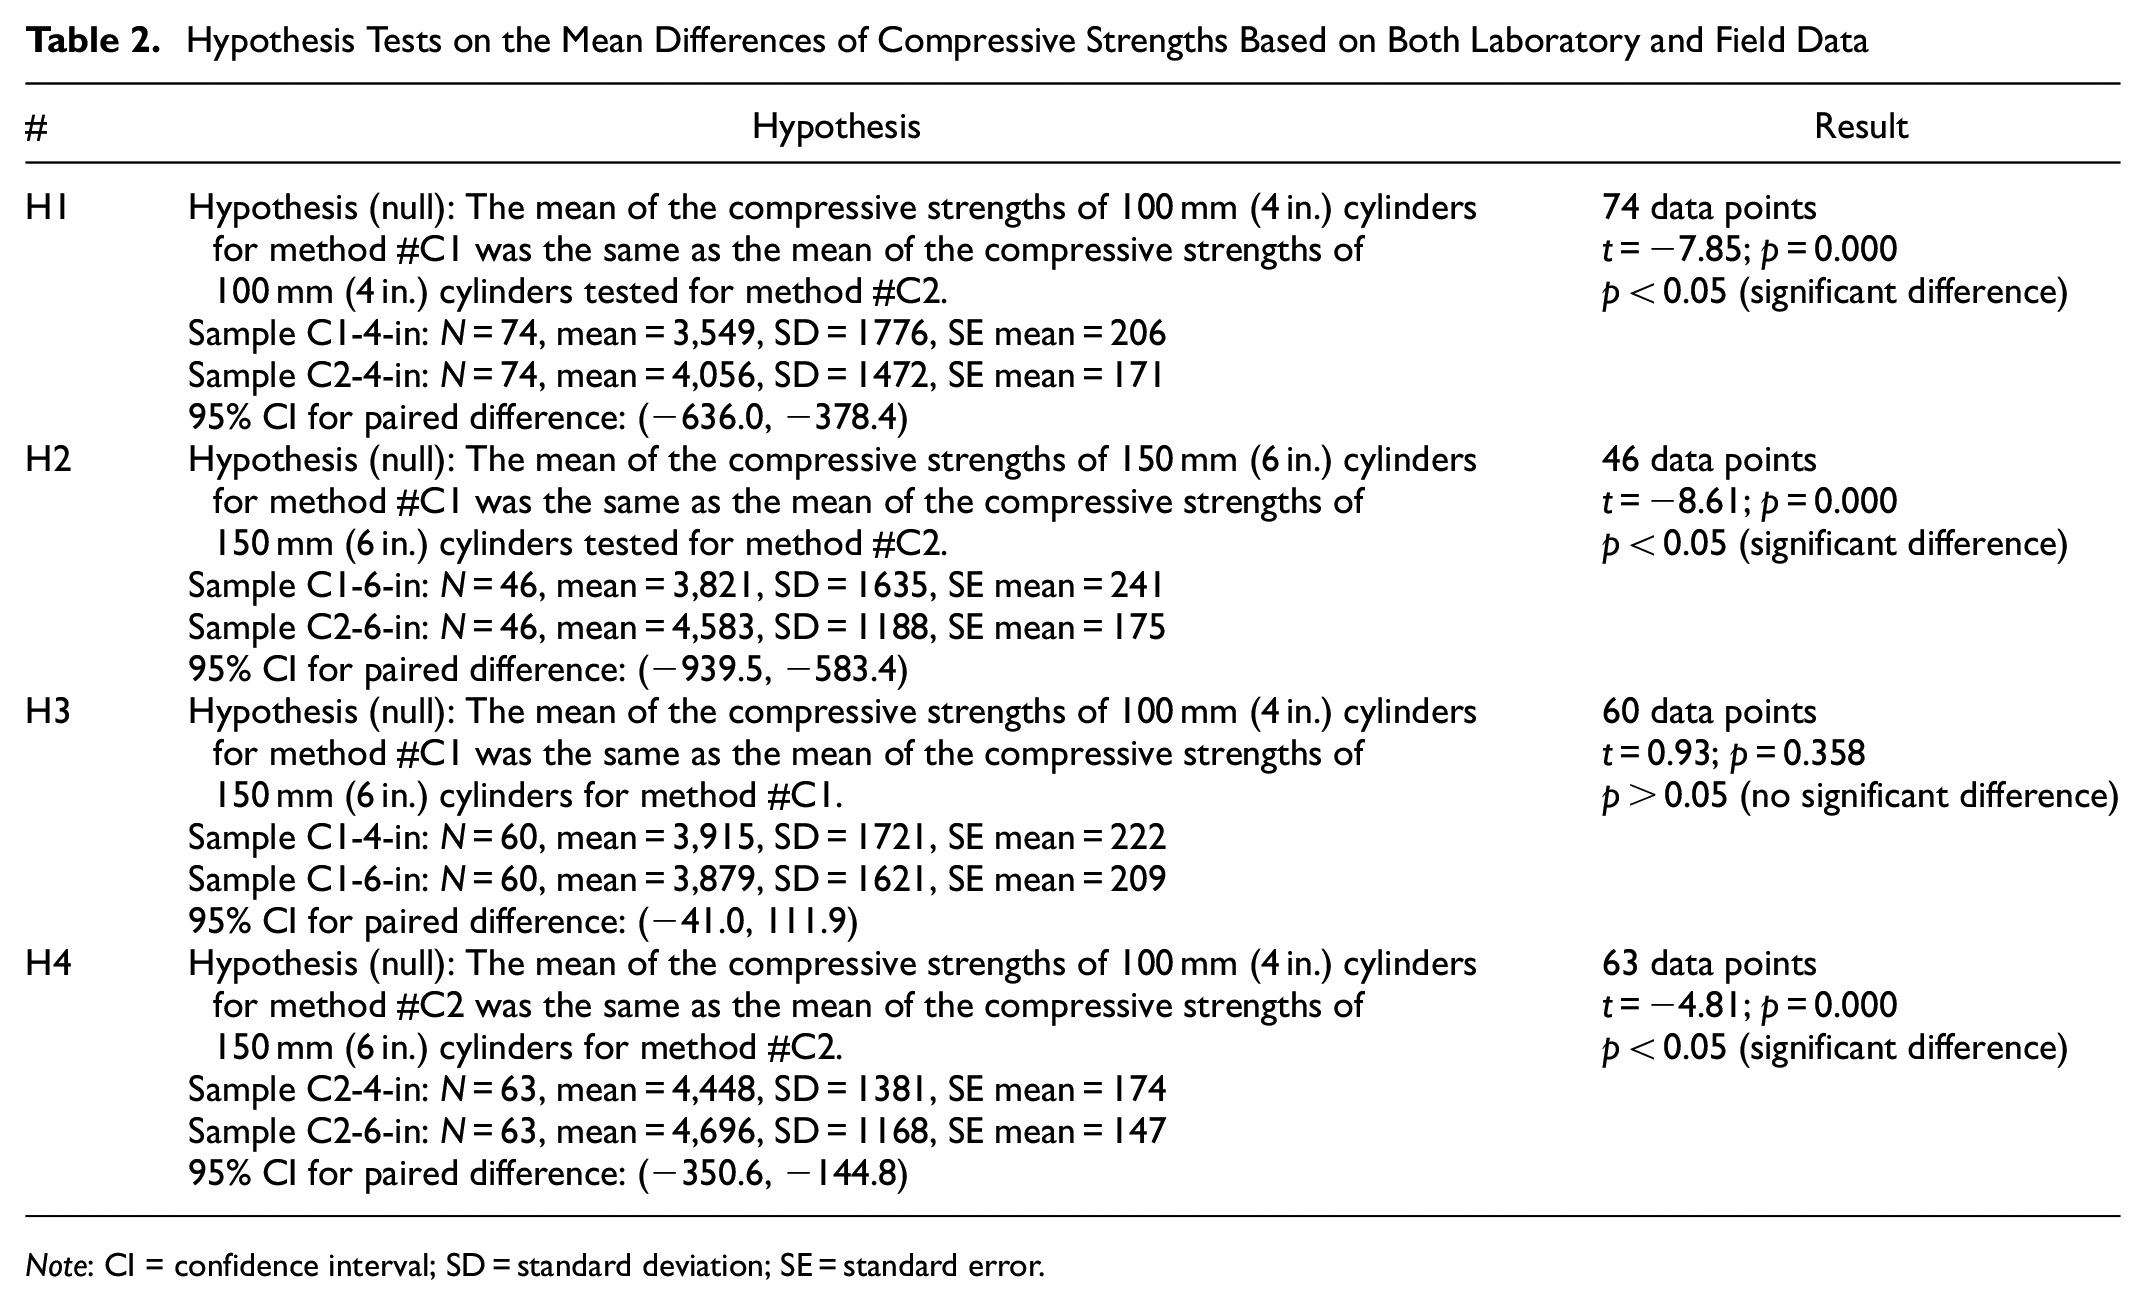
Both laboratory and field data were used to compare curing methods #C1 and #C2. A total of four hypotheses (H1–H4) were tested using a paired t-test (confidence interval = 95%), and the results are presented in Table 2. Each null hypothesis states that all means are equal. The corresponding alternative hypothesis is that the means are not equal. The significance level is 0.05. If a calculated p-value is greater than 0.05, the corresponding null hypothesis is accepted (i.e., no difference). Otherwise, the null hypothesis is rejected, and the alternate hypothesis is accepted (i.e., significant difference).
Hypothesis Tests on the Mean Differences of Compressive Strengths Based on Both Laboratory and Field Data
Note: CI = confidence interval; SD = standard deviation; SE = standard error.
Table 2 shows whether there are significant differences in compressive strength when the cylinders were cured using methods #C1 and #C2. In general, 100 mm (4 in.) cylinders have different means of compressive strength when using method #C1 versus method #C2. Similarly, the means of compressive strength of 150 mm (6 in.) cylinders are different when using method #C1 versus method #C2. Cylinder sizes, whether 100 mm (4 in.) or 150 mm (6 in.), make no difference to the compressive strength when using method #C1. However, cylinder sizes of 100 mm (4 in.) and 150 mm (6 in.) make a significant difference to the compressive strength when using method #C2.
The assumption of the paired t-test is that the differences of the pairs are approximately normally distributed. However, the samples were not sufficiently large (N < 30) to justify the use of paired t-tests based on the central limit theorem. Therefore, a nonparametric test (Mann–Whitney U-test) was performed on the laboratory data to compare two independent samples when the data are not normally distributed and the sample size is small. The Mann–Whitney U-test is used to analyze whether two samples are likely to derive from the same population. The following hypotheses (H5–H19) were tested using a paired t-test (confidence interval = 95%) for comparing curing methods:
Method #C1 (ambient air) versus #C2 (insulated box)
• H5: The compressive strengths of cylinders cured using method #C1 and tested on day 1 are significantly different from the compressive strengths of the cylinders cured using method #C2 and tested on day 1. • H6: The compressive strengths of cylinders cured using method #C1 and tested on day 3 are significantly different from the compressive strengths of the cylinders cured using method #C2 and tested on day 3. • H7: The compressive strengths of cylinders cured using method #C1 and tested on day 7 are significantly different from the compressive strengths of the cylinders cured using method #C2 and tested on day 7.
Method #C2 (insulated box) versus CIP (concrete slab)
• H8: The compressive strengths of cylinders cured using method #C2 and tested on day 1 are significantly different from the compressive strengths of the CIP cylinders and tested on day 1. • H9: The compressive strengths of cylinders cured using method #C2 and tested on day 3 are significantly different from the compressive strengths of the CIP cylinders and tested on day 3. • H10: The compressive strengths of cylinders cured using method #C2 and tested on day 7 are significantly different from the compressive strengths of the CIP cylinders and tested on day 7.
Method #C2 (insulated box) versus #C3 (power-operated box)
• H11: The compressive strengths of cylinders cured using method #C2 and tested on day 1 are significantly different from the compressive strengths of the cylinders cured using method #C3 and tested on day 1. • H12: The compressive strengths of cylinders cured using method #C2 and tested on day 3 are significantly different from the compressive strengths of the cylinders cured using method #C3 and tested on day 3. • H13: The compressive strengths of cylinders cured using method #C2 and tested on day 7 are significantly different from the compressive strengths of the cylinders cured using method #C3 and tested on day 7.
Method #C3 (power-operated box) versus CIP (concrete slab)
• H14: The compressive strengths of cylinders cured using method #C3 and tested on day 1 are significantly different from the compressive strengths of the CIP cylinders and tested on day 1. • H15: The compressive strengths of cylinders cured using method #C3 and tested on day 3 are significantly different from the compressive strengths of the CIP cylinders and tested on day 3. • H16: The compressive strengths of cylinders cured using method #C3 and tested on day 7 are significantly different from the compressive strengths of the CIP cylinders and tested on day 7.
Method #C1 (ambient air) versus CIP (concrete slab)
• H17: The compressive strengths of cylinders cured using method #C1 and tested on day 1 are significantly different from the compressive strengths of the CIP cylinders and tested on day 1. • H18: The compressive strengths of cylinders cured using method #C1 and tested on day 3 are significantly different from the compressive strengths of the CIP cylinders and tested on day 3. • H19: The compressive strengths of cylinders cured using method #C1 and tested on day 7 are significantly different from the compressive strengths of the CIP cylinders and tested on day 7.
Table 3 shows the analysis results of Mann–Whitney U-tests. The results labeled H5a, H6a, …, and H19a in Table 3 are from hypotheses tests using both October 2021 and February 2022 data. The results labeled H5b, H6b, …, and H19b are from hypotheses tests using only October 2021 data. The results labeled H5c, H6c, …, and H19c are from hypotheses tests using only February 2022 data. The following observations can be made from the results presented in Table 3:
The compressive strengths of cylinders cured using methods #C1 and #C2 have a significant difference on day 1 for both October 2021 and February 2022 data, have a significant difference on day 3 only for February 2022 data, and have no significant difference on day 7 for both October 2021 and February 2022 data.
The compressive strengths of cylinders cured using method #C2 and CIP cylinders have no significant difference on day 1, day 3, and day 7 for both October 2021 and February 2022 data. This indicates that method #C2 is a good representation of the strength of an in-place concrete item.
The compressive strengths of cylinders cured using methods #C2 and #C3 have a significant difference on day 1 and day 3 only for February 2022 data and have no significant difference on day 7 for both October 2021 and February 2022 data.
The compressive strengths of cylinders cured using method #C3 and CIP cylinders have a significant difference on day 1 only for February 2022 data and have no significant difference on day 3 and day 7 for both October 2021 and February 2022 data. This indicates that method #C3 is not a good representation of the day 1 strength of an in-place concrete item in cold weather.
The compressive strengths of cylinders cured using method #C1 and CIP cylinders have significant differences on day 1 and day 3 for all the datasets and have no significant difference on day 7. This indicates that method #C1 is not a good representation of the day 1 or day 3 strengths of an in-place concrete item.
Test Result Analysis Categorized by Testing Days, Curing Methods, and Cast Seasons
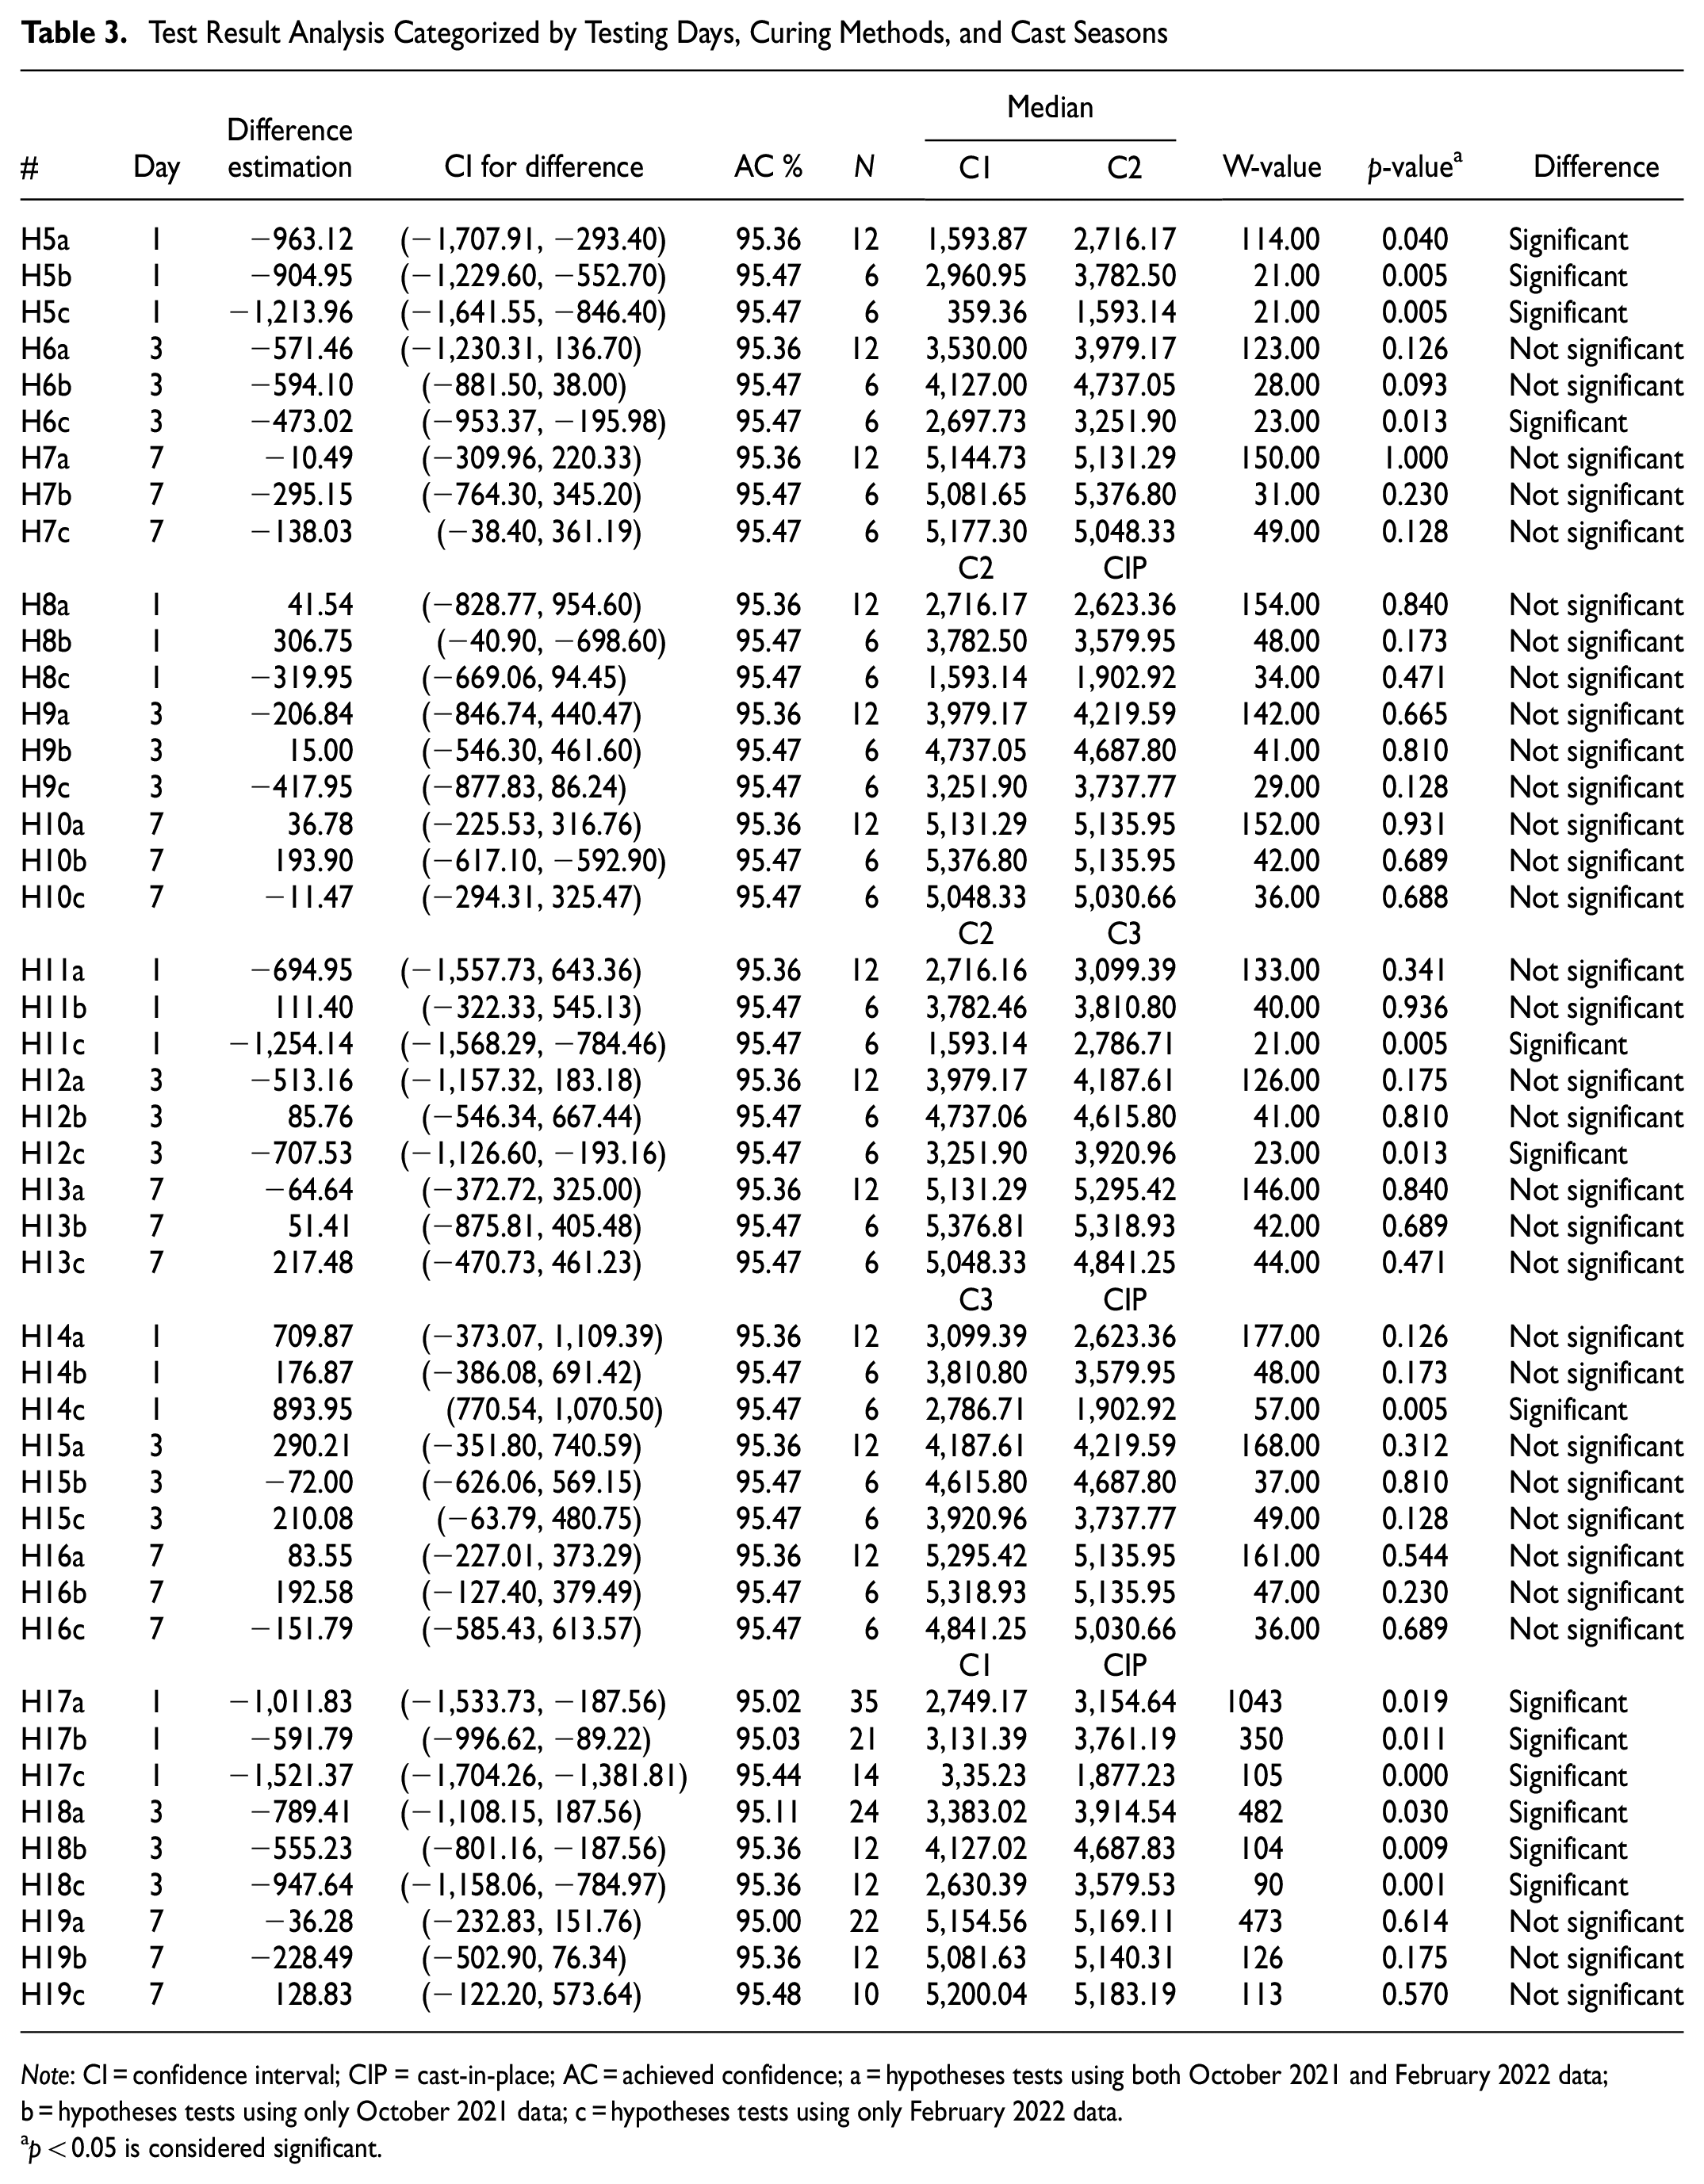
Note: CI = confidence interval; CIP = cast-in-place; AC = achieved confidence; a = hypotheses tests using both October 2021 and February 2022 data; b = hypotheses tests using only October 2021 data; c = hypotheses tests using only February 2022 data.
p < 0.05 is considered significant.
Conclusions and Recommendations
Laboratory Data
Ambient air curing (method #C1) of 100 mm (4 in.) cylinders and 150 mm (6 in.) cylinders underestimated early strength (1–3 days) of an in-place concrete item within 81%–89% for the October 2021 cast (3-day ambient air temperature ranging between 15.5°C and 35.5°C [59.9°F and 95.9°F]) and within 16%–70% for the February 2022 cast (3-day ambient air temperature ranging between −10.5°C and 13.0°C [13.1°F and 55.4°F]).
Insulated box curing (method #C2) of 100 mm (4 in.) cylinders and 150 mm (6 in.) cylinders estimated early strength (1–3 days) of an in-place concrete item within an acceptable range of 95%–110% and 105%–108%, respectively, for the October 2021 cast. For the February 2022 cast, insulated box curing (method #C2) of 100 mm (4 in.) cylinders underestimated early strength of an in-place concrete item within 66%–78%, and curing of 150 mm (6 in.) cylinders estimated strength within an acceptable range of 100%–102%. Therefore, only 150 mm (6 in.) cylinders cured using method #C2 may be a good option for estimating the early strength of an in-place concrete item in cold weather (3-day ambient air temperature ranging between −10.5°C and 13.0°C [13.1°F and 55.4°F]). This observation was further supported by statistical analysis.
Power-operated box curing (method #C3) of 100 mm (4 in.) cylinders and 150 mm (6 in.) cylinders estimated early strength of an in-place concrete item within an acceptable range of 99%–107% for the October 2021 cast. For the February 2022 cast, the power-operated box (method #C3) overestimated early strength within the unacceptable range of 101%–148%. Therefore, method #C3 may not be a good option for estimating early strength in cold weather. This observation was further supported by statistical analysis.
Ambient air curing of 100 mm (4 in.) cylinders and 150 mm (6 in.) cylinders (method #C1) estimated 7-day strength of an in-place concrete item within the acceptable range of 94%–101% and 101%–105% for the October 2021 and February 2022 casts, respectively. However, 150 mm (6 in.) cylinders cured using either insulated box curing (method #C2) or the power-operated box (method #C3) slightly overestimated 7-day strength of an in-place concrete item.
For both the October 2021 and February 2022 casts, ambient air (method #B1) and insulated plywood box (method #B2) curing of beams underestimated the strength of concrete because of the relatively low temperature inside beams compared with an in-place concrete item strength indicated by CIP cylinders.
Field Data
The early strength estimated by insulated box (method #C2) cylinders was higher than the corresponding early strength estimated by ambient air curing of cylinders (method #C1). The percent difference in the strength of cylinders for methods #C1 and #C2 was higher for 2-day strength followed by 3-day strength. The 7-day strength estimated by method #C2 was approximately similar or less than the corresponding strength estimated by method #C1.
Method #C1 provided higher temperature differences between the cured cylinders and the in-pour temperature compared with the corresponding difference between method #C2 cylinders and the in-pour concrete temperature. This finding indicates that method #C2 cylinders mimic the in-pour temperature better than method #C1 cylinders.
Beams experienced the lowest temperature among all the cured specimens tested, and the temperature was lower than the in-pour temperature and similar to ambient air temperature. Therefore, beams may not be a good strength indicator of in-place concrete strength.
Recommendations
For estimating the in-place strength of concrete items using field-cured cylinders, only an insulated box should be used for curing when the National Weather Service forecast for the construction area predicts an air temperature below 70°F (21°C) during the first 24 h. An acceptable insulated box is a 5-day chest cooler. A power-operated box for field curing specimens is not recommended.
Footnotes
Author Contributions
The authors confirm contribution to the paper as follows: study conception and design: Pranshoo Solanki; data collection: Pranshoo Solanki and Haiyan Xie; analysis and interpretation of results: Pranshoo Solanki and Haiyan Xie; draft manuscript preparation: Pranshoo Solanki. All authors reviewed the results and approved the final version of the manuscript.
Declaration of Conflicting Interests
The author(s) declared no potential conflicts of interest with respect to the research, authorship, and/or publication of this article.
Funding
The author(s) disclosed receipt of the following financial support for the research, authorship, and/or publication of this article: This was work was supported by ICT-R27-219: Influence of Field-Curing Conditions on Strength of Concrete Test Specimens. ICT-R27-219 was conducted in cooperation with the Illinois Center for Transportation; the Illinois Department of Transportation; and the US Department of Transportation, Federal Highway Administration.