
Abstract
To optimize the power and economic performance of battery electric passenger vehicles, an 8.5-m-long battery electric passenger vehicle was selected as the research subject. The simulated-annealing particle-swarm-optimization (SAPSO) algorithm was applied to optimize the two-speed gearbox and transmission ratio of the vehicle. With the opening of the accelerator pedal and speed as variables, a comprehensive gear shift schedule that considered both the power and economic performance was established. The comprehensive gear shift schedule curve was defined in the model built in the ADVISOR software. The transmission ratio was jointly optimized using the ADVISOR and ISIGHT software, and then the ADVISOR simulation software was used to analyze the economic and dynamic performances corresponding to the optimized transmission ratio. Finally, we compared the power and economic performances of the vehicle before and after transmission ratio optimization, the results of which showed that after the optimization, the maximum speed, climbing gradient, and 0–50 km/h acceleration time of the vehicle were greatly improved, and the driving range was slightly shortened. This enabled performance advantages of the battery electric passenger vehicle by balancing the power and economic performances of the vehicle.
Introduction
With the rapid development of human civilization, the energy crisis and environmental pollution have become increasingly serious. Consequently, great importance has been attached to battery electric vehicles because they are environmentally friendly, energy saving, and lightweight. The transmission system, which directly determines the comprehensive efficiency of a vehicle, is an important component of a battery electric vehicle. Lyu et al. 1 studied the aging and energy consumption of electric vehicle batteries and proposed to optimize the two-speed transmissions of electric vehicles with the vehicleeconomy as an indicator. The simulation and comparison of a two-speed transmission and a single-speed transmission showed that the two-speed transmission performed better in terms of battery life and energy consumption, which would improve the economy and battery life of a vehicle. Wang et al. 2 proposed an electric vehicle system efficiency model that combined a detailed model of the two-speed dual-clutch transmission system efficiency loss with the electric vehicle power system model and designed an electric vehicle that included a motor, transmission ratio, and shifting rules. The powertrain model was built using the MATLAB/Simulink software and the genetic algorithm. Testing results showed that the overall performance of the electric vehicle was improved after the transmission ratio was optimized.
The transmission ratio, as an important parameter of the transmission system, has an important influence on the power performance, service life, and motor life of battery electric vehicles. 3 To improve the power and economic performances of battery electric vehicles, it is of great significance to optimize the transmission ratio of the transmission system. Spanoudakis et al. 4 proposed a method to reduce the energy consumption of electric vehicles by optimizing the gear ratio of a single-speed gearbox. They designed three different gear ratios for a specific vehicle model, built a simulation model in Carmaker, and performed simulations. In addition, an experimental vehicle was used to carry out a 10-lap running test on an actual road. Finally, it was found that the lower gear ratio improved the economic performance of the electric vehicle. Zang et al. 5 optimized the transmission ratio of a three-speed transmission and conducted a simulation test on the prototype vehicle under the U.S. Urban Road Cycle Condition (UDDS). After optimizing the transmission ratio, it was found that compared with the energy consumption of a single-speed reducer, the energy consumption of the prototype of the three-speed transmission was reduced by 9.3%. Huang et al. 6 proposed a two-speed transmission based on a dual planetary gear transmission mechanism to optimize the transmission ratio of electric vehicles using the NSGA-II algorithm for the indirect problem of high-performance electric vehicle power loss. The results showed that the two-speed transmission had several advantages over the single transmission ratio, performed better in terms of the acceleration time and energy consumption, and had higher practical application value. Gao et al. 7 proposed a method to study clutch friction. Their study was based on electric vehicles, and a new two-speed reverse manual automatic transmission (I-AMT) was designed, which connected the two-speed transmission with the drive motor. The electric vehicle model was based on the software AMESim and used dynamic programming to optimize the transmission ratio. Their results showed that the economies of the electric vehicles improved. These studies all focused on the optimization of the energy consumption of electric vehicles, but they did not simultaneously optimize the power performance and the vehicle economy.
Kwon et al. 8 proposed a multi-objective optimization method for the transmission ratio and driving parameters of a dual-motor two-speed power transmission system and established a dual-motor two-speed transmission model. The transmission ratio and motor drive were optimized by a multi-objective optimization method. The allocation of parameters was optimized to improve the driving efficiency of the motor and effectively weigh the efficiency and performance of the motor. Huang et al. 9 proposed an intuitive transmission ratio optimization design method, with the transmission ratio as a parameter and energy utilization as the optimization goal. By analyzing the basis of the gear setting, the method was able to achieve the power performance required for urban road conditions. The transmission ratio was optimized under this condition. The simulation results showed that the optimized transmission ratio could effectively improve the energy utilization rate of the vehicle to meet the road driving requirements. Zhou et al. 10 used a particle swarm optimization algorithm based on simulated annealing to optimize the transmission ratio of a pure electric vehicle. By introducing weight coefficients, the specific energy consumption and power factor of the driving conditions were used as the optimization objective function, and the power of the vehicle was selected as the constraint condition to optimize the transmission ratio of the drive train. The results showed that the specific energy consumption of the vehicle was reduced after optimization, and the power factor of the vehicle was significantly improved. The above studies accounted for the dynamics of the car while optimizing the car economy. However, they focused on the optimization of the transmission ratio and did not take into account the influence of the shifting schedule.
Li et al. 11 proposed a power train optimization method based on the genetic algorithm, which optimized the drive parameters of the motor while optimizing the transmission ratio, and they formulated dynamic and economical shifting rules. The results showed that when optimizing the transmission ratio and motor drive parameters, a selected performance indicator of the electric vehicle, such as the power, economy, or comprehensive performance, could be improved by formulating a proper shift schedule. Ahssan et al. 12 proposed an energy-saving shift strategy suitable for complex road conditions, which minimized the energy consumption of electric vehicles without affecting their performances in complex road conditions. The pattern search method and gradient descent method were used to optimize the shifting schedule and transmission ratio in the Simulink environment. The results showed that the optimization could reduce power consumption, thereby increasing the driving range. Mortezeri-Gh et al. 13 proposed an optimal shifting strategy for hybrid vehicles and optimized the transmission ratio of AMT parallel hybrid vehicles. The ADVISOR software was implemented using genetic algorithms to conduct joint simulations. The simulation results showed that the fuel economy of hybrid electric vehicles was significantly improved after the optimization. By formulating a proper shifting schedule, the drive motor of a pure electric passenger car equipped with a multi-speed transmission can operate in the high-efficiency state as much as possible, improving the vehicle’s power and economy. Therefore, it is of great significance to study the optimization of the transmission ratio under consideration of the shifting rules.
The China city bus driving condition (CHTC-B) is a driving condition for city buses with a maximum design total mass greater than 3500 kg. In this study—under the CHTC-B conditions, with the main reduction ratio and the first-gear and second-gear transmission ratios as variables—an objective function taking into account both the power and economic performances of the vehicle was established. Using the simulated-annealing particle swarm optimization (SAPSO) algorithm, the transmission ratio was then optimized based on a gear shift schedule designed to balance the power and economic performance. Finally, the optimization results were analyzed using a simulation model.
Basic parametersofbattery electric passenger vehicleandparameter matchingof motor
Basic parameters
Abattery electric passenger vehicle with a two-speed gearbox was selected as the research object in this study. We matched the parameters for the drive motor based on the main parameters and designed performance indices of the vehicle. 14 Table 1 shows the basic parameters and performance indices of the battery electric passenger vehicle.
Basic parameters and performance indices of the vehicle.

Parameter matching of motor
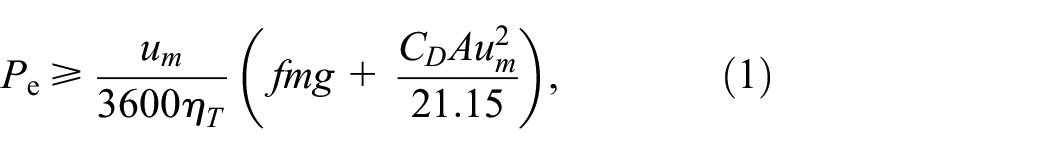
The rated characteristics of a motor are the working characteristics that enable the motor to achieve thermal balance within the allowable range and then continue running efficiently for a long period. Considering the overload capacity of the motor, the power required by the vehicle to drive at the highest speed on the horizontal road was taken as the lower limit of the rated power of the motor 15 :
where
The peak working characteristics of the motor were closely related to the acceleration and climbing performance of the battery electric vehicle, and the peak power of the motor should supply the power demanded by the vehicle during climbing and acceleration 16 :


where
The maximum speed of battery electric vehicles is only 69 km/h. According to the power and peak revolution speed of the motor, a permanent magnet brushless DC (direct current) motor 17 was used in this study, with the main parameters shown in Table 2.
Main parameters of the motor.

The experimental data was imported into MATLAB, and the efficiency of the drive motor was obtained using the difference method 18 (Figure 1). In Figure 1, the color spectrum on the right side of the figure is the efficiency value corresponding to the motor. The colored areas are a collection of working points of the motor. In areas of the same color, the motor had the same motor working efficiency, and the motor’s working efficiency increased from the dark blue area to the crimson area. When the working point of the motor was in the crimson area, the working efficiency of the motor reached its peak of 96%. To reduce the energy consumption of the vehicle, the working points of the motor should be located as far as possible in the high-efficiency area.

Motor efficiency.
The external characteristics of the motor are shown in Figure 2, where Torque Curve shows the torque characteristics of the motor and Power Curve shows the power characteristics of the motor. Within the low-revolution-speed range (0–1600 r/min), the torque characteristic curve of the drive motor remained constant with the increase in the revolution speed, and the power characteristic curve increased as the revolution speed increased. At this point, the motor generated constant torque to provide the vehicle with sufficient power and backup power in low-speed conditions, such as when starting, accelerating, and climbing. When the revolution speed was greater than 1600 r/min, the torque characteristic curve of the motor gradually declined with the increase in the revolution speed, and the output torque was no longer constant. When the revolution speed ranged from 1900 to 4500 r/min, the power characteristic curve of the motor remained constant with the increase in the revolution speed, and the power output by the motor was constant, which assisted the vehicle in maintaining its stability while moving at high speeds.

Motor external characteristics.
Establishment of mathematical optimization model
Determination of optimization variables
We determined the basic parameters of the vehicle and the parameters of the drive motor. The total speed ratio of the transmission system will eventually affect the power and efficiency of the battery electric vehicle, 19 and thus, it is particularly important for optimizing the transmission ratio. 20 In this study, the main reduction ratios of the transmission system as well as the first-gear and second-gear transmission ratios were taken as the optimization variables, and the design variable was expressed as follows:

where i0, ig1, and ig2 denote the main decelerator, first-gear, and second-gear transmission ratios, respectively.
Determination of optimization objective function
To balance the dynamic and economic performances of the vehicle, the dynamic performance objective function was established based on the time required to accelerate from 0 to 50 km/h, and the economic performance objective function was established based on the energy consumption or the driving range of the vehicle within a specific driving cycle. In this study, the economic performance objective function was established based on the driving range under CHTC-B conditions.
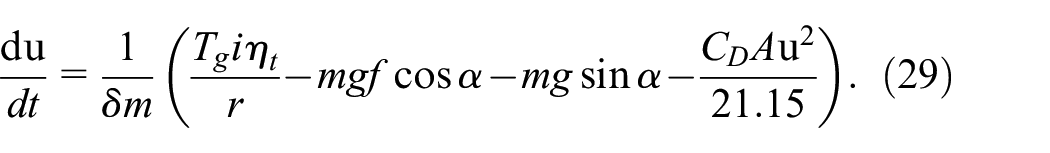
The time required for the vehicle to accelerate from the original start to a certain speed was calculated based on the following kinematic equations:


where
Thus, the following power performance sub-objective function of the battery electric vehicle was obtained:

where
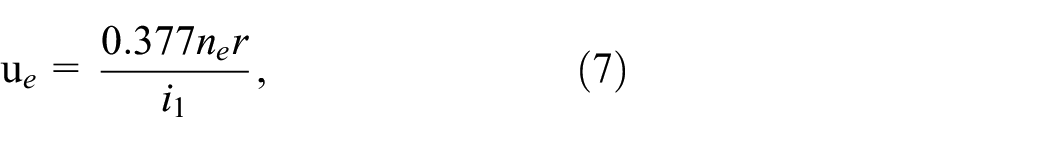
At time t within the driving cycle, the revolution speed of the drive motor was


where
The torque of the motor

where
Based on the above equations, if the battery pack generates power at time t, then, the power output at time t, can be expressed as follows:

where
If the battery electric vehicle is in a state of recovering energy,

Based on equations (13) and (14), P(t), the power of the battery at time t, is expressed as follows:

where
The energy consumed under the CHTC-B conditions, , is calculated as follows:

Therefore, the economic performance the objective function is as follows:

The objective function considering both the power and economic performances was obtained by weighting the power performance and economic performance objective functions:

where
Establishment of constraint conditions
The power performance indices of the vehicle mainly included the maximum speed, the maximum climbing gradient, and the acceleration time. The economic performance of the vehicle was mainly indicated by the driving range. According to the design requirements of the vehicle, the transmission ratio was constrained by the following conditions:
(1) Limited by the adhesive force, the upper limit of the total first-gear transmission ratio was determined as follows:
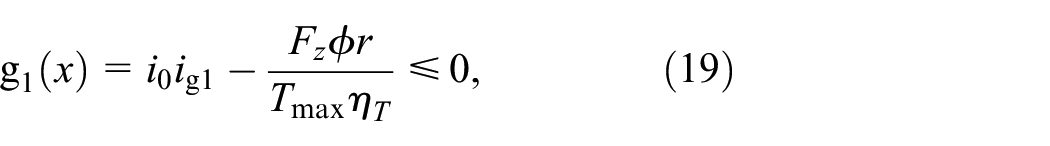
where
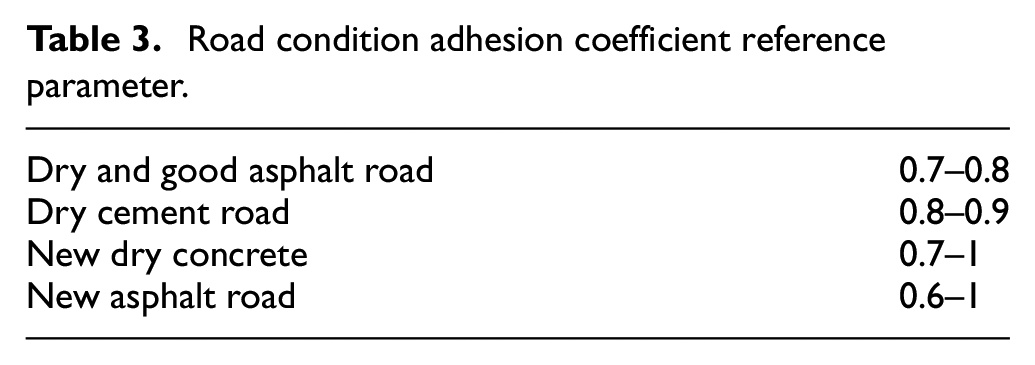
Different road conditions have different adhesion coefficients, and water on the pavement will reduce the adhesion coefficient. Based on the adhesion coefficients for the various road conditions in Table 3, the adhesion coefficient was taken as 0.75. 22
(2) Based on the maximum climbing gradient and the maximum output torque

(3) Based on the maximum stable speed

(4) Based on the maximum speed of the vehicle and the maximum rated torque

(5) There is a limit to the number of gear teeth. The number of gear teeth cannot be less than 17. If it is less than 17, a follow-up cut will occur, and the gear will subsequently be displaced. The number of gear teeth is generally not more than 40. The upper limit of the number of gear teeth depends on the processing capacity. An increase in the number of gear teeth will result in an accuracy that does not meet the processing requirements. To improve the stability of the transmission and reduce the impact during the transmission, the number of gear teeth is generally 20–40.
Road condition adhesion coefficient reference parameter.
Optimization algorithm
A two-speed transmission for pure electric passenger cars was optimized to improve the power and economy in this study. There are many current optimization algorithms, and the different algorithms have different advantages. For example, the gray wolf optimization algorithm is suitable for dealing with local optimization and low-complexity problems, with strong convergence and high accuracy. 23 The transmission ratio optimization of electric buses belongs to a multi-objective optimization problem. The optimized results of general optimization methods have an impact on the selection of the transmission ratio. For pure electric passenger vehicle transmission ratio optimization problems, multi-objective optimization, fast running speeds, and good convergence can be achieved using the SAPSO.
Figure 3 shows the calculation flow of the SAPSO algorithm as follows:
(1) Initialize a swarm of random particles.
(2) Calculate the fitness value related to each particle and store the calculated results corresponding to the position of the particle in
(3) Determine the initial temperature of the particle swarm and calculate a suitable value of

(4) Apply the roulette strategy to find the global optimal alternative value


where
(5) Calculate the new fitness value of each particle and update
(6) Annealing operation. When the speed and position differences of a specific particle reach the preset values, stop the search and output the results; otherwise, go back to Step (3).

Flow chart of the simulated-annealing particle swarm optimization (SAPSO) algorithm.
Vehicle dynamics simulation platform
ADVISOR was developed in the MATLAB and Simulink software environment. It was originally used to help DOE develop the power systems of hybrid electric vehicles, and then it was gradually expanded to be able to quickly analyze the various performances of traditional cars, pure electric vehicles, and hybrid electric vehicles. A vehicle dynamic simulation model 24 consisting of the battery, drive motor, gearbox, main decelerator, and wheels was created in MATLAB/Simulink (Figure 4).

Simulink model of a battery electric passenger vehicle.
Formulation of gear shift schedule
Many studies on transmission ratio optimization have been carried out in China and around the world.25,26 However, most of them failed to consider the influence of the gear shift schedule on the transmission ratio optimization, except for a fixed-gear decelerator, which did not involve gear shifting. For different speed ratio combinations, the objective function was calculated based on a fixed gear shift schedule, which decreased the optimization accuracy to a certain extent. To enable the full capabilities of the battery electric passenger vehicle, the optimal gear shift schedule must be determined based on the working state of the drive motor. According to the objective of optimizing the driving performance, the gear shift schedule was divided into the gear shift schedule for optimal power performance and the gear shift schedule for optimal economic performance. Most studies explored only one of the gear shift schedules, and there was no optimization effect. We applied a gear shift schedule that accounted for both the power and economic performance, 27 with the vehicle speed and opening of the accelerator pedal serving as the gear shift control parameters in this study.
Formulation of gear shift schedule for power performance
The principle for formulating the best dynamic up shift law was as follows. For the same accelerator pedal opening, if the acceleration curves of two adjacent gears intersect, then the intersection is used as the shift point. If the acceleration curves of the adjacent two gears do not intersect, then the highest vehicle speed of each gear is taken as the shift point, that is, the optimal dynamic shifting law satisfies the following condition:

Based on equation (26), the formulation method of the best dynamic shifting schedule can be obtained using the mapping method.
(1) The car driving equation is as follows:

where
The following formula can be obtained:

From equation (28), the following expression of the acceleration and speed of pure electric passenger cars can be obtained:
From the shifting condition, the following formula can be obtained:

where u1 denotes the first gear speed, and u2 denotes the second gear speed.
The acceleration curves of different gears for each accelerator pedal opening were obtained using the equations above. Figure 5 shows the selection of the shift points for the power shift law. The intersection of the acceleration curves of two adjacent gears was the best power shift point. If the acceleration curves did not intersect, the power shift point was selected according to the boundary point principle.
(2) The obtained shift points (u, a) were fitted to obtain a u-a curve, which was the shift curve of first and second gear.

Selection of shift points for power shift law.
The best power shift point calculated according to the above steps is shown in Table 4.
Optimal power shift speed.

For the same opening of the accelerator pedal, if there was an intersection point in the acceleration curves of two adjacent gears, the intersection point was used as the gear shift point. If there was no intersection point in the acceleration curves of two adjacent gears, the maximum speed of each gear was taken as the gear shift point. To prevent cyclic gear shifting, the interval between the upshift curve and the downshift curve was set as 5 km/h. 28
Based on the principle of selecting the shear shift point for the optimal power performance, the gear shift schedule curve for optimal power performance was obtained (Figure 6). In Figure 6, the points on the black curve are the points where second gear was shifted to first gear for different openings of the acceleration pedal, and the points on the red curve are where first gear was shifted to second gear. The corresponding abscissa of each point was the gear shift speed, and the ordinate was the opening of the acceleration pedal. In this study, the speed corresponding to the gear shift point of the battery electric passenger vehicle varied from 24 to 27 km/h. As the opening of the accelerator pedal gradually increased, the speed of the vehicle during gear shifting generally increased. When the accelerator pedal was 80% open, the speed of the vehicle was slightly reduced to 24.3 km/h, which was related to the selection of the intersection point in the acceleration curves of two adjacent gears. Such a gear shifting schedule curve ensures that the gear can be smoothly shifted for different openings of the accelerator pedal to improve the power performance of the vehicle.

Gear shift schedule curve for optimal power performance.
Formulation of gear shift schedule for economic performance
Based on the efficiency model of the drive motor, the motor was highly efficient near the rated point, and the farther the operating point was from this point, the less efficient the motor was. The formulation principle of the gear shift schedule for the optimal economic performance was to make the motor operate in the high-efficiency area all the time.
The curve of the speed and motor efficiency for a certain accelerator pedal opening can be obtained using Figure 1. The intersection of the speed and efficiency curves of two adjacent gears was the best economic shift point. Figure 7 shows the speed efficiency curve of first and second gear for each accelerator pedal opening.
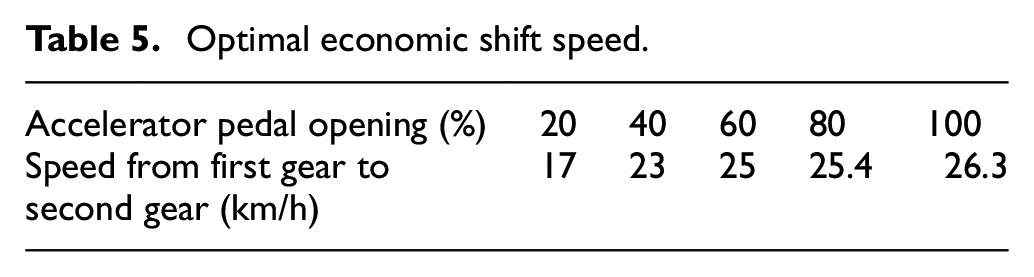
Based on the method described above, the optimal economic shift speed was obtained, as shown in Table 5. Compared with the best power up shift point, the best economical up shift point had a lower vehicle speed. To avoid frequent shifts and shift cycles, an equal delay downshift strategy was adopted based on the best economical up shift rule. The downshift delay of the high gear was larger than that of the low gear for the same accelerator pedal opening degree, and the downshift vehicle speed of gear 2 to gear 1 was −5 km/h. Figure 8 shows the best economic shifting curve.

Diagram of selecting gear points for economical shifting schedule.
Optimal economic shift speed.

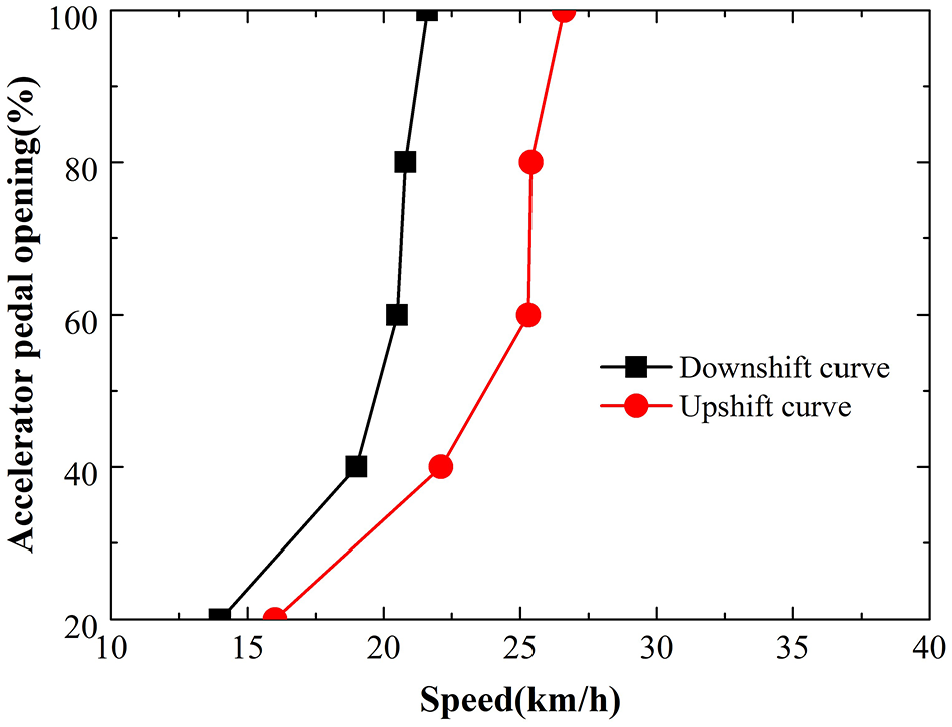
Gear shift schedule curve for optimal economic performance.
Based on the method described above, the gear shift schedule curve for the optimal economic performance was obtained (Figure 8). The points on the black curve correspond to gear shifts from second gear to first gear for different openings of the acceleration pedal, and the points on the red curve are shifts from first gear to second gear. The x-axis is the gear shift speed, and the y-axis is the opening of the acceleration pedal. In this study, the speed corresponding to the gear shift points of the battery electric passenger vehicle varied from 14 to 25 km/h. As the opening of the accelerator pedal gradually increased, the speed of the vehicle during gear shifting significantly increased as well. Such a gear shifting schedule curve ensures that the gear can be smoothly shifted for different openings of the accelerator pedal to improve the economic performance of the vehicle.
Formulation of gear shift schedule for comprehensive performance
The gear shift schedule for comprehensive performance was formulated based on the following principle. The gear shift schedule curve for optimal economic performance was applied when the drive motor operated in the low-load working area, and the gear shift schedule curve for optimal power performance was adopted when the motor operated in the high-load working area. As the motor operated in the medium-load working area, the gear shift schedule curve for optimal economic performance was switched to the gear shift schedule curve for optimal power performance. Hence, we obtained the gear shift schedule curve for optimal comprehensive performance, as shown in Figure 9, where the red line represents the up shift curve and the black line denotes the downshift curve. Each point on the black curve in Figure 9 corresponds to shifting from second gear to first gear for different openings of the acceleration pedal, and the points on the red curve are where first gear shifted to second gear, with the abscissa of each point being the gear shift speed and the ordinate being the opening of the acceleration pedal. As the opening of the accelerator pedal increased, the shift speed gradually increased from 16 to 27 km/h, and the shift delay speed during up shifting and downshifting increased from 3 to 5 km/h, which prevented repeated gear shifting at high speeds and reduced the wear of the transmission system during gear shifting. Furthermore, the gear shift schedule curve for optimal comprehensive performance ensured smooth gear shifting for different openings of the accelerator pedal, thereby improving the power and economic performance of the vehicle.
Gear shift schedule curve for optimal comprehensive performance.
A dynamic shifting process was developed using the proposed method based on the maximum acceleration. The energy utilization efficiency of the whole vehicle was considered to determine the optimal motor efficiency and the most economical shifting process. The formulation method was analyzed, and the final selection was based on the actual situation. Two-parameter dynamic and economical shifting processes were formulated, and then a comprehensive shifting process was established by curve fitting.
Joint simulation optimization
Transmission ratio before and after optimization
Figure 10 shows the flow chart of the joint optimization, which was implemented using the ADVISOR and ISIGHT software. A simulation model of the battery electric passenger vehicle was built in ADVISOR, and the ISIGHT software was used for joint simulations. The SAPSO algorithm was used for the iterative operation until the simulation model converged. During the joint simulation and optimization, after 1800 iterations, the transmission ratio in the transmission system of this battery electric passenger vehicle gradually tended to a stable value. Table 6 shows the transmission ratio before and after optimization.
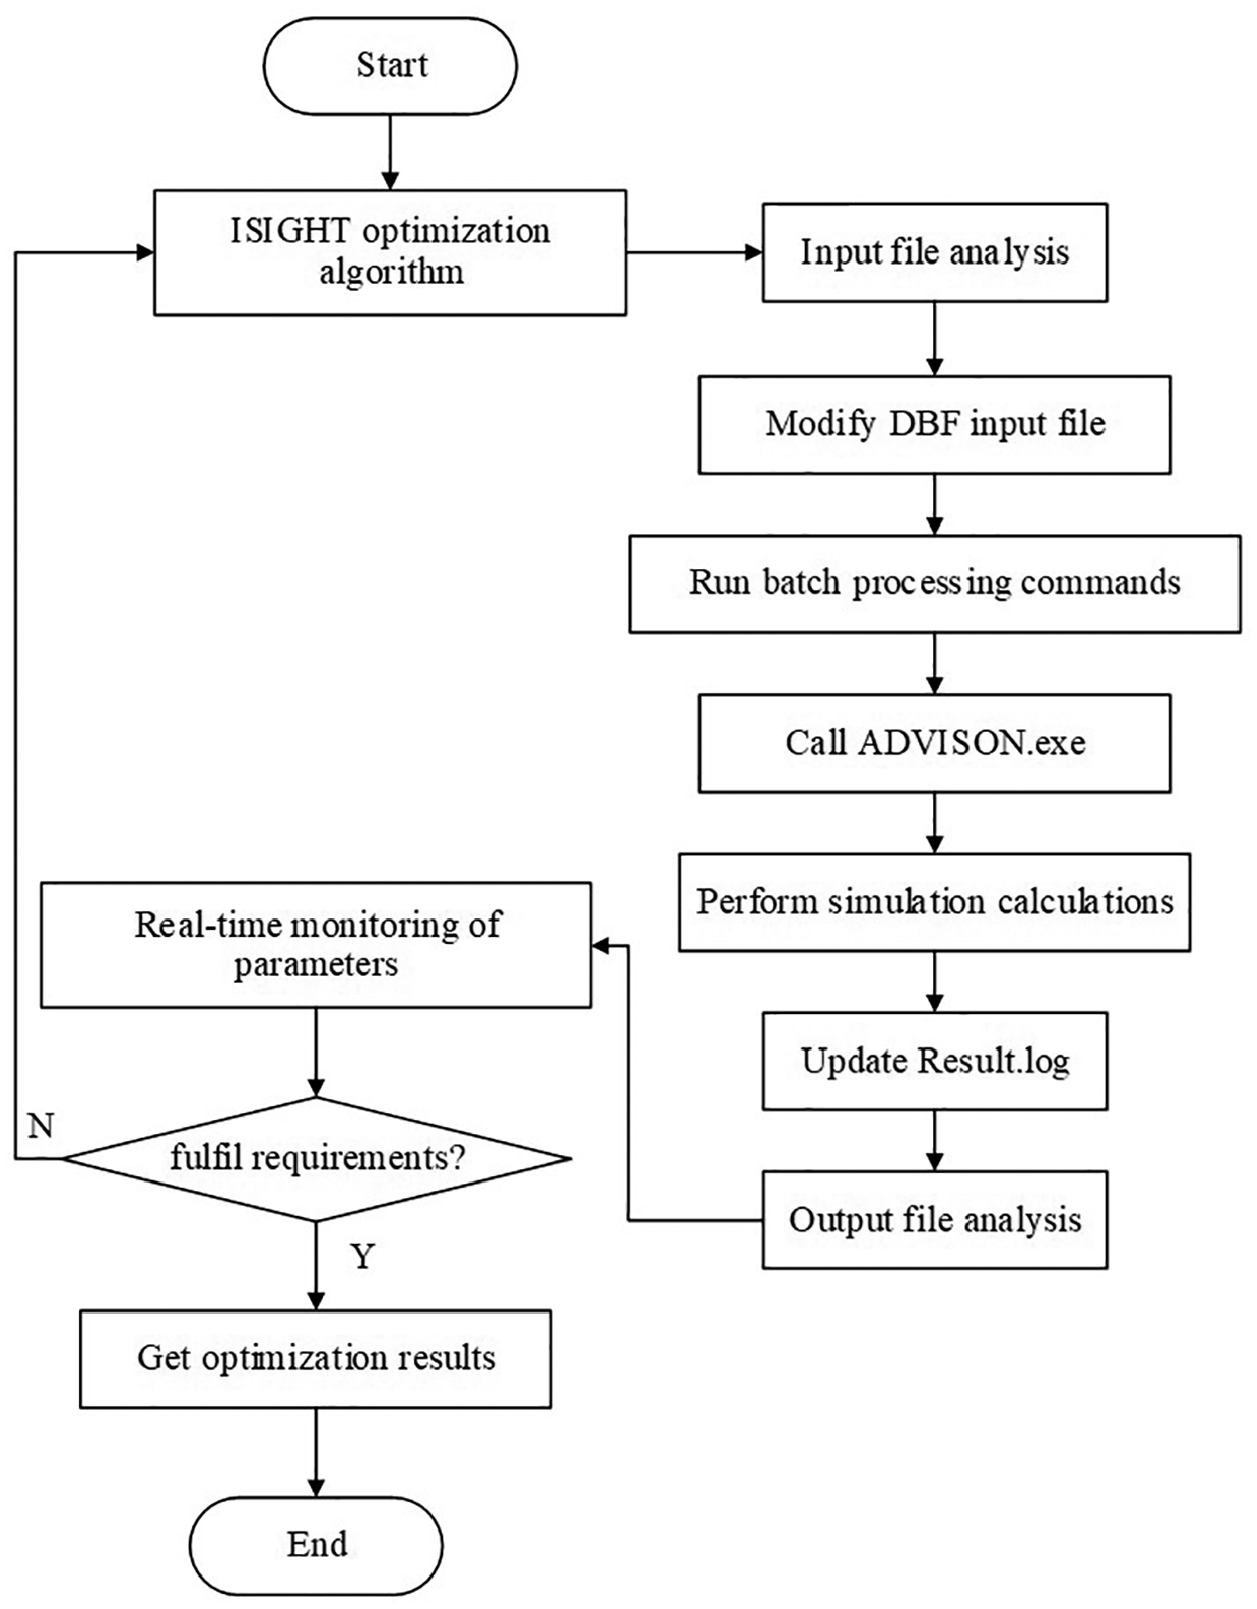
Joint optimization flow chart of ADVISOR and ISIGHT software.
Transmission ratio before and after optimization.

Simulation results
Based on the actual road conditions and the standard of battery electric vehicles in China, we simulated the power performance of the vehicle under the CHTC-B conditions, and the corresponding climbing gradient and acceleration time were calculated.
Figure 11 shows that the vehicle and road spectrum curve of the battery electric passenger vehicle agreed closely with the CHTC-B curve. From 637 to 639 s, the vehicle did not fully follow the road condition curve. Because of the frictional loss between the components of the transmission system, the efficiency of the motor was not high enough at specific moments. Consequently, the vehicle could not fully follow the road condition curve during the driving cycle. However, most of the time, it was in line with the actual working conditions.

Variation of speed with time under the CHTC-B conditions.
Only the transmission ratio simulation results after optimization are shown. Figure 12 shows the variation of the SOC value of the battery pack with time. Throughout the driving cycle from 0 to 1300 s, the SOC value of the battery pack dropped from 1 to 0.979, with the variation following the changes of the cyclic conditions, which was in line with the actual working conditions.

Variation of SOC value.
With the optimized transmission ratio, the battery electric vehicle achieved a maximum speed of 76.9 km/h, a 0–50 km/h acceleration time of 10.5 s, a climbing gradient of 24.1% at 20 km/h, and a driving range of 209.6 km. Different transmission ratios were then simulated to compare the power and economic performances of the vehicle (Table 7).
Comparison of simulation results.
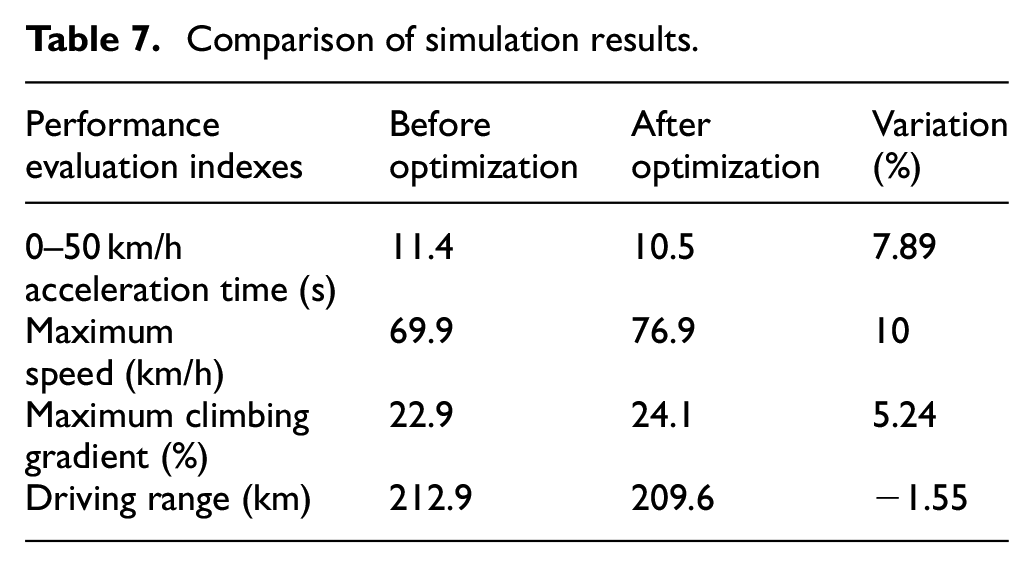
After optimization, the maximum speed of the battery electric vehicle was increased by 10%, the climbing gradient was improved by 5.24%, the 0–50 km/h acceleration time was shortened by 7.89%, and the driving range was reduced by 1.55%. Thus, after transmission ratio optimization, the power performance of the vehicle was significantly improved, although its economic performance was slightly impacted. Nevertheless, the power and economic performances were balanced, which verified the feasibility of optimizing the transmission ratio using the SAPSO algorithm, laying a solid foundation for similar studies in the future.
Conclusion
The current development of the electric vehicle transmission was analyzed, the transmission mode of the vehicle was determined, and the influence of the optimization of the transmission ratio of a two-speed pure electric vehicle on the power performance and economy was studied in this paper.
With a battery electric passenger vehicle with a two-speed gearbox as the research object, we matched the basic parameters for the drive motor according to the performance indices of the vehicle. Based on a preliminary analysis of the gear shift schedule for the optimal power performance and optimal economic performance, the opening of the accelerator pedal and the vehicle speed were selected as the parameters. To improve both the power and economic performances of the vehicle, a gear shift schedule was proposed to achieve the comprehensive performance based on the working characteristics of the drive motor.
With the transmission ratios of the main decelerator, first gear, and second gear as the variables, dual objective functions of the power and economic performances of the vehicle were established. Transmission ratio optimization was then carried out using the SAPSO algorithm and the ADVISOR and ISIGHT simulation software. The optimized transmission ratios of the gearbox were 3.2 and 1.48 for first and second gear, respectively, with the transmission ratio of the main decelerator being 5.8.
A simulation model of the battery electric vehicle was built in ADVISOR, and the optimized transmission ratio was used in the simulation model under CHTC-B conditions. The simulation results showed that after optimization, the maximum speed of the vehicle was increased by 10%, the climbing gradient was improved by 5.24%, the 0–50 km/h acceleration time was shortened by 7.89%, and the driving range was reduced by 1.55%, which not only verified the feasibility of optimizing the transmission ratio using the SAPSO algorithm but also provides a new method for future studies.
Footnotes
Handling Editor: James Baldwin
Declaration of conflicting interests
The author(s) declared no potential conflicts of interest with respect to the research, authorship, and/or publication of this article.
Funding
The author(s) disclosed receipt of the following financial support for the research, authorship, and/or publication of this article: This work supported by the Fujian Natural Science Foundation Project (No. 2020J01270) and the Scientific Research Climbing Project of Xiamen University of Technology (No. XPDKT18016).