
Abstract
The fastest way to decarbonise traction energy of a railway network is full electrification of the network. However, full electrification can be costly and is often delayed due to complicated planning procedures. Often, it is not financially viable to electrify certain sections of the network due to geographical challenges such as hillsides and requirements to raise or lower the tracks. Intermittent electrification can provide a way to reduce emissions on a route without fully electrifying it. This paper presents an optimal intermittent electrification strategy and compares its effects on required battery size to a ‘common-sense’ approach. The “common-sense” approach is a heuristic electrification method where high-power sections of the route are electrified first. Energy savings are demonstrated using a validated high-fidelity bi-mode train model on the Newbury-Plymouth route of Great Western Railway in the UK. Unlike prior research, the optimal electrification strategy considers energy consumptions for both directions of a journey on the route and is therefore optimal regardless of travel direction. The 278-km Newbury-Plymouth route was divided into 50 equal discrete sections for the optimization process, which then identified sections that should be prioritised for electrification as they consume the maximum energy. A high charge/discharge lithium titanite-oxide battery was modelled and installed on the virtual vehicle to determine the required battery sizing for given optimal percentages of intermittent electrification. The battery sizing strategy includes battery wear effects from charge/discharge cycle life and shows the battery life to be 1.42 years if kept at 55°C and 6 years if kept at 25°C. At 36% electrification, using the ‘common-sense’ approach, the battery weighs 10,500 kg and the battery-OLE train reduces the CO2 emissions and energy usage on the route by 83% when compared to the diesel-only train.
Keywords
Introduction
There has been an increasing effort worldwide in curbing net carbon dioxide emissions as their effects on the planet have become clear. In the UK, the rail transport sector is supporting this, 1 and the government aims to cease the sale of internal-combustion-only cars and remove all diesel-only railway traction by 2040.2,3
Current data shows that about 38% of UK’s mainline rail network is electrified. 4 Since electrified traction produces the lowest carbon emissions for rail transport in the UK, 5 decarbonising the sector requires most of the network to be electrified. In addition to reducing air pollution, electric traction provides faster, more reliable, and quieter services than diesel traction. 1 Furthermore, track electrification is the most suitable option compared to hydrogen and battery powered technologies for long-distance high speed and rail freight services since electric traction can provide higher power. 6 (Note that electrification in this work refers to railway network electrification — the addition of overhead line equipment — rather than vehicle electrification — the conversion of a vehicle from diesel-electric to overhead-electric only).
Since full electrification of the entire network costs £1 M/STK (single-track kilometre) to £2.5 M/STK, 6 the network may remain partially electrified for some time. This also means that only heavily used routes can currently justify the high cost of full electrification. To reduce emissions on a partially electrified network, other modes of traction such as hydrogen, on-board energy storage systems (ESSs) or bi-mode (electric-diesel) systems are necessary to provide traction power in unelectrified sections. They are also a near-term pathway to full electrification.
The traditional approach to electrification has been continuous electrification between stations to avoid prolonged loss of power supply. 7 Intermittent (sometimes called discrete or discontinuous) electrification is defined here as having one or more unelectrified sections in a journey between two stations. Continuous electrification presents a techno-economic challenge if the route includes tunnels or bridges that may require raising or lowering of the tracks, or if the tracks are laid on the side of hills or tight corners, 8 increasing the cost of electrification significantly. In such cases, intermittent electrification can be more suitable and cost-effective.
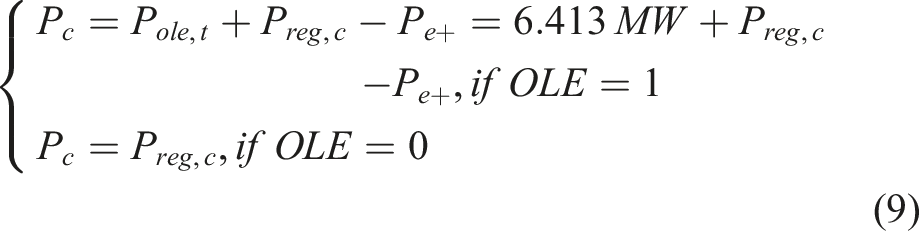
Bi-mode trains – those which can be powered from either overhead line equipment (OLE) or an onboard diesel engine-generator – have only recently become available in the UK. These allow operators to reduce the use of diesel-only trains on electrified track and open the possibility of intermittent electrification.
On-board ESS such as flywheels, batteries and supercapacitors are not only able to provide traction power in unelectrified sections, but can also assist primary traction during acceleration and hill climbing, regulate voltages from OLE, and help capture regenerative energy when the OLE is non-receptive9–17
Lithium-ion (Li-ion) batteries have become a popular choice for electric traction due to their high power and energy densities, robustness, and low life-cycle costs, among other characteristics13,16,17,18 Among different Li-ion chemistries, lithium-titanite (LTO) batteries stand out in vehicular applications due to their ultra-fast charging/discharging capability, chemical stability, and performance16,18,19 They are already widely used in electric buses and cars. In light railway applications, they are reported to be in use on trams in Konya, Turkey and in Santos, Brazil to provide traction in unelectrified sections of the routes or to provide emergency power supplies.16,20
In, 8 an electric multiple unit (EMU) train with an on-board ESS was simulated and was able to complete a 5-km unelectrified route. In, 7 a bi-mode and an electric train was able to complete the 7-km-long Severn Tunnel. The authors’ previous work in 21 used a high-fidelity model to demonstrate the advantages of optimal intermittent electrification in saving CO2 compared with diesel-only running. This work is novel in that it added a battery model to the high-definition model developed in, 21 and used this high-definition model to investigate optimal intermittent electrification of a route with off-wire battery running.
Li-ion battery technology also has the potential of replacing diesel trains on short routes.16,20 The East Japan Railway Company has been developing and testing battery-catenary hybrid trains to reduce the impact of diesel trains on unelectrified routes15,22,23 Simulation studies of an LTO battery have shown that they can replace a diesel-powered train on a 12 km route. 24 In 25 it was shown that having short sections of catenary at stations during vehicle acceleration significantly reduced the battery peak power (and hence, battery size). In this paper, this strategy is referred to as the ‘common-sense manual approach to optimal intermittent electrification’. The same authors have also studied the effect of partial charging at intermediate stations on reducing the battery capacity. 26
Although these previous works use dynamic models with resistance forces, only some model the gradient drag. Due to high vehicle mass, the gradient drag force can be considerable in railway vehicles, and not modelling it will therefore affect the accuracy of any estimations of peak power use and journey energy consumption. In addition to modelling the gradient drag, unlike previous rail vehicle models, the high-fidelity model used in this paper includes motor dynamics. This increased fidelity provides more accurate current, voltage and efficiency dynamics, and therefore more accurate energy calculations.
The train model is based on a Hitachi 5-car bi-mode train operating on the London Paddington to Plymouth route of the Great Western Rail company and was first developed and validated in. 27 The route being studied in this paper is the journey from Newbury to Plymouth, which is currently unelectrified and is a potential candidate for an electrification scheme. Building on the previous model, a model of an LTO battery is developed and installed on the train. The train is then run on the route to study the power consumption, journey energy, and the amount of regenerated energy captured by the battery. To develop an optimal electrification strategy, the route is divided into discrete sections to identify which sections of the route should be electrified first based on the maximum energy consumption, similar to the authors’ previous approach in. 21 In contrast to, 21 this work considers the energy consumption running both directions on the route, which represents a more holistic approach to route electrification. For given percentages of optimal electrification, minimal battery sizes that allow the train to complete the journey are determined. Considering the wear effect of the battery pack, its life cycle characteristics are also analysed and incorporated into determining the final optimal battery sizes. Lastly, the energy savings achieved from optimal intermittent electrification and battery installation are presented.
Rail vehicle model
An overview of the original vehicle model is given in.
27
In this work, the model has been extended by removing the diesel engine and replacing it with a battery and including a DC/DC converter (see Figure 1). Timetable data for the journey was obtained from OpenTrainTimes.
28
The speed limits on the route were taken from the Network Rail sectional appendices for June 2019 for given sections along the route.
29
The timetable block is responsible for producing the desired train velocity using the speed limit, position, arrival, and departure time variables at each station. If a vehicle is late into a station, it will command the vehicle to remain in the station for at least 1 minute. All simulations ensure the train arrives at the final station on time. Power flow diagram of the battery train.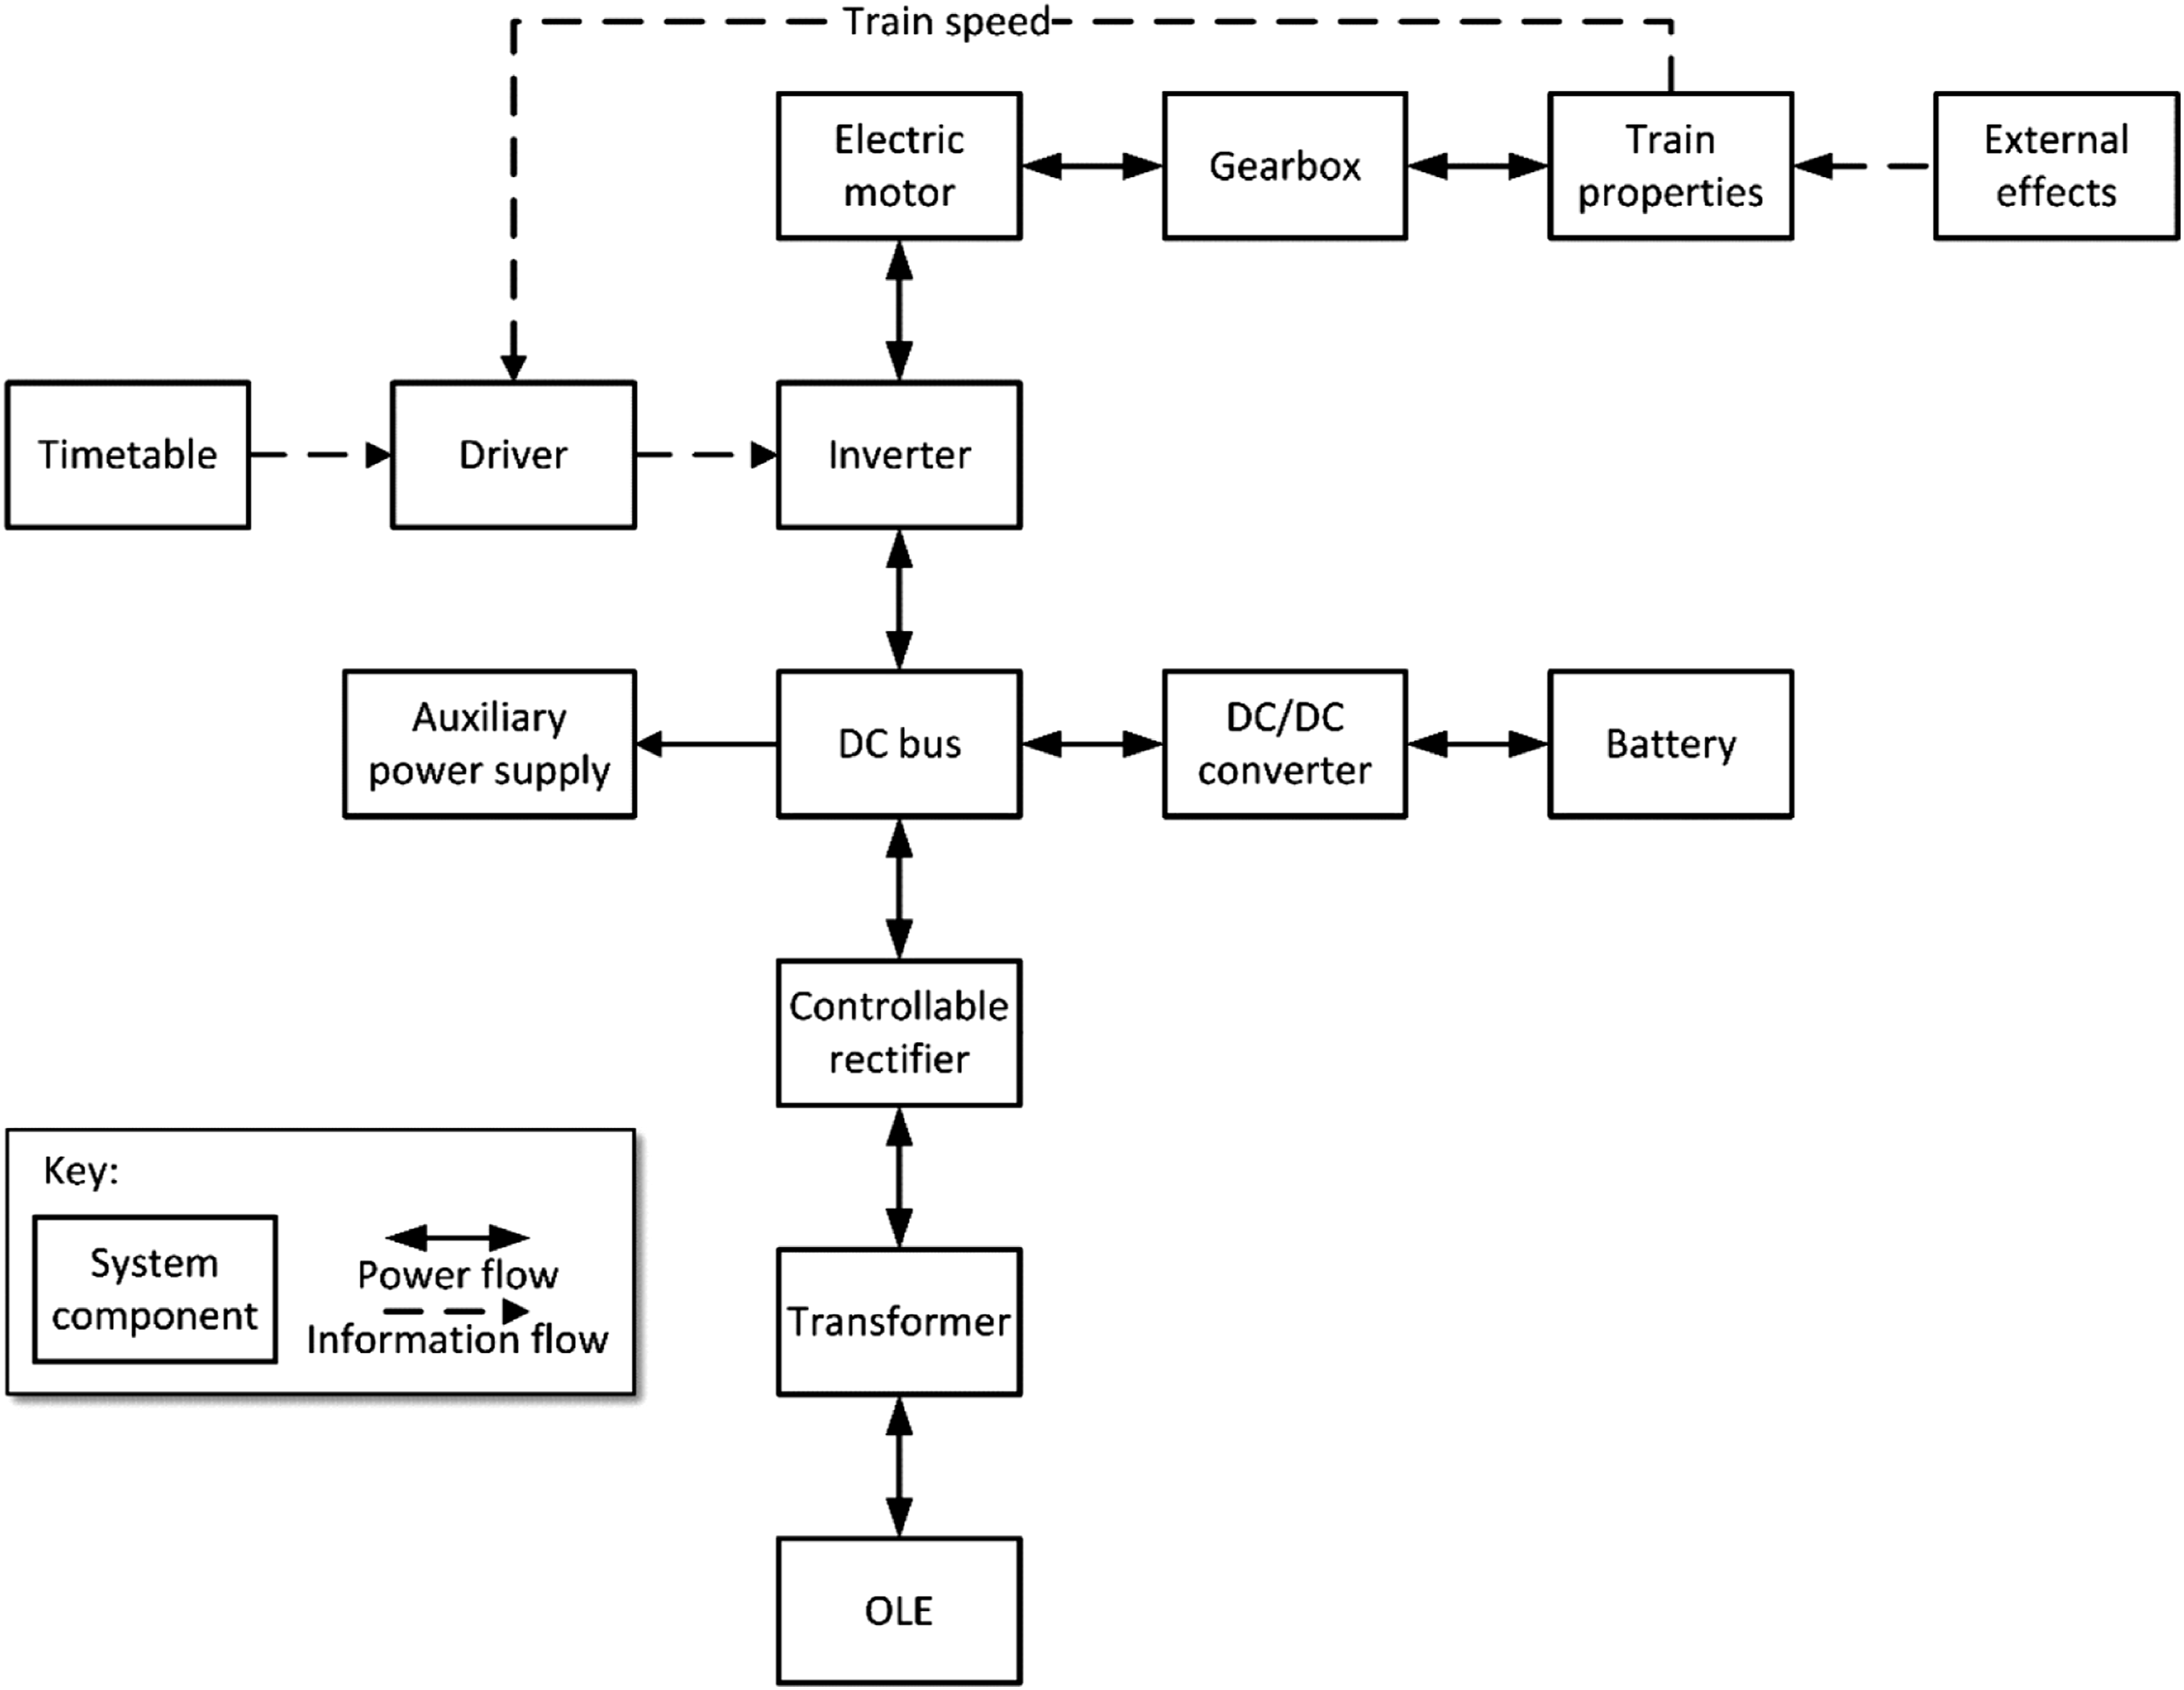
Train dynamics and properties
The train parameters and properties were obtained from publicly available information
30
and are given in.
27
A 100% passenger loading with each weighing 90 kg was used, to provide a worst-case analysis of energy usage. The total number of motors
Power supply and regeneration
Most of the electrified mainline UK rail network uses overhead line equipment (OLE) that is energised at 25 kV AC, the remainder uses 750 V DC third-rail electrification. This paper focuses on 25 kV OLE as this comprises the larger proportion (68%) of the electrified network. 32
Although the motors are modelled as DC motors, the inverter is still present to consider its efficiency since it is believed that the actual train motors are 3-phase AC permanent magnet machines, which require an inverter. The efficiencies used in the power conversion blocks are:
The maximum current allowed per train on UK 25 kV OLE is 300 A,10,34 which gives the maximum power available from the OLE as
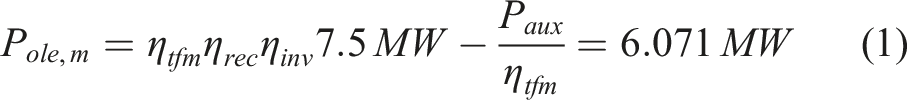
The maximum power available to the train

The Class 80x trains use electro-dynamic braking, blended with friction braking at low speeds. In this model, regenerated power is fed to the on-board batteries if they are not fully charged, and to the OLE if they are fully charged. The regenerated electrical power from the motors

Power metering and traction performance
Since a high-fidelity model is available, an accurate estimation of power use and journey energy can be obtained by metering of the electrical power use after running the high-fidelity model on OLE for the route from Newbury to Plymouth (see Figure 2), which is equivalent to 100% route electrification, without a battery on the train. The equation used for calculating the total electrical power profile is Results for OLE-only from Newbury to Plymouth (a) vehicle and desired speeds 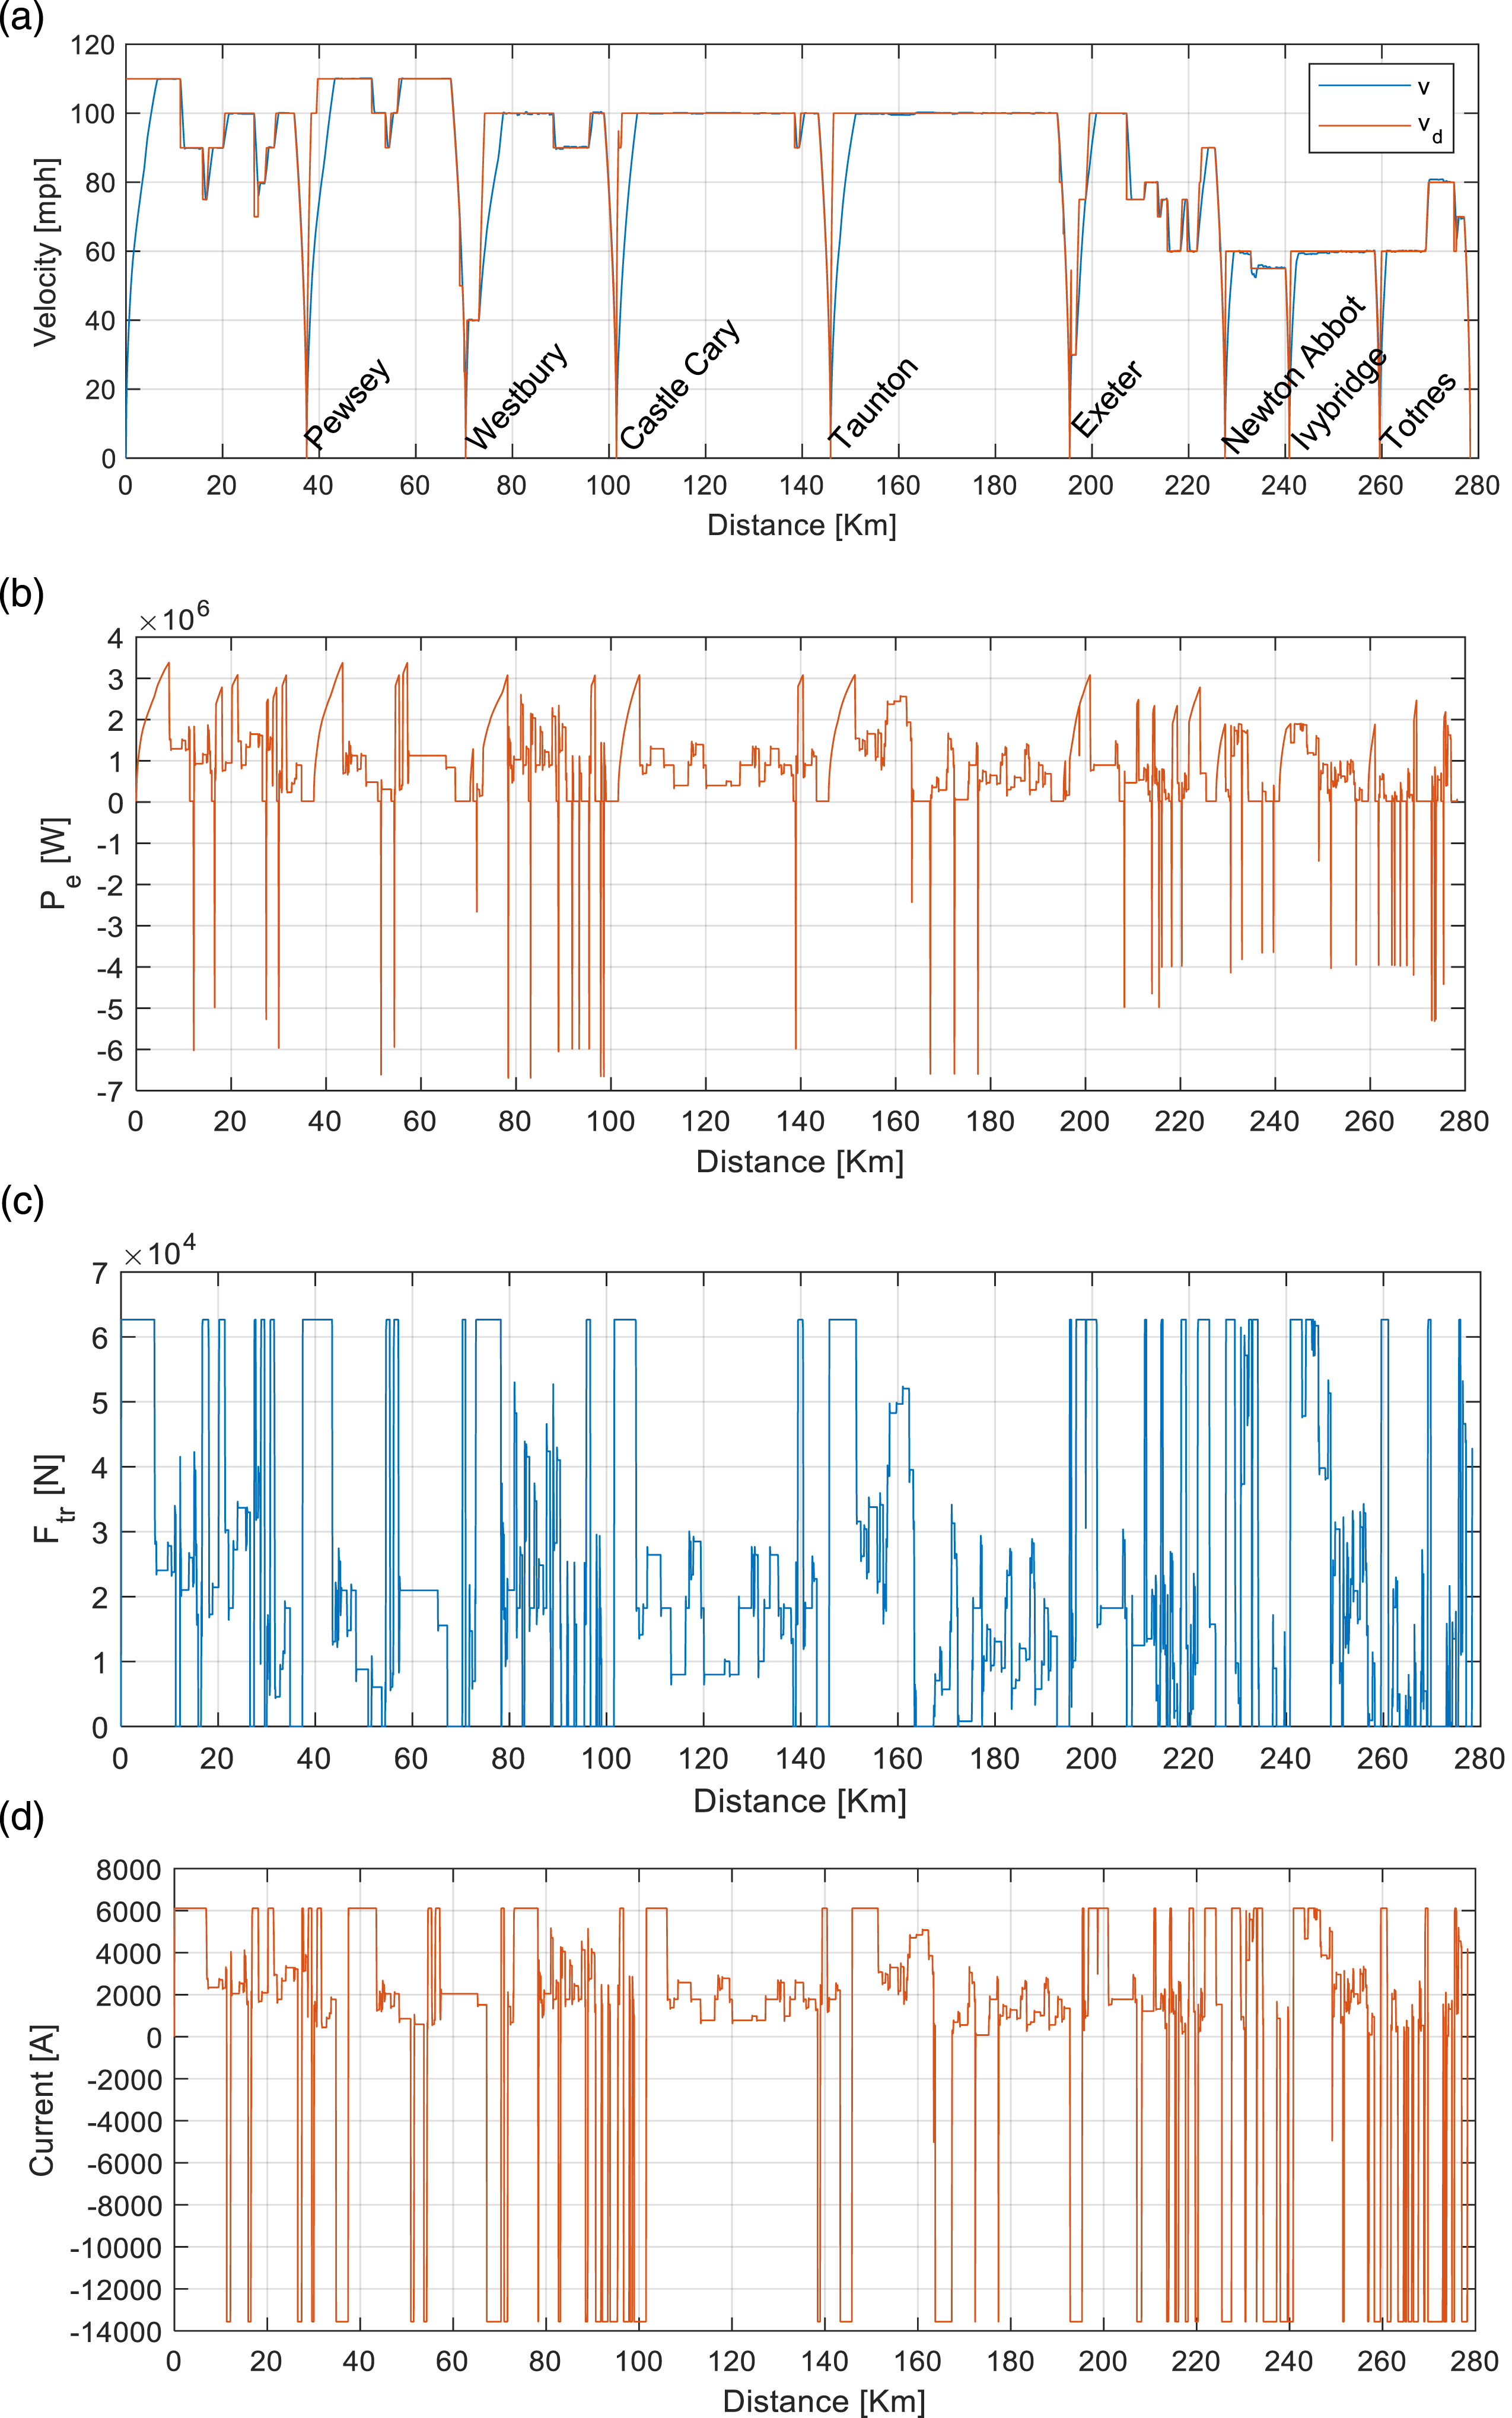
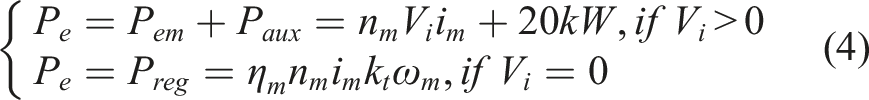
Figure 2(b) shows the power profile of the model from Newbury to Plymouth, which has a peak value of
Methodology
Battery model
The available battery voltage


The battery circuit diagram is shown in Figure 3. It shows that 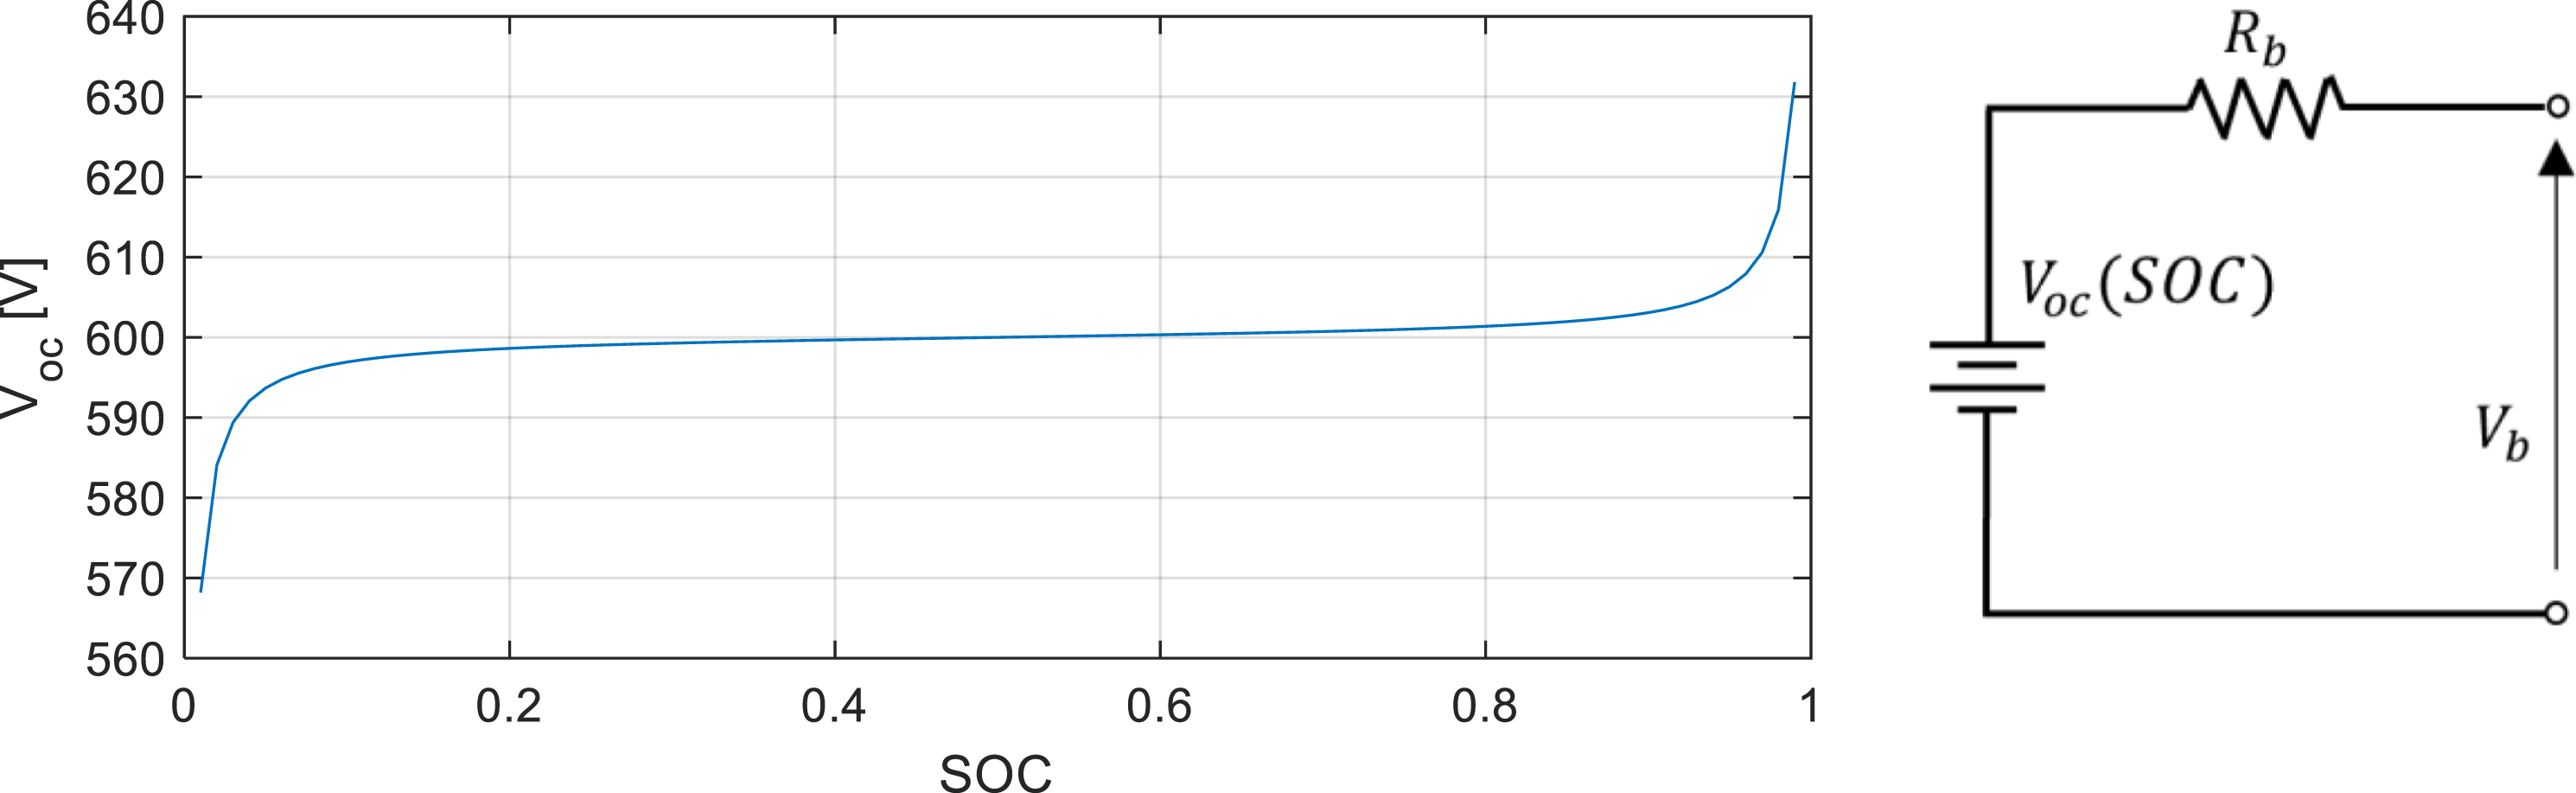
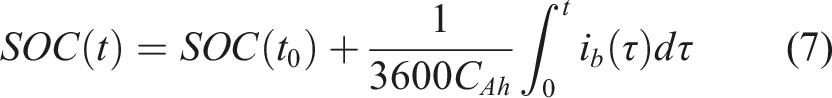
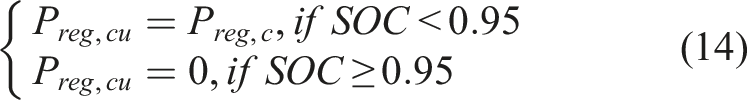
Batteries are usually operated between 95% and 20% of their SOC.
10
They are not charged to 100% SOC, or taken below 20%, due to cell balancing issues and to reduce battery degradation. The
The battery module selected for this route is a 24 V 70Ah LTO battery module, 35 similar to that used in. 16 LTO technology was selected because it offers high a high charge/discharge rate (so-called “C-rate”) and has previously been successfully implemented on light rail vehicles. 20
Due to the presence of a DC/DC converter in the vehicle topology (see Figure 1), the terminal voltage of the battery pack can be chosen freely. In this case, the voltage was specified such that it was just higher than the back-emf of the electric machines running at the train’s maximum speed (approximately 540V), resulting in a requirement for 25 modules in series (25S). This reduces the size and mass of the battery pack required compared to selecting a battery pack with 750V terminal voltage to match the DC bus.
Nominal battery properties (common-sense electrification).
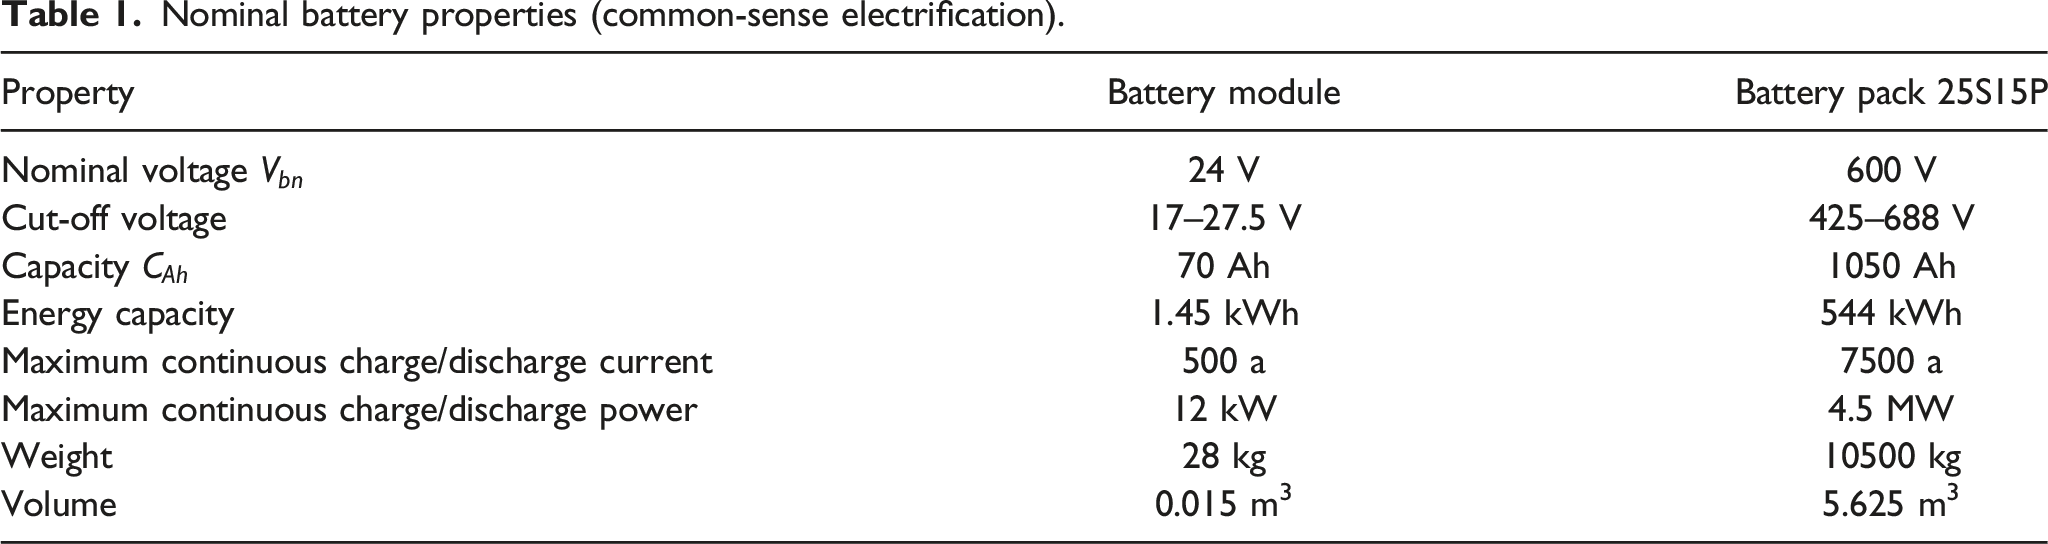
This battery weight does not include the additional power electronics or cooling that would be required, which could be up to 200 kg for a battery of this size.36,37 In this case it is assumed that the cooling and power electronics required for the battery pack would be of a similar weight to those required for the engine-generator on standard Class 80x trains, and so they have not been included in the model’s additional weight calculations.
Battery operation
The battery current has the following equations during charge and discharge phases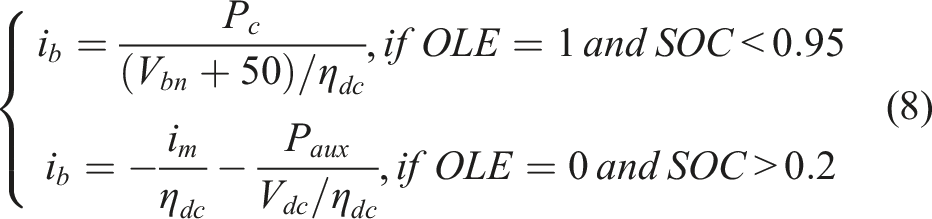

There is also a large amount of power available to charge the battery from the OLE even when the motors are drawing full power and there is no regenerated power as
Journey energy
Without installing the battery, the total electrical energy
Regenerated energy is related to several factors, including the mass of the vehicle, the magnitude of descending gradients and demanded decelerations along the route. Note that negative power in the power profiles (as in)
10
is from a negative current in the motors that is present when the back EMF is greater than the input voltage. The journey energy is calculated by integrating the positive power values only where any negative powers are from regeneration.
38
Therefore, the equation for the journey energy 
Weight comparison.
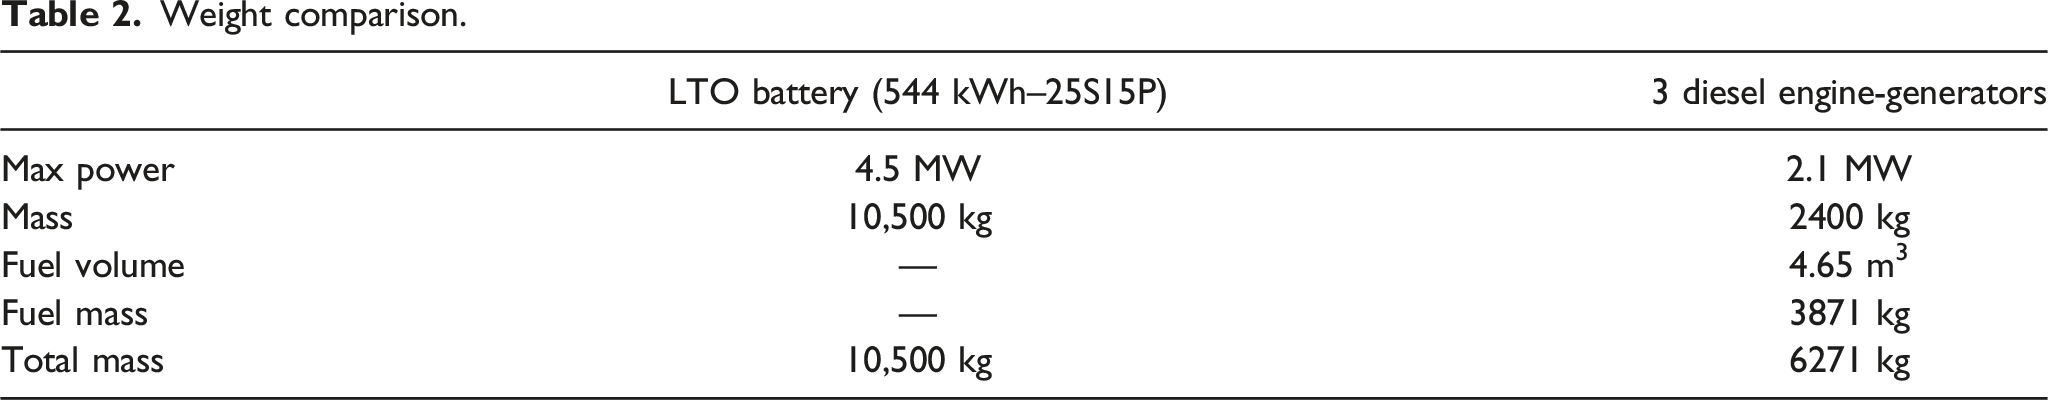
The diesel engine with fuel included weighs less than the battery, and thus the battery weight increases the gradient drag and the power required for acceleration. Different intermittent electrification patterns will require different sized batteries, which might impact the train’s acceleration and energy consumption performance. However, it has been observed that a variation of this order (less than 2%) in the train gross mass has only a very small effect on the total journey energy. The journey energy when running on battery only is computed similarly to
Route electrification
As discussed in the introduction, there is a range of things which may be considered in the optimisation: the cost of electrification per STK, the cost of electrifying tunnels and bridges, and the cost of the train’s battery pack. This study focusses on determining the trade-off between the extent of network electrification and the size of the resulting battery as these are quantities that can be calculated programmatically. The UK does not yet have a commercial market for LTO batteries of the required size, so it is difficult to determine the likely cost of the batteries.
Furthermore, the costs of electrification vary from project to project, depending on the challenges encountered. It is suggested that the work presented here would be part of the decision-making process for an electrification project’s engineers, who would then consider these other trade-offs — cost of electrification, cost of batteries and cost of electrifying specific parts of a given route — to determine the most cost-effective and most environmentally responsible way to proceed.
Therefore, the approaches discussed here look at the minimising the number of battery modules (and therefore battery mass) while maximising the amount of energy recovered by the battery.
Common-sense intermittent electrification
Engineering judgement suggests that peak power demand occurs when the train is leaving stations and climbing hills. A heuristic manual approach to near-optimal intermittent electrification is to electrify these sections first. In this scenario, 10-km long sections centred on the train stations are electrified since the train also must move in the other direction when making the return journey. The 10 stations are Newbury (only 5 km of this station since the other side of the station is already electrified), Pewsey, Westbury, Castle Cary, Taunton, Exeter, Newton Abbot, Totnes, Ivybridge and Plymouth (also only 5 km of this station is electrified as it is a terminal station). In addition, a 10 km of uphill section between Ivybridge and Totnes is also electrified, which means a continuous electrification between these two stations. This gives a total of 100 km of electrified track, 36% of route length.
Optimal intermittent electrification
The track from Newbury to Plymouth was divided into 50 5.6-km sections. The total journey energy consumption Energy consumption for the (a) first 25 sections and (b) last 25 sections.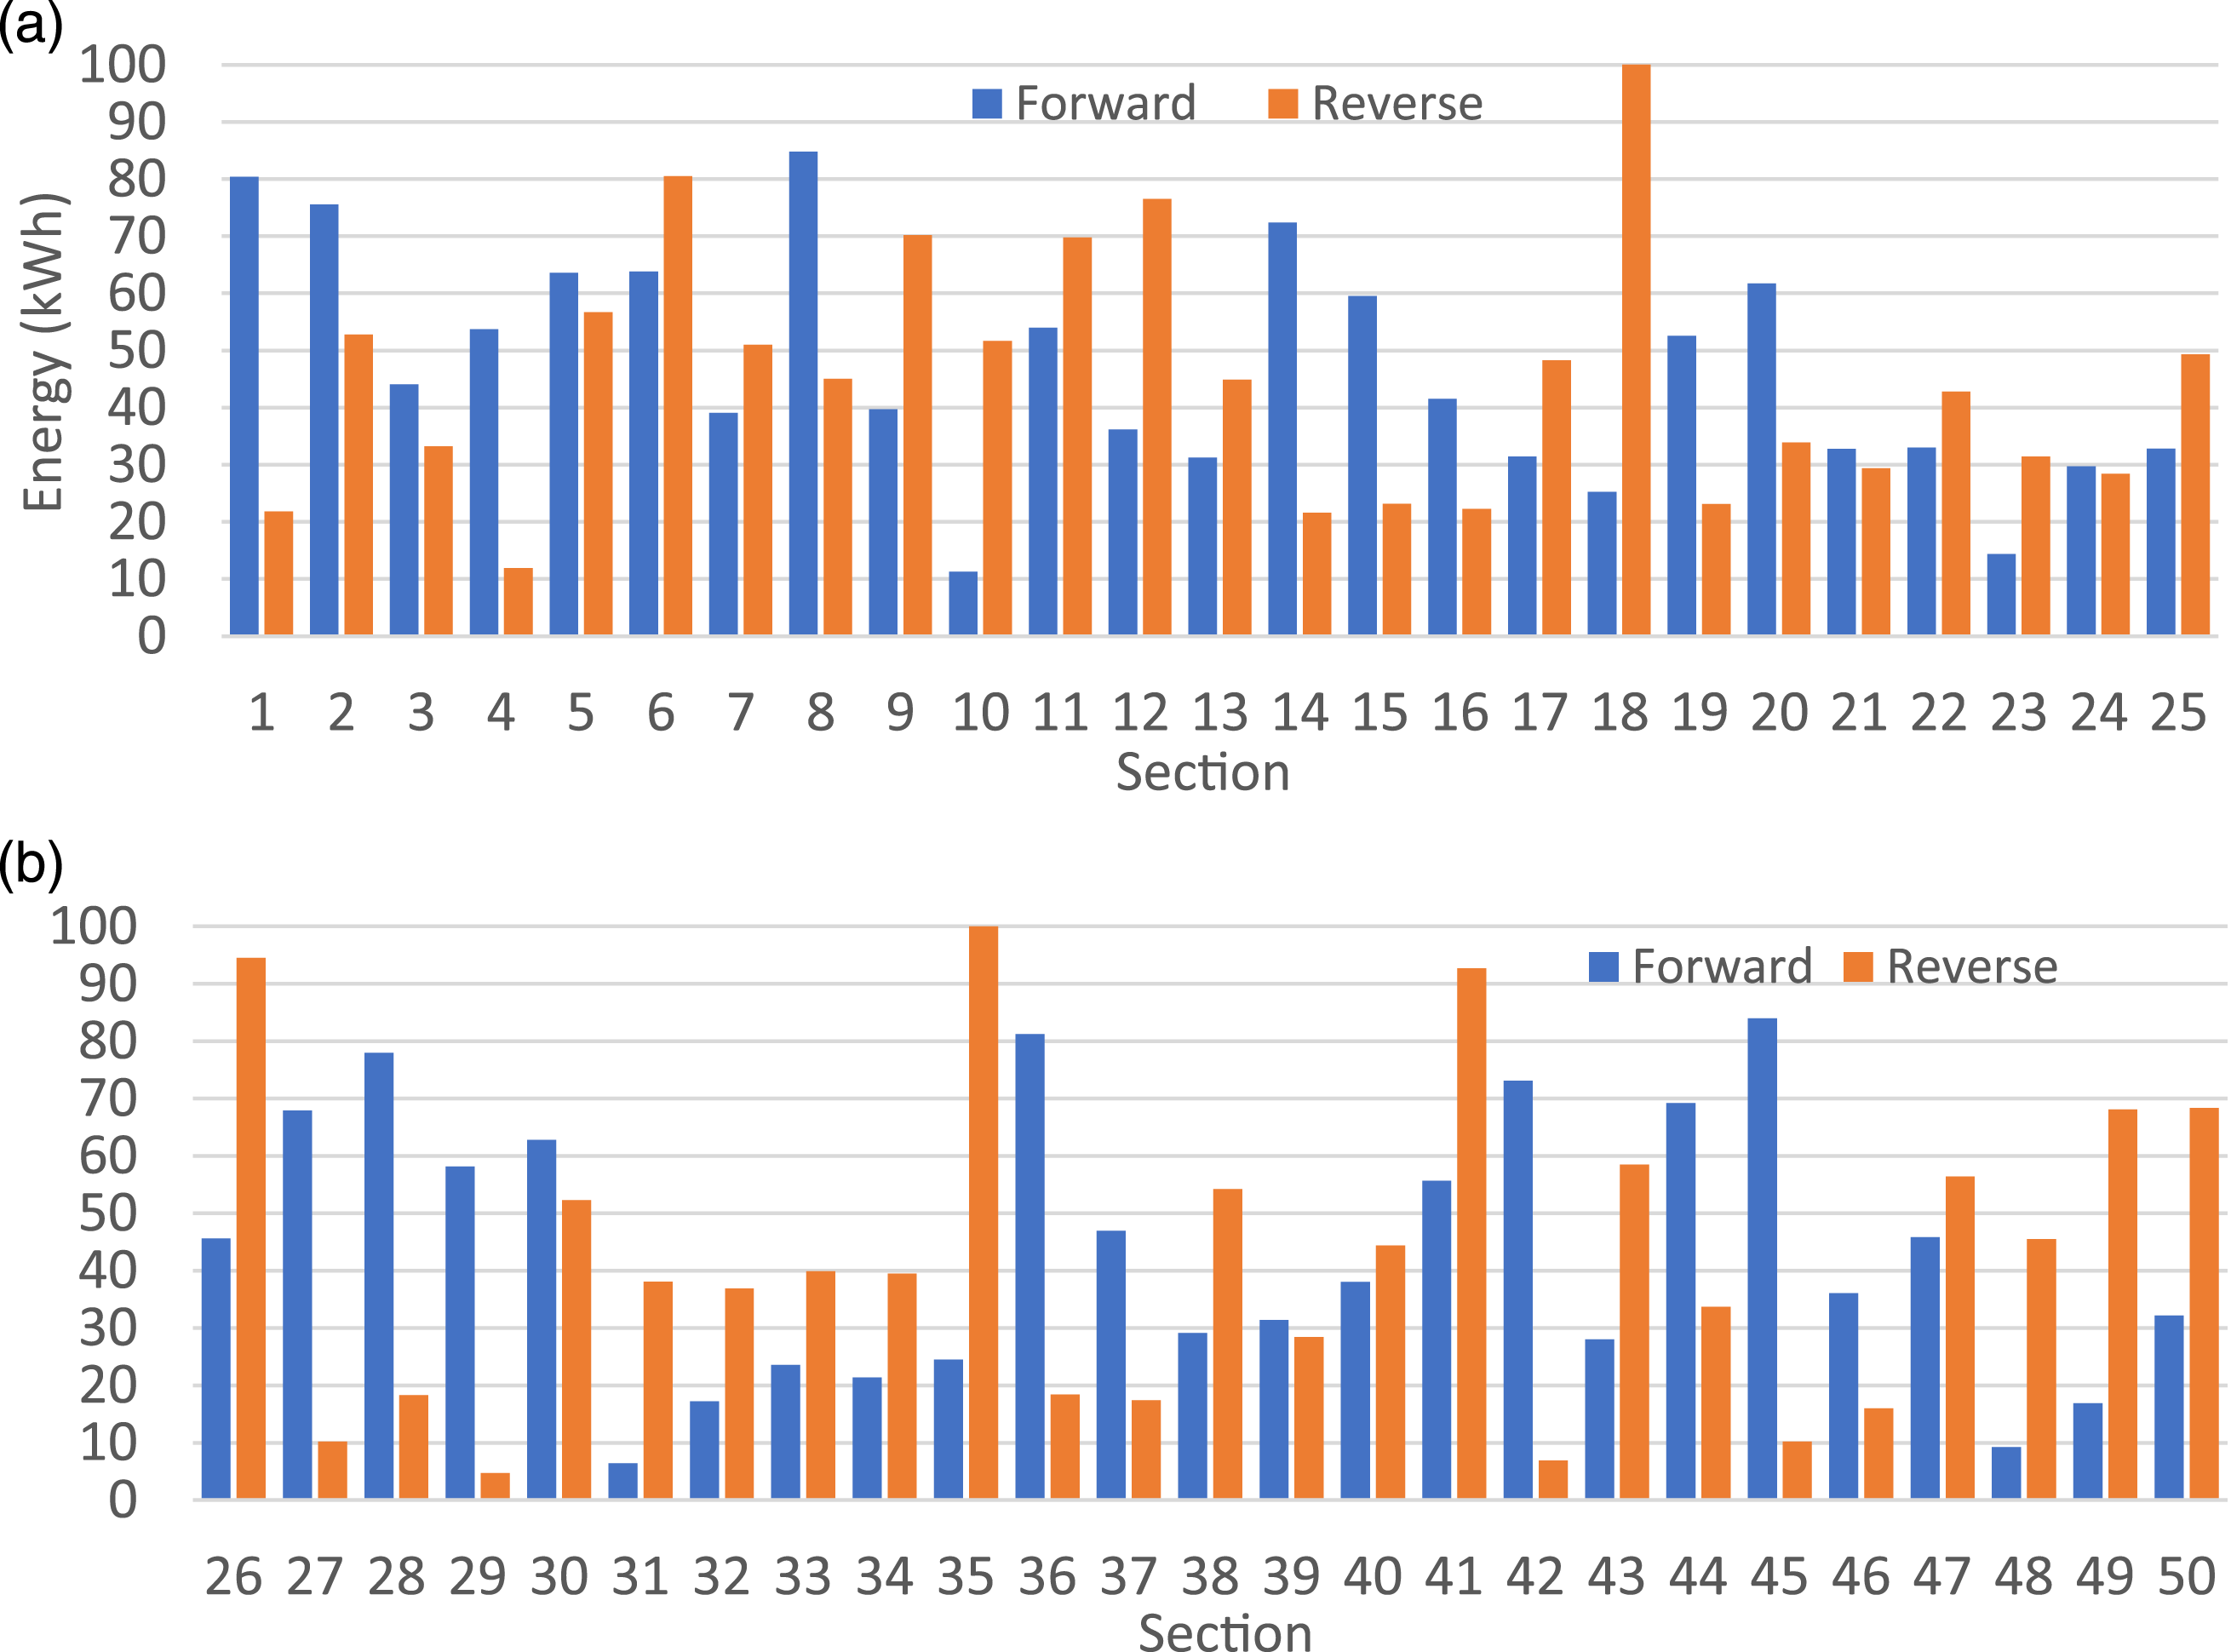
This maximum energy consumption for a discrete section is referred to here as the “energy footprint” and is denoted by 
Finding the optimal battery size for a given percentage of optimal electrification can be treated as a minimization problem where the battery capacity is increased and tuned with a precision of one battery module in parallel until its SOC no longer goes below 20% during the journey.
Results
Common-sense intermittent electrification
Figure 5(a) shows the result of starting the journey from Newbury to Plymouth starting with a 95% SOC. This shows that the battery can provide power in unelectrified sections and the OLE has sufficient power to charge the battery quickly in electrified sections, enabling the train to complete the journey without going below 20% SOC. Simulation results from Newbury to Plymouth. (a) SOC and OLE availability; (b) battery current; (c) battery voltage; (d) available charge power and OLE availability; (e) SOC and OLE availability for the reverse journey from Plymouth to Newbury.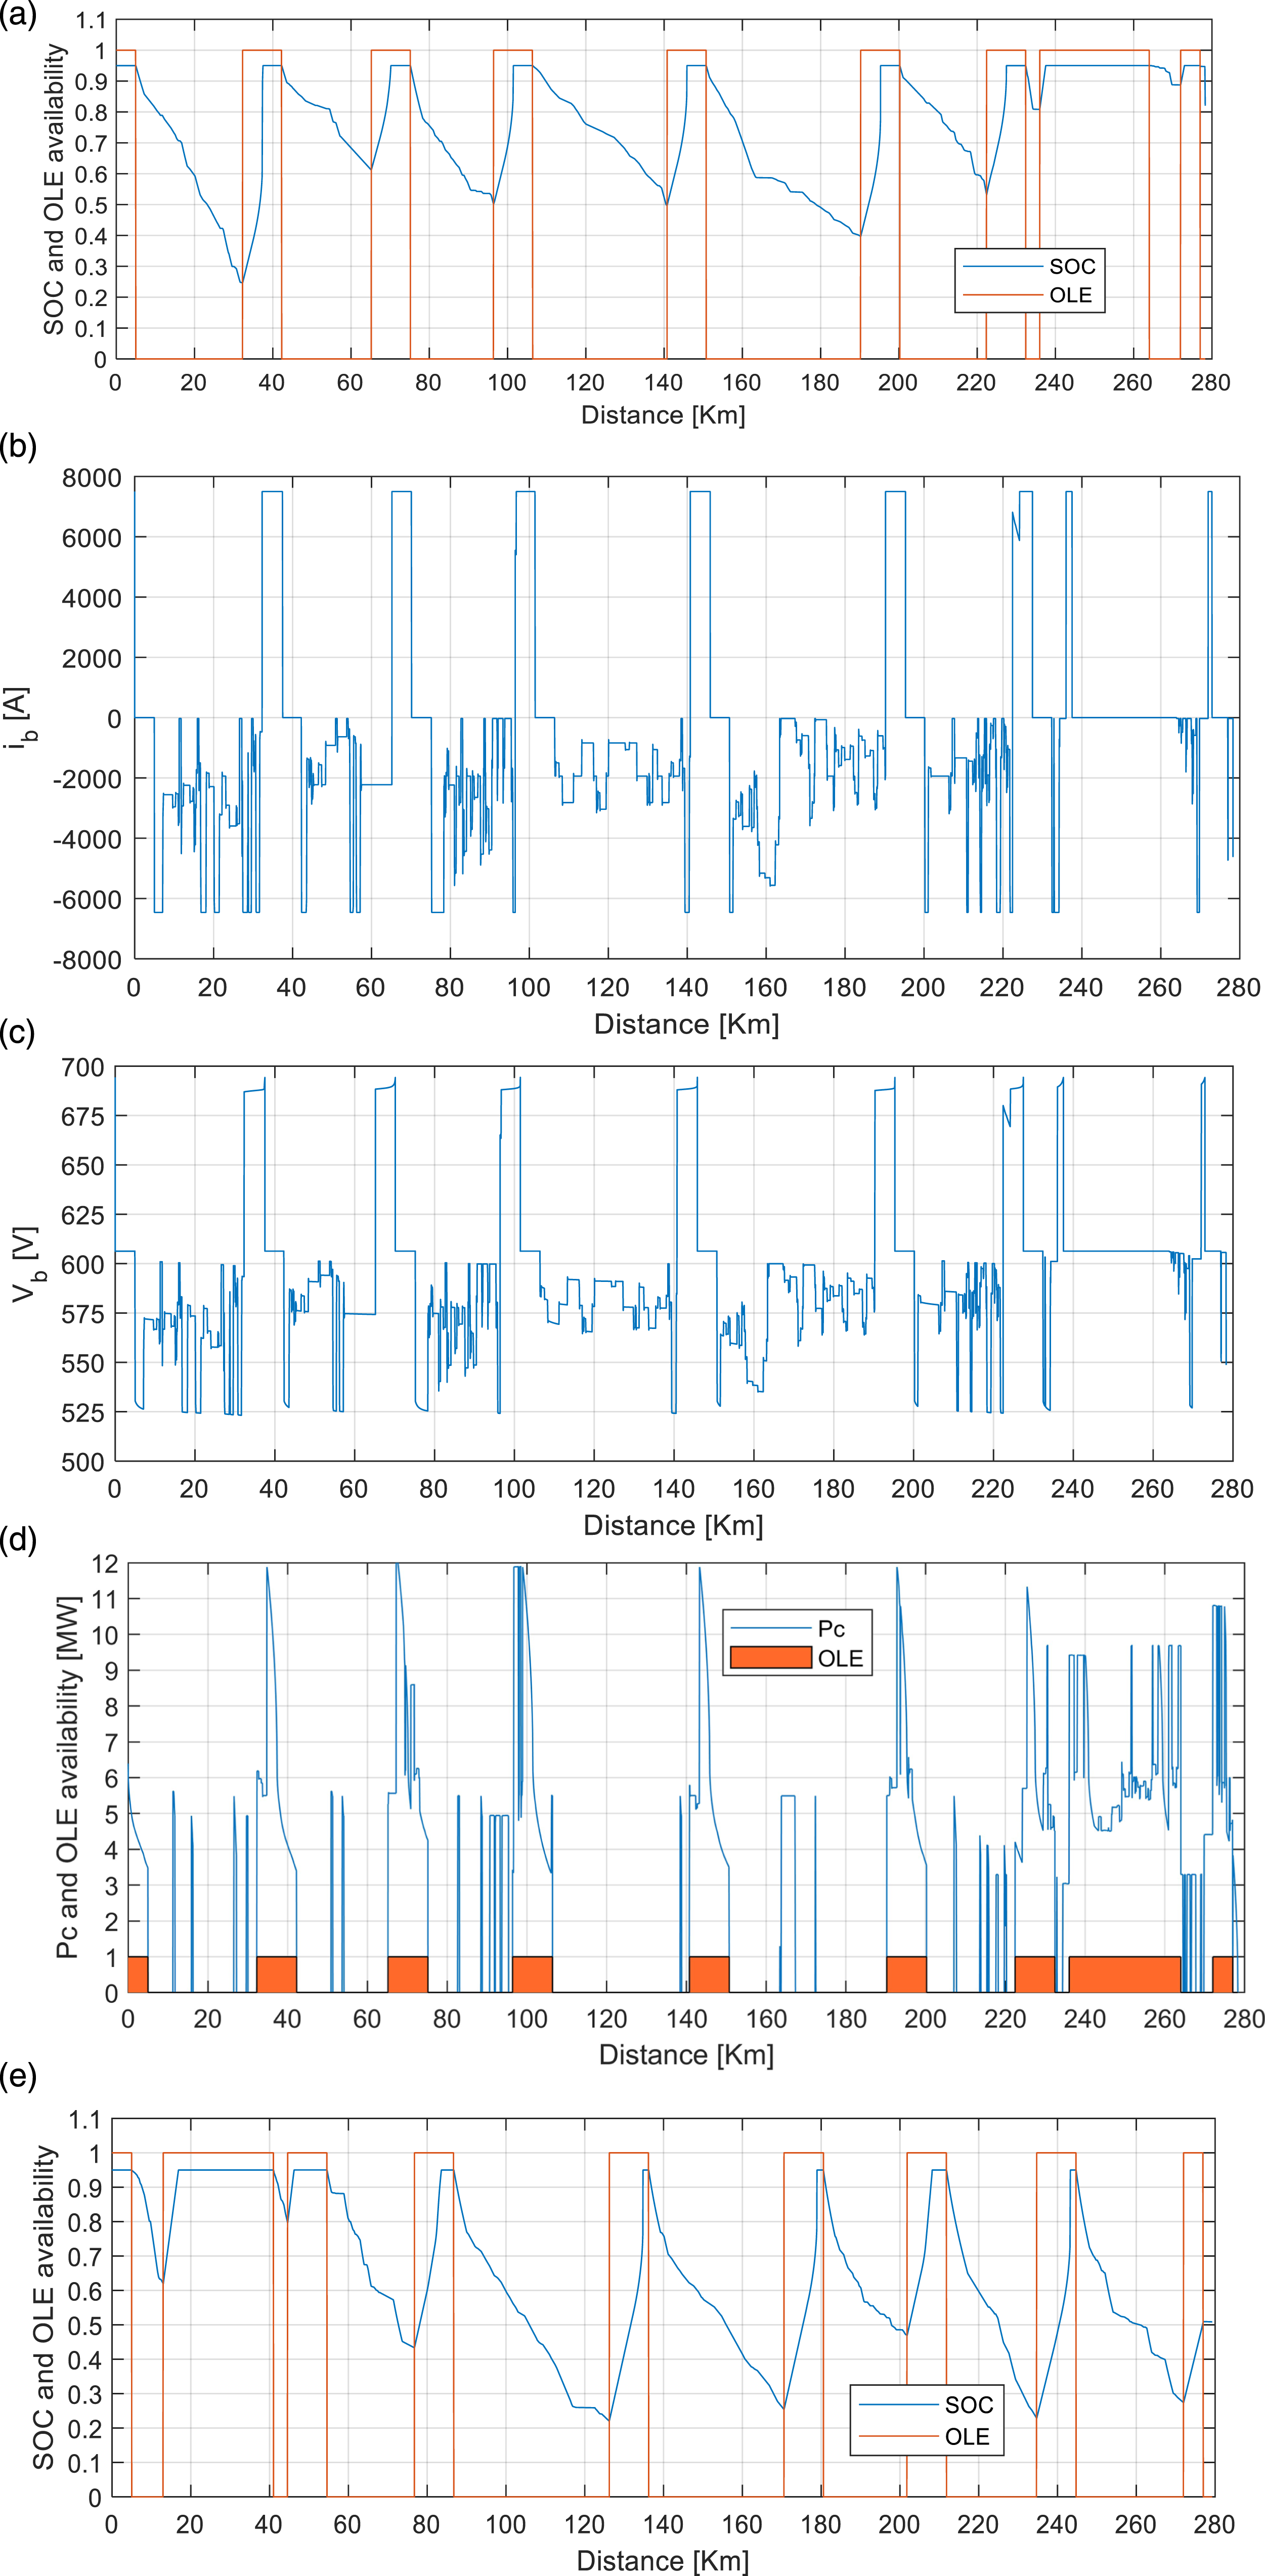
The battery capacity was tuned by removing parallel battery modules until the train could complete the journey without the SOC going below 20%. This was done for both directions of the journey and the direction of travel which required the maximum capacity is selected for the minimum battery size.
In this case, the minimum number of batteries in parallel required to complete the journey in the forward direction was 15, and the reverse direction was 14, therefore 15 was selected as the minimum number of batteries in parallel. This gives 544 kWh of battery capacity required for this electrification scheme. Figure 5(a) and (e) show the SOC curve and the positions where OLE is available along both directions of journey for this electrification case. These figures show that the SOC starts to increase during braking and when OLE is available.
Figure 5(b) shows the battery current profile where negative current is discharge current. The battery voltage profile is given in Figure 5(c). It can also be seen that
Figure 5(d) shows the available charge power and the OLE availability. As expected, the maximum charge power occurs when the vehicle is both decelerating and there is OLE available. When there is no OLE,
Optimal battery size
The percentages of route electrification studied were 20%, 30%, 40%, 50%, 60%, and 80%. At 20% electrification, a minimum of 58 modules were required in parallel for both journeys, giving a battery capacity of 2103 kWh. The SOC curve and the OLE availability for both the forward and reverse journeys are given in Figure 6(a) and (b). They show how lengthy unelectrified sections and short electrified sections result in a requirement for a large battery. The results of optimal battery sizes are summarised in Table 3. SOC and OLE availability at 20% electrification (a) from Newbury to Plymouth and (b) from Plymouth to Newbury. Comparison of battery sizes for different electrification cases (limiting number of parallel modules in 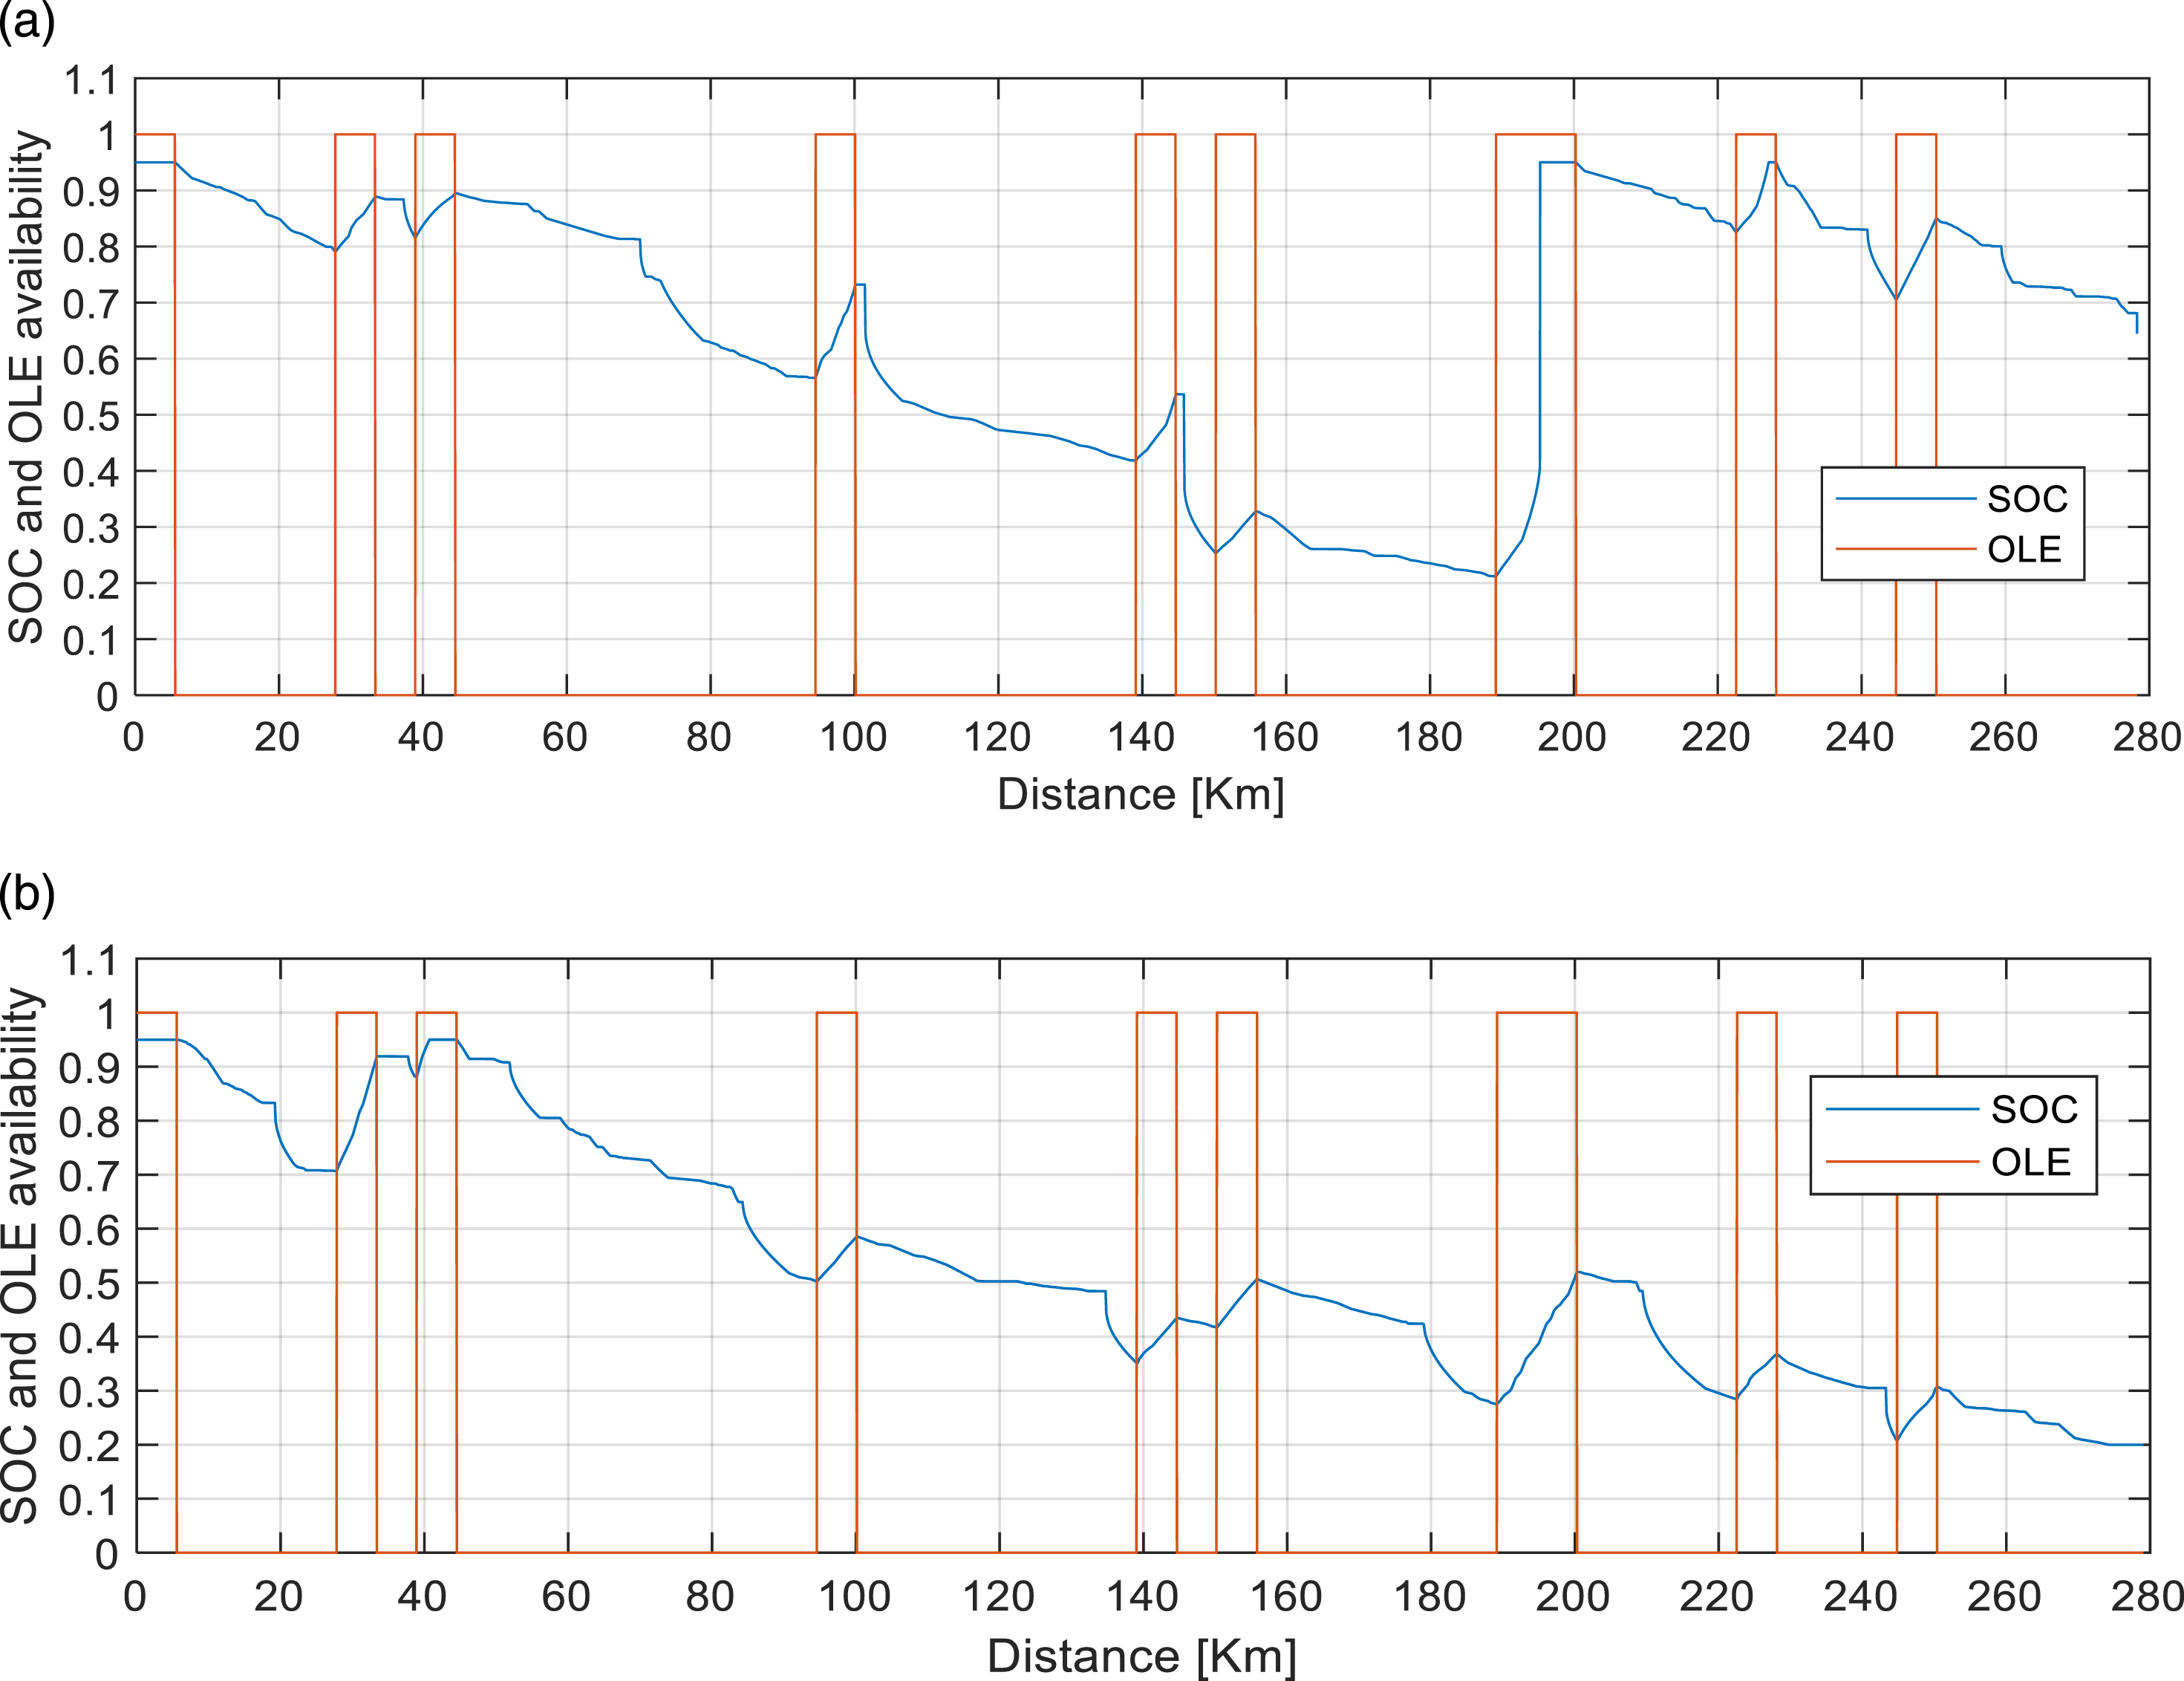
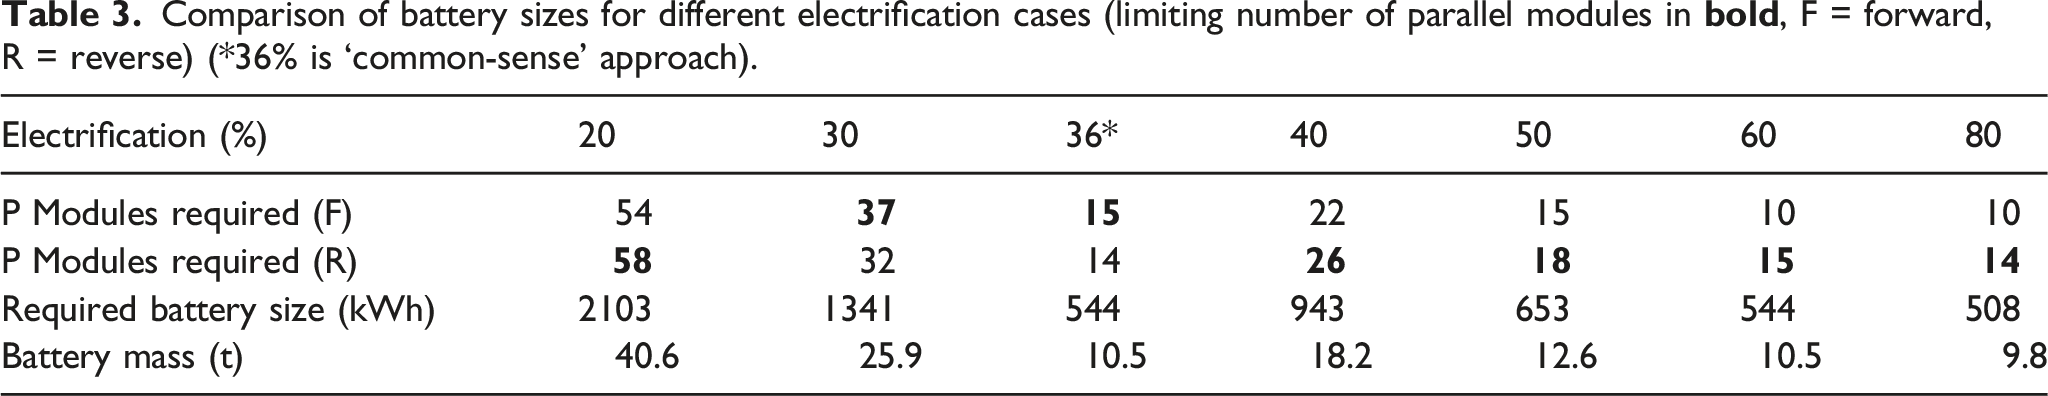
Table 3 shows that the ‘common-sense’ approach results in a battery with lower mass than that from the numerical optimisation for 40% electrification. This is due to the low spatial resolution of the numerical optimisation (5.6 km) when compared with the less-constrained common-sense approach. If the section lengths were reduced, then it may be possible to produce an electrification paradigm that results in lower battery mass than that from the common-sense approach. Note that the positioning for the discrete sections can only be near-optimal for 20% and 30% electrification, as the added battery mass of 40.6 t and 25.9 t, respectively, is much greater than that used to derive the energy requirement for the given sections (10.5 t).
Battery cycle life
The LTO battery has a life of 6000 cycles at 55°C and 2C before degrading to 80% of its initial capacity. 35 Whilst the battery charge/discharge rate in this study can be up to 8C, good data on the effects of high charge/discharge rates on LTO batteries was not available. Therefore, for the following analysis, the given cycle lives in the battery data sheet for 2C have been used.
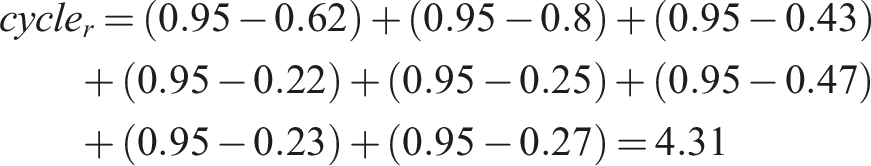
As an example, the total number of battery cycles per trip can be calculated from the SOC curves in Figure 5(a) and (e) as the average of the cycles from forward 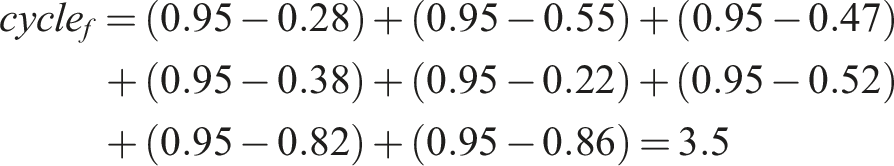
Since any reduction in battery capacity would affect whether the train could complete the unelectrified sections without going below an SOC of 20%, it is important to take battery degradation into account to ensure the battery can last for a minimum desired period. Reducing the number of times that a battery needs to be replaced over a vehicle’s lifetime also leads to better environmental and economic performance. Therefore, the optimal battery capacity for each electrification case was increased, taking into account a 20% loss in battery capacity over its degradation period. This required increasing the battery capacity by 25% and the new capacity is here referred to as battery lifetime capacity.
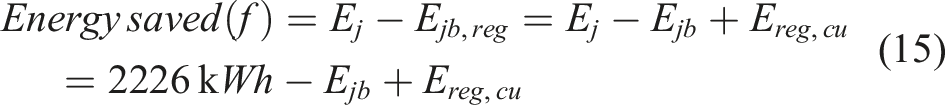
Energy savings
Using the amount of energy captured under regenerative braking, it is possible to show how much energy is saved by using a battery-electric rail vehicle versus a diesel-electric rail vehicle. The net journey energy after using the regenerated energy when there is a battery is denoted by 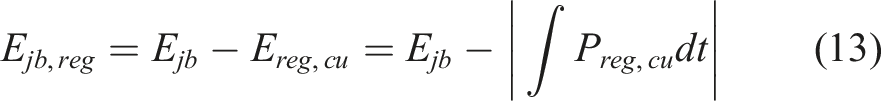
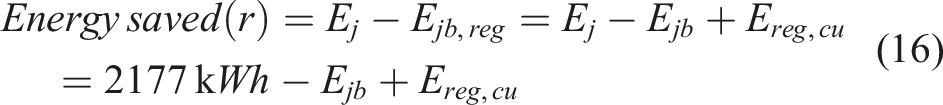
Energy performance for return trips between Plymouth to Newbury for different electrification cases.
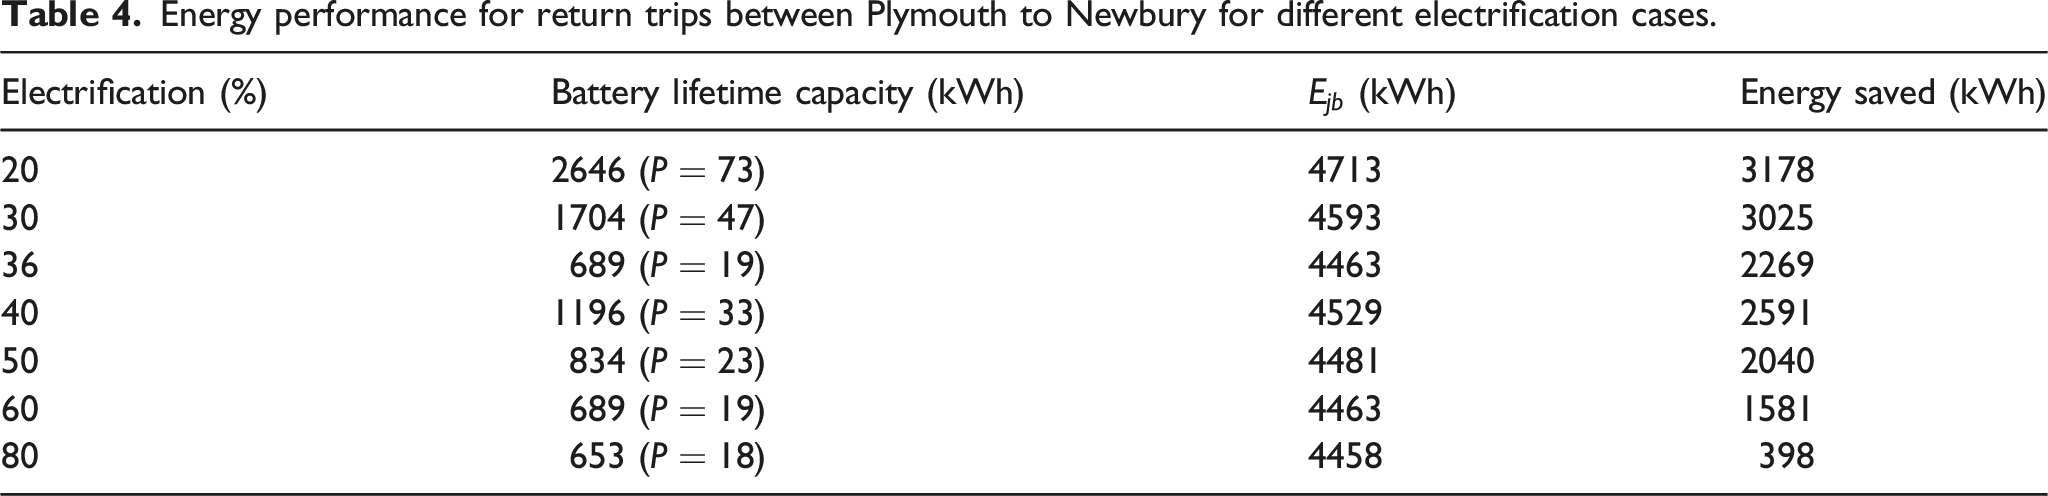
The table shows that the energy saved by replacing the diesel engine with a battery decreases as the percentage of electrification increases. As the train uses the OLE more often at higher percentage of electrification, the battery remains full for longer and thus, less of the regenerated energy is used to charge the battery. It also shows that the energy saved per unit battery mass is highest at 36% – the “common-sense” electrification approach.
Battery lifetime
Since this new battery lifetime capacity is larger, it will have fewer cycles per trip compared to the initial battery sizes optimized above. Therefore, the actual battery lifetime can be estimated using the new SOC curve for this larger lifetime battery capacity. This is only done for the 36% of electrification case since this is the optimal battery size identified in this study.
The battery cycles for forward and reverse journeys are calculated to be 2.46 and 3.48 from the new SOC curves, giving an average 2.82 cycles. Assuming 5 trips per day and 300 days of operation per year, the battery can therefore last about 1.42 years before degrading to 80% of its initial capacity if it operates at 55°C (lifetime of 6000 cycles at 2C). 35 However, if the battery temperature is maintained at 25°C, it has a minimum lifetime of 25,000 cycles at 2C. 35 In this case, the battery can last approximately 6 years on the route before degrading to 80% of its initial capacity. As discussed above, the cycle lifetimes in the data sheet were specified at 2C. However, good data on how high C-rate charging or discharging can affect the lifetime of an LTO battery is difficult to find, so the lifetime at 2C was used as an approximation here.
If the battery is to be replaced when it degrades to 80% of its capacity, then the 1.42-years battery lifetime can be used to estimate the lifetime energy savings from regeneration. At 36% of electrification, the train battery with lifetime capacity can save 2267 kWh of energy in a return trip. In this case, the battery pack can save about 4.8 GWh of energy over 2115 return trips (at 6000 cycle life) per year. It is expected that degraded batteries could be used for lineside energy storage systems before being recycled. 39
CO2 savings
Note that in addition to energy savings, there are significant benefits of intermittent electrification over continuous electrification in terms of CO2.
21
A comparison of the CO2 emitted at 35% of electrification between diesel-OLE and battery-OLE trains is given in Figure 7. Comparison of CO2 from diesel only, OLE without regeneration, and diesel-OLE and battery-OLE with regeneration on forward journey.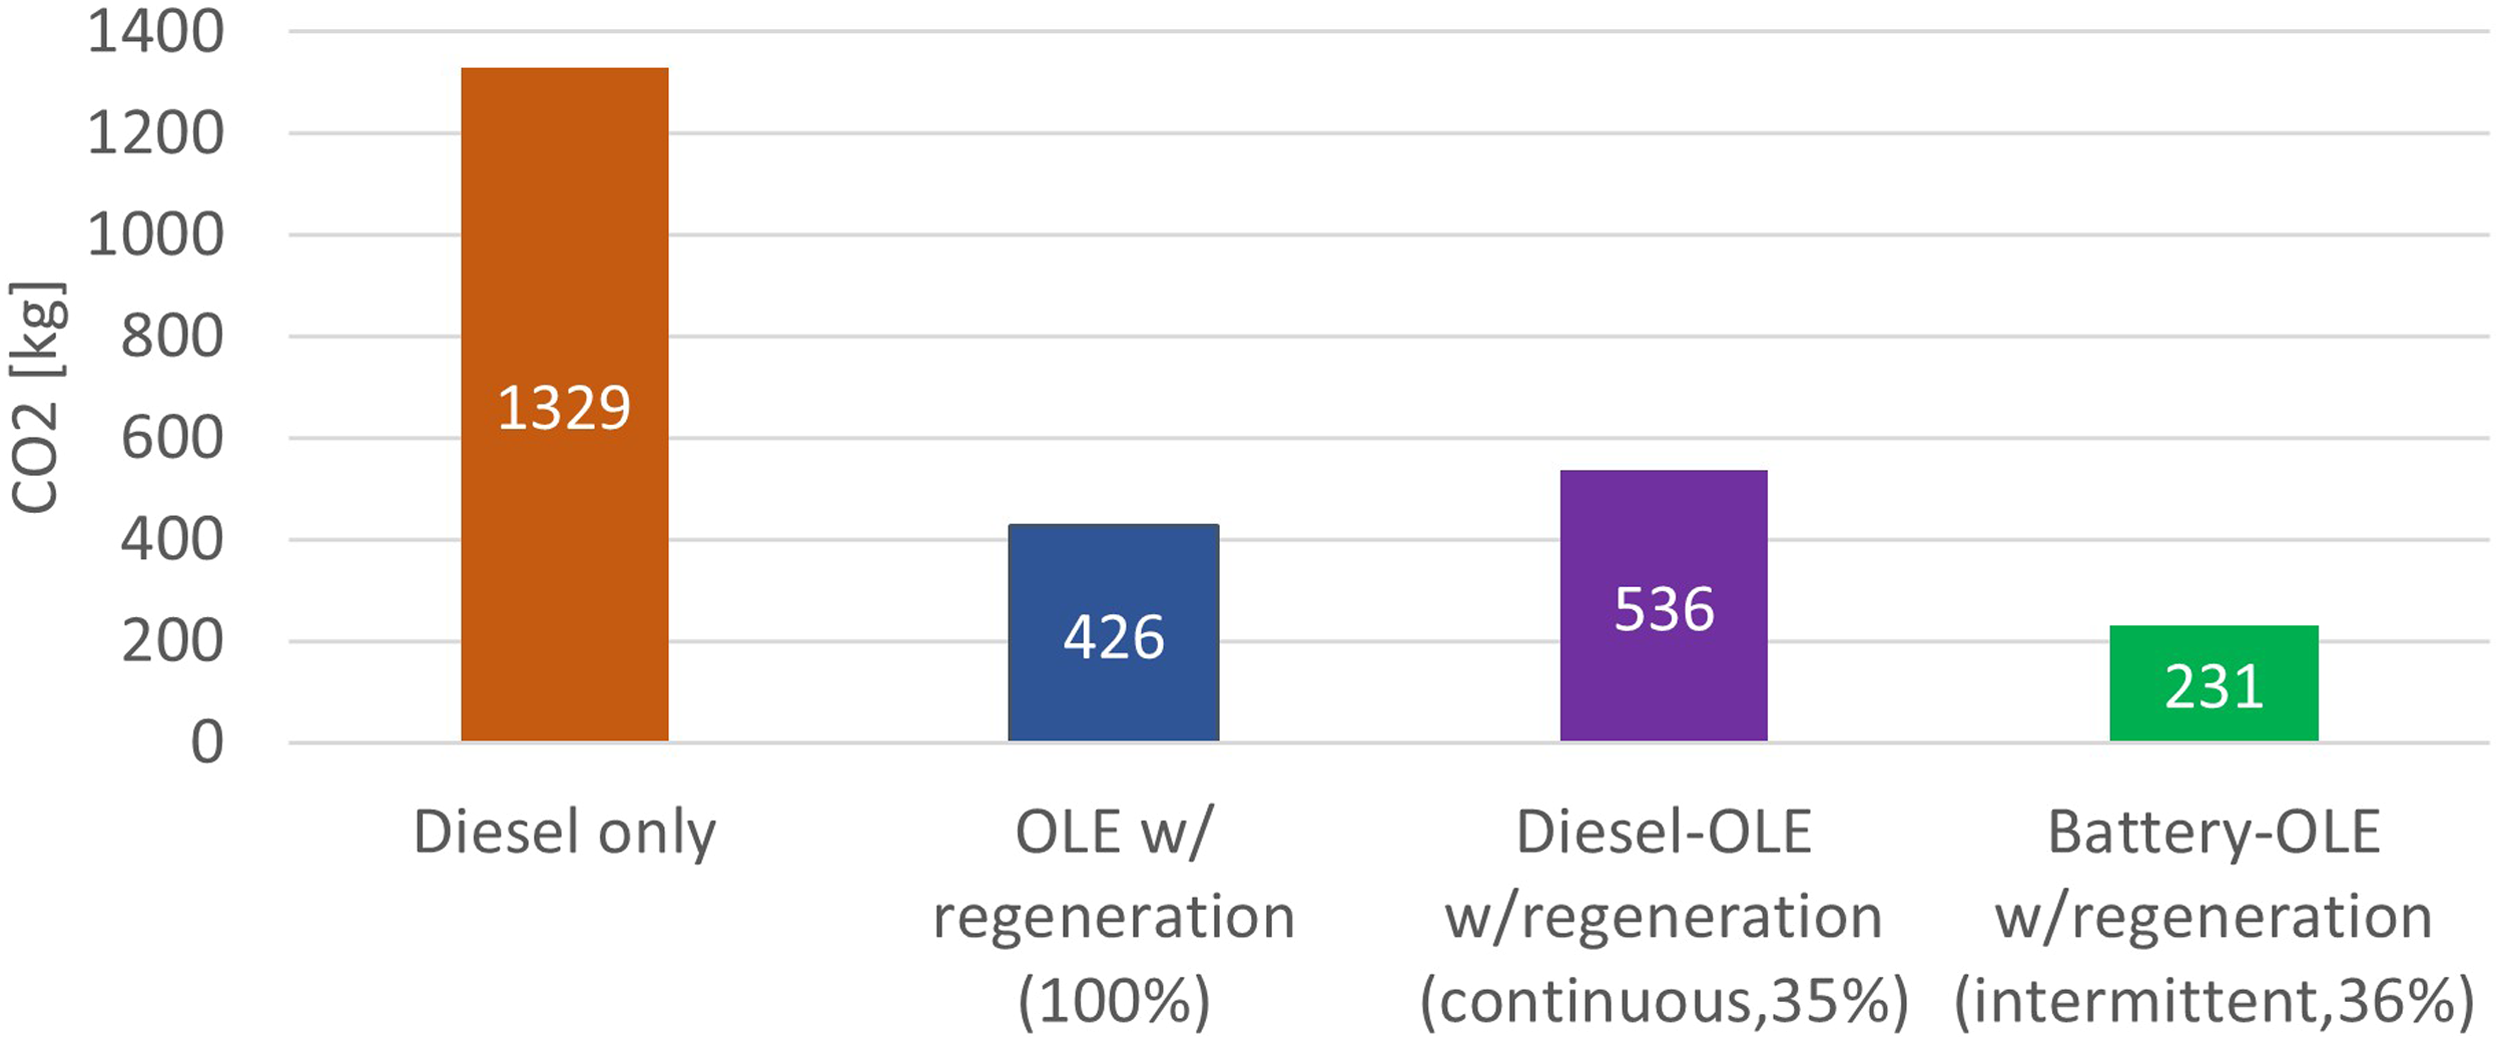
The figure shows that the battery-OLE system at 36% (“common-sense”) intermittent electrification produces the least CO2, as expected, which is calculated as
Conclusions
A detailed rail vehicle model was improved through the addition of a battery module to allow battery-only running when OLE is not available. Two intermittent electrification schemes were then investigated: one using 10-km sections centred on stations and hilly parts of the route (so-called ‘common-sense electrification), which gave rise to 36% electrification; and the other electrifying the route in 5.6-km sections, starting with those that had the highest energy demand. All cases resulted in lower energy used for the journey when compared to running on OLE with no regeneration.
The numerical optimisation technique adopted in this paper – sorting 5.6-km long sections by their total energy consumption and electrifying those with the largest energy first – gave bigger battery pack sizes when compared to the common-sense approach. The numerical optimisation technique may be improved by using smaller sections or by reconsidering how to choose which track sections should be electrified.
In general, higher degrees of electrification gave rise to lower battery sizes, with the ‘common-sense’ approach giving lower battery sizes than similar numerically developed electrification strategies. The battery life for these scenarios was estimated at 1.42 years if the battery is kept at 55°C and up to 6 years if the battery is kept to 25°C. Switching from diesel-only running to intermittent electrification with battery infill would reduce the carbon intensity of the return trip from Newbury to Plymouth by 83%.
There are practical drawbacks to intermittent electrification, including the challenges with connecting nearby feeder stations when transitioning to full electrification from intermittent electrification. However, intermittent electrification with battery infill shows promise as a way to decrease the carbon intensity of rail travel without costly full electrification.
Future work
This analysis has made a range of assumptions to simplify the modelling of this complex system. Further work could be done on battery SoC management and lifetime maximisation; integrating an electrification cost model that includes a method for including the additional costs incurred around bridges, tunnels and inaccessible areas; SoC-adaptive cruise control or speed control; the cost of energy storage compared with the energy cost savings; and the environmental impact of manufacturing and installing onboard energy storage. Furthermore, the effect of high-power charging and discharging on the lifetime of LTO batteries is currently not well understood. Further work on this would help engineers make decisions about the size and lifetime of the LTO batteries required for their application.
Footnotes
Declaration of conflicting interests
The author(s) declared no potential conflicts of interest with respect to the research, authorship, and/or publication of this article.
Funding
The author(s) disclosed receipt of the following financial support for the research, authorship, and/or publication of this article: The authors gratefully acknowledge the financial support of the EPSRC’s DTE Network+ (EP/S032053/1) and the RSSB (COF-IPS-02).
Appendix
Section
Energy (kWh)
Section
Energy (kWh)
Section
Energy (kWh)
Section
Energy (kWh)
1
111.8
13
73.1
26
58.1
38
44.4
2
111.2
14
72.4
27
56.4
39
44.1
3
94.5
15
70.2
28
54.2
40
42.8
4
92.7
16
69.8
29
53.7
41
41.5
5
84.8
17
69.2
30
52.6
42
39.9
6
84
18
68.4
31
51.7
43
39.5
7
81.3
19
68.1
32
51
44
38.1
8
80.5
20
67.9
33
49.3
45
36.9
9
80.4
21
63.6
34
48.3
46
36.1
10
78
22
62.8
35
47
47
32.8
11
76.5
23
61.7
36
45.5
48
31.4
12
75.6
24
59.5
37
44.9
49
31.4
25
58.5
50
29.7