
Abstract
Reports on the optimum brake-power, surrogate fuel, engine emissions, and efficiency using hybrid model on high compression ratio diesel engines are very imperative for effective application of biodiesel in power and renewable energy generation. This study presents Dyacrodes edulis biodiesel engine performance and combustion release optimization using response surface methodology-genetic algorithm (RSM-GA) as well as the variation of key engine efficiency and exhaust release indices with brake power and fuel blend in a high compression ratio (CR) diesel engine. Combustion emission impacts of the blends with respect to petro-diesel decreased in values except for NOX. Brake thermal efficiency (BTE), brake specific fuel consumption (BSFC), brake mean effective pressure (BMEP), volumetric efficiency, and exhaust temperature increased with brake power while specific energies decreased with load. Optimum conditions obtained using integrated RSM-GA were 40.03%, 0.05 kg/kW-h, 0.03%, 132.30 ppm, and 18.84 ppm for BTE, BSFC, CO, NOx, and HC respectively at low factor (engine load, engine speed, and fuel blend) conditions. At the optimum conditions, the experimental validation results were 44.01%, 0.05 kg/kW-h, 0.04%, 130.05 ppm, and 20.33 ppm for BTE, BSFC, CO, NOx, and HC respectively. The application of the feedstock in compression ignition engine is viable.
Introduction
Globally, the fuel combustion process in the transportation sector is the second largest energy consuming after industrial sector and it accounts for about 30% of the world’s total delivered energy of which 80% is on road transport. The sector is currently responsible for nearly 60% of world’s oil demand and will be the strongest growing energy demand sector in future. 1 Almost all fossil fuel energy consumption in the transport sector is from oil (97.6%), with a small amount from natural gas while between 2006 and 2030, around three quarters of the projected increase in oil demand is to come from the sector. 2 The greatest concern is that petro-diesel fuel is largely consumed by the transportation sector and internal combustion (IC) engine has fallen victim of fossil fuel depletion and environmental degradation.3–5 In Nigeria, the regulatory agency for environmental protection has stipulated maximum values of 20 mg/Nm3 of particulate matter (PM), 300 mg/Nm3 of NOX, 500 mg/Nm3 of SOX, and 500 mg/Nm3 of CO from petroleum-chemical based industries. 6 It is obvious that the combustion engine emissions resulting from fossil fuel applications have resulted in growing concern over air quality and green house effects. 7 Carbon (II) oxide (CO) reacts with hemoglobin in the blood forming carboxy-hemoglobin (H6CO) rather than oxy-hemoglobin (H6O2), prevents oxygen transfer, causes headaches, nausea, fatigue to possible death, cardiovascular, and neuro-behavior, sulfur dioxide causes bronchi-constriction, ear-nose-throat (ENT) irritation, respiratory illness, and aggravates existing heart diseases, nitrogen dioxide results in pulmonary fibrosis, lung tissue damage, and pneumonia while particulate matter causes reduction in life expectancy, increase in chronic obstructive pulmonary disease and adverse effects on cardiovascular system. 5 It is therefore a fact that poor air quality is connected to several respiratory diseases such as asthma and their sufferers are more delicately affected by such deadly viral diseases like COVID-19 that is currently ravaging the entire globe.
Interestingly, the combustion of neat biodiesel (green diesel) decreases CO2 emissions by 46.7%, PM emission by 66.7% and unburned hydrocarbon by 45.2%. Recent reports say that lower smoke levels and higher thermal efficiencies are offered by the methyl esters of vegetable oils than neat vegetable oils. 8 Additionally, sulfur content of petro-diesel is 20–50 times that of biodiesel and biodiesel has demonstrated a lot of promising characteristics in the reduction of exhaust emissions. 9 There is need for a combustion engine to possess both high operational efficiency and low exhaust release impact. Studies on both factors are required to be done simultaneously. Consequently different combustion characteristics such as ignition delay; ignition temperature and spray penetration of different biodiesel fuels has been reviewed in the literature. 10
Also, it has been reported that the use of biodiesel in diesel engine results in slight reduction in brake power. 11 Also, Demirbas, 12 has determined the brake power values associated with CIE fuels under certain conditions while increase in torque and power using biodiesel derived from tobacco seed oil have been reported. 13 However, Kaplan et al., 14 have revealed significant loss in power at full load and high engine speed. More so, few reports have established that the exhaust emission of biodiesel is lower than that of petrodiesel, yet reports on the optimum brake power that releases the minimum exhaust emissions is yet to be fully addressed. The reports on effects of blends of various seed oil methyl esters with petrodiesel on engine performance and emission characteristics are many: canola oil biodiesel blends with petrodiesel effects on BSFC, fuel consumption efficiencies and emission characteristics, soybean oil biodiesel-petrodiesel blend effects on BSFC and emission characteristics, micro-algae-petrodiesel blend effects on torque and brake values, biodiesel-diesel-compressed natural gas blend effects on engine power, pyrolyzed oil-waste cooking oil biodiesel blend effects on brake thermal efficiency, peak cylinder, peak bum rate of combustion, CO2 and NOx emissions. 15 Furthermore, variations of cotton seed oil methyl ester blend with engine speed, variation of jatropha methyl ester blend with engine speed, coconut oil methyl ester blends with engine speed, soybean based methyl ester emission at varying engine speed, and linseed methyl ester emission at varying load have been reported. 16 Also, many researchers have reported significant reduction in brake specific CO and CO2 emissions while using biodiesel in many models of direct injection diesel engines.17–19
However, it is obvious that extensive reports handling the information on such engine characteristics as gross fuel consumption, volume efficiency, air/fuel ratio, exhaust temperature, brake specific energy consumption, etc. with engine brake power or torque is rarely presented. The knowledge lacking is required to prevent further engine modifications. Although, some reports on variation of BTE, BSFC, NOx, CO, and HC with engine speed, 17 variation of BTE, engine speed and torque, CO and smoke level against torque, variation of torque, SFC, CO, CO2, NOx, smoke against engine speed 18 as well as variation of exhaust gas temperature, CO, CO2, HC, and NOx with engine load 19 have been presented, yet reasons for variation of output power levels for biodiesel are not clear reported since power output is expected to correlate with the relative volumetric energy content of fuel. 20 Therefore, effects of other factors identified above appear in need of further investigations.
In addition to the importance of studying the effects of various biodiesel-petrodiesel blend or engine performance and emission characteristics at varying engine torque or power, the compression ratio (CR) of the tested engine should be of great interest. It determines the amount of energy an engine extracts from a given mass of air/fuel mixture based on its thermal efficiency and expansion cycle. 21 But most of the previous engine models studied and reported 22 such as: IDI Mitsubushi (18 kW), ChaiSX 175 motor (1.47 kW), diesel cycle four cylinder (0.399 kW), four cylinder water ISUZU EF (2249 kW), and one-cylinder, four stroke, DI engines 16 has CR values between 17:1 and 18:1. Therefore, this study would establish results from higher CR engines (Perkins 4:108 CR = 22:1) and compare its results in terms of engine performance and emission characteristics with those of the aforementioned class of engines.
Empirical study on the performance and combustion emissions of a diesel engine are quite complex, time consuming, and costly while monitoring of the emission process of an engine is very challenging. Consequently the application of artificial neural network (ANN) for predicting the brake power, torque, and emissions of CO, CO2, HC, and NOx in relation to engine speed, load, and fuel blends has been developed and the result showed high correlation coefficients 23 while back-propagation training algorithm of ANN is observed as appropriate to predict performance and exhaust emissions of engine for different speeds and different fuel blends. 24 Recently, the optimization of biodiesel combustion through parametric approach using response surface methodology (RSM) and the simulation analyses of indicated specific fuel consumption (ISFC), NOx and soot using design of experiments (DOE) is reported. 25 More importantly, the main advantage of response surface methodology (RSM) is its capability to minimize the number of experimental runs needed to give adequate evidence for statistically acceptable result.26,27 This makes it possible to predict the conditions required to obtain optimum responses through its robustness. 28 Also, the effects of engine parameters on power, static injection pressure (SIP), injection timing, fuel fraction and compression ratio characteristics of karanja oil biodiesel with petrodiesel using Taguchi based design of experiment in a single cylinder 5.2 kW diesel engine has been investigated. 29
The interpretation of RSM results is very complex, especially when optimizing a function with large number of independent variables. Additionally, due to drawbacks of conventional techniques such as poor convergence speed, cost, and poor output, there has been a huge tendency towards using combined methodologies to eliminate these disadvantages. Some of the newly developed models include: export systems, statistical method, fuzzy logic, wavelet transform, and genetic algorithm (GA). Among these, GA is cost effective and less time consuming technique 30 and it allows seeing interactions among experimental variables within the range studied. The GA is invented to mimic the natural behavior of evolution according to the Darwin principle of survival and reproduction. 31
Efficient optimization algorithms have been reported to be critical to the development of modern engine technology 32 In that report, experimental studies were carried out on optimizing the performance of a diesel engine running with soy biodiesel using hybrid particle swarm optimization (PSO) and GA method. Also, Lotfan et al., 32 investigated the combination of ANN and NSGA-11 for modeling emissions from direct injection dual-fuel (DDF) engine while recently a novel on-line optimization approach based on engine physical model using NSGA-11 coupled with a support vector machine method has been reported33,34 Considering the optimization and modeling of engine performance, and emission characteristics. major reports from the literature have focused on the application of Taguchi design of experiment (TDOE), convergence computational fluid dynamics (CFD), conventional RSM, particle swarm optimization and genetic algorithm (PSA-GA), combination of ANN, and non-dominated sorting genetic algorithm II (NSGA-II), NSGA-II coupled with supported vector machine (SVM), MIMO-ANN, and Nelder-Meads (NM). 15 It is obvious that the application of RSM coupled with genetic algorithm (RSM-CIA) has not been fairly or relatively reported in the literature for handling optimization of engine performance and emission characteristics.
Therefore, it is highly imperative to investigate fundamental combustion technologies through computational studies on internal combustion engines (ICE) involving energy and power generations. The application of response surface methodology integrated with genetic algorithm (RSM-GA) in the optimization of diesel engine performance (DEP) and exhaust emission release impact is scarcely reported in the literature. Also, integration with GA has been proposed as having advantage of saving energy, cost, and time. Using RSM and ANN models interfaced with GA offers a promising outlook in the estimation of the optimum variables which results in the above advantages. Moreover, only few of the researches are on tropical seed oils while none is presented on Dyacrodes edulis although its application as an underutilized but promising feedstock for biodiesel production has recently been established. 34 D. edulis is a tropical fruit tree that widely grows in West Central Africa and Gulf of Guinea. It is a perennial plant, with high oil content both in the seed (>59%) and the pulp (>48%) and yields over 8 t of oil per hectare of plantation. 15 A high biodiesel yield of over 94 wt% has been reported in both homogeneous and heterogeneous catalyzed methanolysis of D. edulis seed oil. It contains high oleic and unsaturated fatty acids that characterize typical high quality biodiesel fuel. 34 However, this seed is thrown away as waste after consuming the juicy pulp thereby making the seed oil to be obtained from a waste crop residue. All these characteristics of D. edulis clearly satisfy European Union (EU) biofuels sustainability requirements. Although, the authors have previously reported the application of MIMO-ANN and Nelder-Mead simplex algorithm in the engine performance modeling of D. edulis, 15 this present study is undertaken to investigate the optimum conditions for the combustion process of methyl esters derived from the seed oils of D. edulis in Perkins 4:108 CI diesel engine using specifically RSM-GA to harness the numerous highlighted advantages of this integrated statistical optimization techniques. Additionally, the variations of extensive engine performance and emissions characteristics with brake power and diesel surrogate fuels which have not been previously reported are investigated and presented in details.
Materials and methods
Oil extraction
The oil extraction, biodiesel production and characterization has been reported elsewhere 35 Oil was extracted from the seed meal using n-hexane with repeated measures to obtain most of the oil from the feedstock. The oil was thereafter recovered from the solvent using rotary evaporator. After distillation, the oil was left in the open for further drying and was subsequently degummed using 3%w/v of warm water. This mixture was mechanically stirred for 30 min at 70°C to hydrate the phospholipids and gums, thus separating them from the oil. These strong emulsifiers were removed by gravity separation using separatory flasks.
Biodiesel Production
One hundred millilitre (100 ml) of oil was heated at 80°C for 30 min using Gallenkamp magnetic stirrer thermostat hot plate to reduce the viscosity of the oil before subjecting it to two-step transesterification because of its high free fatty acid. The esterification was carried out using 50 ml of methanol and 0.2 ml of concentrated H2SO4 mixed together inside a 250 ml conical flask in a water bath at 50°C. The mixture was later added to 200 ml preheated oil inside a 500 ml conical flask and placed on magnetic stirrer with heater with continuous stirring for 1 h 30 min. Then a calculated amount of NaOH-catalyst (NaOH:oil of 1%w/w) and methanol (6:1 molar ratio of methanol to oil) was added to the esterified oil in a 500 ml volume reflux condenser fitted wh thermo-regulator heater and stirrer set at 65°C and allowed to stand for 65 min to allow clear separation of biodiesel from glycerol.
Characterization of the biodiesel
The physico-chemical analyses of the biodiesel and its blends with petrodiesel to ascertain their fuel properties were determined by ASTM and AOAC, 36 standard methods. The cetane index (CI) was determined using correlation given in (equation (1)), 37 while the cetane number (CN) was calculated using the equation developed by Patel (equation (2)). 37


Engine performance and emission evaluation
The engine performance studies were conducted in the Internal Heat Combustion Laboratory of Mechanical Engineering Department of University of Nigeria Nsukka, Nigeria. A four-stroke, four-cylinder, water-cooled, and direct-injection Perkins 4:108 (the engine specifications pictorial representation and diagram are given in Table 1, Plate 1, and Scheme 1 respectively) diesel engine connected to an eddy current dynamometer which develops a power output of 112 kW was used to study the performance and combustion characteristics of the biodiesel-diesel blends.
The CI engine specifications.


The picture of the test engine.

The test engine.
Dynamometer measurements
Precautions, preliminary checks, and measurements involved a rapid examination of the test bed, checking the positions of all controls and the state of fuel, lubricant and cooling water supply and measuring of ambient air temperature (Ta) and barometric pressure (Pa) using thermometer and aneroid barometer respectively.
The diesel engine was clamped to a test bed and with its shaft connected to the hydraulic dynamometer. The torque exerted by the engine through the turning rotor was shown by the dynamometer dial indicator. When the engine torques exceeds 80 Nm, weights graded in torque values were placed on the scale provided at the end of the spring scale as support for the circular scale. The total torque (T) was calculated as shown in equation (3). The brake power calculated by the dynamometer reading is given on the dynamometer circular scale. To increase the load on the engine, the wheel was rotated in the clockwise direction while rotating it in the anti-clockwise direction reduced the load on the engine.
Engine performance measurement
The engine was connected to the battery terminal. The start button was pressed while the choke was in the return position. The throttle was then placed at relatively low speed (800 rpm) and allowed to run idly for about 15 min to attain uniform temperature. The torque was recorded. The time for 50 cm3 of the fuel to be consumed at the speed of 1500 rpm was measured using a stopwatch. This was done by measuring the time for the fuel to move between appropriate spacers while the supply-tank fuel gauge was turned off. The manometer reading, exhaust temperature, oil temperature, and oil pressure were measured. Again, the readings on the two water systems for both engine and dynamometer were measured. The process starting from recording the torque was repeated for higher torque values: 10, 20, 30, and 40 Nm. The brake power values were derived from the relationship between the torques (5, 10, 20, 30, and 40 Nm) and the speed (equation (10)). Fuel volume, mass and air volume flow rates, brake power, brake mean effective pressure, swept volume, volumetric efficiency, brake thermal efficiency, specific fuel consumption, air/fuel ratio, etc. were calculated using equations (4) to (15).38,39
Engine combustion emission
The emissions characteristics from the exhaust were measured using Bacharach PCA2-15068 model gas analyzer (specifications and pictorial representation are shown in Table 2 and Plate 2 respectively). The gas analyzer thong (probe) was inserted into the diesel engine stack-gas stream from the exhaust pipe end of the diesel engine. The RUN/HOLD button is pressed to display the Combustion Test Run screen. The digital gas analyzer recorded the amount of the each gas and temperature from the composite exhaust stream and displayed the measured and calculated values on its LCD.


Where: TR– torque reading from the spring dial, TW– torque indicated on the weight, D-cylinder bore, n– cylinder number, hw– manometer depression, KD– coefficient of discharge, ρf– density of diesel fuel, T– engine torque, N– engine speed, and L– piston stroke.
Operating conditions of the gas analyzer.


The picture of thee gas emission analyzer.
Performance and emission optimization
Response surface methodology optimization
A five-level three-factor central composite experimental design (CCD) was used in this study. Speed, load, and fuel blend were the input variables. The factor levels were coded as −2 to +2 as shown in Table 3, with six axial points and six replications at the center points leading to a total number of 20 experiments. The choice of the response variables was based on preliminary reports and studies by Esonye et al. 15
Independent variables in the experimental plan for CCD.

According to the CCD, experiments were performed in order to find out the optimum combination and study the effect of process parameters on the various responses such as brake thermal efficiency, brake specific fuel consumption, CO2, NOX, and HC emission. The model fit was carried out by calculating the significance of each type of model. The sum of squared error (SSE), root mean squad error (RMSE), the R-squared and adjusted R2 were determined for linear model (LM), linear interactive model (LIM), pure quadratic model (PQM), and Quadratic model (QM). The results obtained were used to prove the adequacy of each model based on response surface analysis. 40 The R2 value shows how efficient the variability in the actual response values can be explained by the experimental variables and their interactions. The order of fitness of models was found to follow QM > LIM > PQM and LI based on the lowest values of SSE and RMSE and highest values of R2 for all the responses under study. Therefore, quadratic polynomial equation (equation (16)) was selected as the most appropriate model. Experimental data from CCD was analyzed using regression of MATLAB R2009b mathematical software 8.5 version and fitted to a second order polynomial model (equation (16)) in order to identify all possible interactions of selected factors with responses.

Where Y is the response variable, i and j are the linear and quadratic coefficient, respectively. K is the number of factors studied and response, a0, ai, aii, and aij are the regression coefficient obtained for constant, linear, quadratic, and interaction terms respectively; xi and xj are independent variables optimized in the experiment and e is random error.
RSM-GA optimization
The RSM model was coupled with genetic-algorithm (GA) tool kit in MATLAB R2009b (Mathworks Inc., Natick, MA, USA) to optimize the responses. Genetic algorithms are “a particular” class of evolutionary algorithms that use techniques inspired by evolutionary biology such as inheritance, mutation, selection, and crossover or recombination. The evolution normally begins from a population made up of randomly generated individuals and happens in generations. In each generation, the fitness of every individual in the population is evaluated; multiple individuals are chosen from the current population based on their fitness, and modified to form a new population. Flowchart of how the algorithm was applied is shown in Figure 1 and the parameters associated with the implementation of these procedures done in software are shown in Table 4.

Flowchart of GA.
Set genetic algorithm.

Statistical analysis of the models
The accuracy of the models was determined by using equations (17) to (22).


Where: Yie is the experimental data, Yip is corresponding data predicted, Ye is the mean value of experimental data, and n is the number of experimental runs, R2 is coefficient of determination, Adj. R2 is adjusted R2, MSE is the mean squared error, RMSE is root mean squared error, SEP is the standard error prediction, and AAD is average absolute deviation.
Results and discussion
Fuel qualities of the biodiesel blends
The result of the fuel properties of the African pear seed oil biodiesel (B100), its blend with petro-diesel (B75, B50, and B25) and petro-diesel (D) in comparison with the ASTM D 6751 standard are presented in Table 5. The results of similar works from literature are equally presented for comparison.41–45 The kinematic viscosities of all the blends of African pear seed oil methyl ester (APSOME) with petrodiesel were all found to be higher than the fossil-diesel and within the range (1.9–6.0 mm2/s) needed for optimum functioning of the diesel engines. Therefore, there would be no tendency of the fuel blends giving any fuel injection flow challenges. The kinematic viscosity results compares with the results obtained elsewhere 46 using jatropha oil biodiesel-diesel blends. Again, all the blends had specific gravity values within the tolerable limits of 0.88 (ASTM D 6751) allowable for effective air fuel injection systems. The ash content of the blends increased with increase in the amount of petrodiesel in the blends. This could be due to increase in the amount of mineral elements introduced from the petro-diesel. 47 The flash point (FP) values decreased with increase in petrodiesel in the blends. The flash point of B25 (90 °C) was quite lower than the minimum 130°C stipulated by ASTM D 6751. This would result in B25 having tendencies of fire outbreaks and be classified as hazardous. Similarly, the FP of jatropha biodiesel-diesel blend has been reported with higher amount of petrodiesel in the blends. 48 Again, the calorific values decreased with increase in biodiesel in the blends. Similar trend has been observed and recorded by using jatropha seed oil biodiesel and its blend with petrodiesel where 40.88 and 43.09 MJ/kg where recorded for B50 and B20 respectively. 49 The result of the copper corrosion (class1) is less than the maximum class three stipulated by ASTM D 6751. Therefore, the blends would not have corrosion tendencies on copper, brass, and bronze materials. The cetane numbers of the blends were found to increase with increase in biodiesel concentration. This is because the cetane number of the biodiesel is naturally higher than that of petrodiesel. The cetane number of 48.22 obtained from the characterization of petrodiesel compared with 47 and 51 min standards for biodiesel according to ASTM D 6751 and EN 14214 respectively. However, it is still within the standard of 40–55 for petrodiesel. 1 The sulfur content (SC) of the blends increased with increase in petrodiesel. The SC of B100 and B25 were all below 20.50 ppm recorded for the petrodiesel. However, sufficient level of SC in fuel is essential for the lubricating and functioning of fuel system machinery such as fuel pumps and injectors. 47 The result of the SC is equally in line with EPA regulation standard (15 ppm max) on high way diesel fuel. 48
Characteristics of the APSOME blends in comparison with literature reports, petrodiesel, and standards.

Sap: saponification.
EPA standard on high diesel fuel.
Engine performance results
The effect of biodiesel on engine performance depends on the relationship between the fuel injection system and the fuel properties. 16 Figure 2 shows that the air/fuel ratio (A/F) increased with increase in load and brake power for all the blends. It means that less amount of air is required for the combustion of the fuel blends at higher brake powers than at lower brake powers due to the observed less specific fuel consumptions at higher brake powers. Again, the petro-diesel had the least air/fuel ratio while the blends with more biodiesel had higher values of A/F probably due to the higher presence of hydrocarbon in the structure of biodiesel (C22H43O2) than in petrodiesel (C16H34). 11 The gross fuel consumption increased with increase in load and brake power and less biodiesel (Figure 3) for all the blends.

Air/fuel ratio versus brake power.

Gross fuel consumption versus brake power.
The brake mean effective pressures (Bmep) of the blends were the same at different specific loads because the same value of speed was used as depicted in Figure 4. However, the highest value of 2.31 bar was obtained at full load and 0.354 bar at 5 Nm. The variation of volumetric efficiency with brake power (Figure 5) followed similar trend with Bmep (Figure 4). The highest values of 88.82% was obtained for all the blends at brake power of 6.23 kW and torque of 40 Nm while the lowest value of 67.26% was obtained at brake power of 0.785 kW and torque of 5.0 Nm. Lower values below 80% obtained at lower brake powers could have been caused by increase in residual gas, poor back flow from inlet manifold to combustion chamber and higher gas temperature in the cylinder than in the inlet manifold.50,51 From Figure 6, there exists a linear relationship between the brake power and load. The engine torque was varied between 5 and 40 Nm while the brake power ranged between 0.785 and 6.283 kW. The increase in the torque or load resulted in increase in brake power. The same trend was observed in all the blends. This is possible because, brake power is a product of the load or torque and speed of the engine. Therefore, running the engine at specific speed and varying load gave a linear relationship.

Brake mean effective pressure versus brake power.
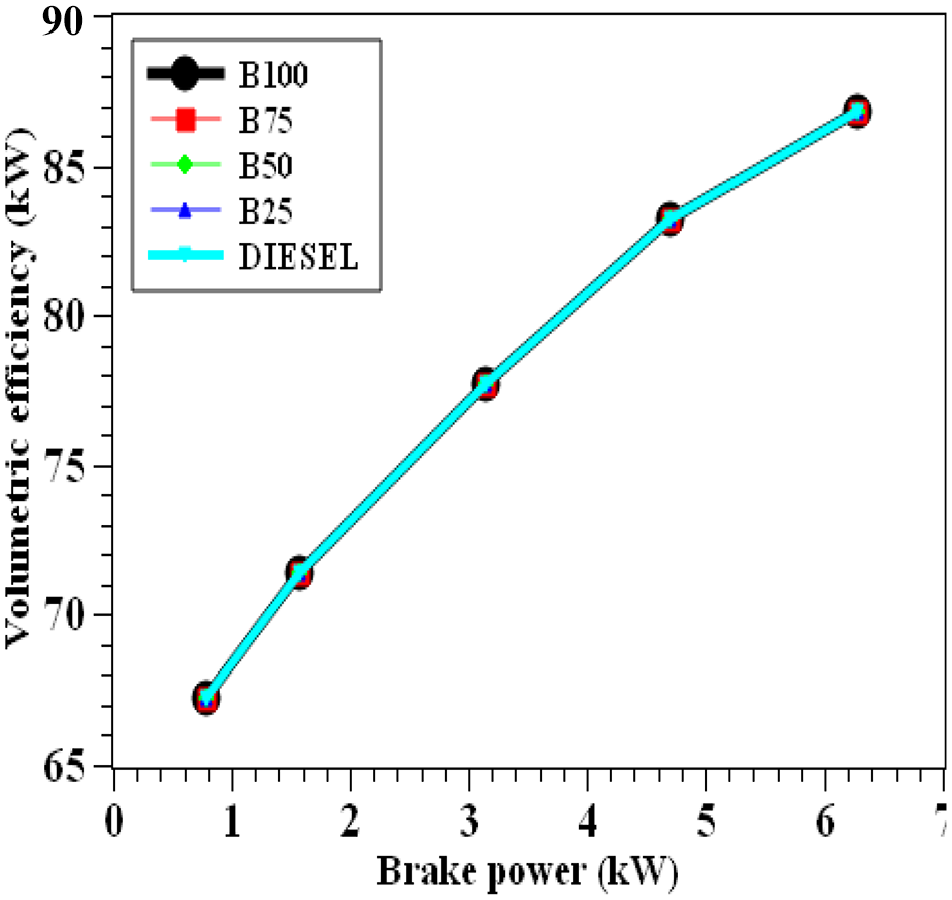
Volumetric efficiency versus brake power.

Torque versus brake power.
Figure 7 shows the variation of brake specific fuel consumption (BSFC) with brake power. From the graph, it was observed that as engine brake power increased, BSFC decreased for all the fuel blends. The BSFC of biodiesel was higher than diesel at higher load probably due to lower heating value and higher density of biodiesel that resulted in higher fuel flow-rate. 52 Again, higher proportions of the biodiesel in the blends increased the viscosity which resulted in the increase in the BSFC. 53 More so, as the concentration of biodiesel increased, the fuel consumption tended to decrease for the blends because the mass flow rate of the fuel decreased. The minimum BSFC for B25 fuel was 1.11 and 1.09 kg/kW-h for petro-diesel. The BSFC for B50, B75, and B100 were 0.968, 0.96, and 0.96 kg/kW-h at 5 Nm against 1.19 kg/kW-h for diesel. The BSFC decreased with increase in power, while there was no significant difference in the BSFC between 30 and 40 Nm. Therefore, the minimum specific fuel consumptions for APSOME blends could be obtained at brake power of 4.712 kW.
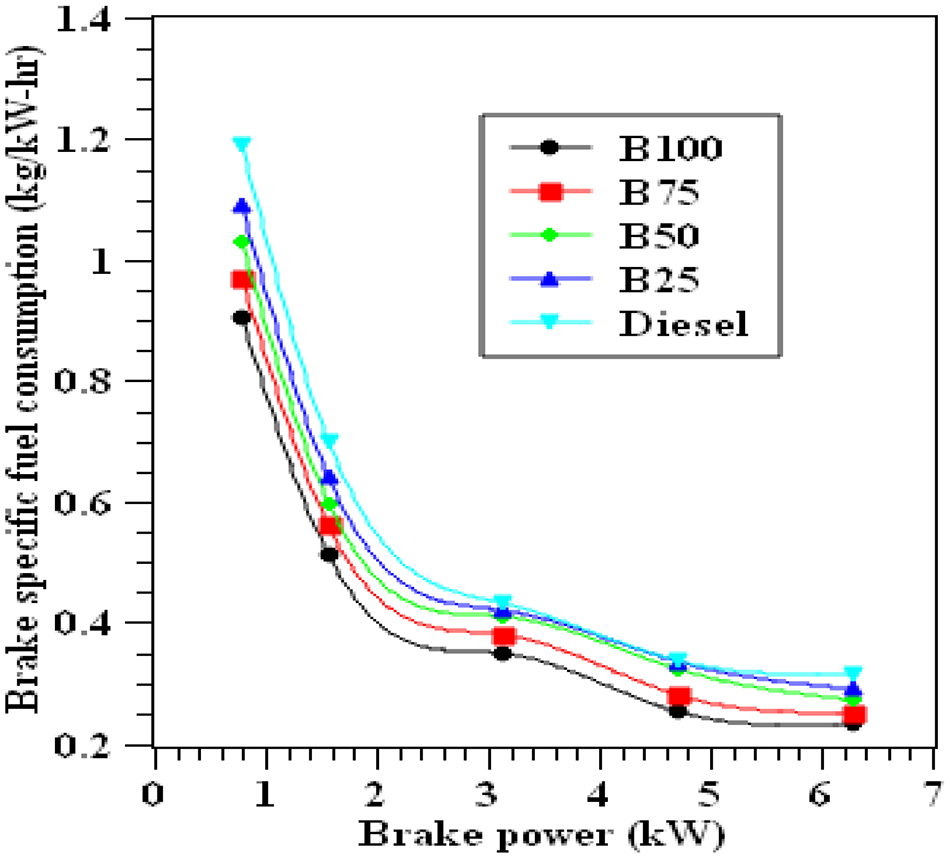
BSFC versus brake power.
Since biodiesel blends have different calorific values, viscosity, and density, therefore BSFC may not be a very reliable tool to compare the fuel consumption per unit power developed. Wahome et al., 39 has therefore, advocated for brake specific energy consumption (BSEC) to be used to compare the biodiesel blends on the basis of energy required to develop unit power output. In this study, BSEC was found to be higher at lower loads and eventually decreased at full loads (Figure 8). The BSEC of the blends with biodiesel was found to be lower than that of diesel. It indicates that energy released by biodiesel to develop unit power is more than that of petrodiesel fuel 46 Similar to the changes observed on the BSFC with increase in brake powers, BSEC decreased with increase in power, while there was no significant difference in the BSEC between 30 and 40 Nm. It therefore implies that the minimum specific energy consumptions for APSOME blends could be obtained at brake power of 4.712 kW (30 Nm).

BSEC versus brake power.
The variation of brake thermal efficiency (BTE) of the engine with various blends is shown in Figure 9. Among the blends, B25 was found to have the lowest thermal efficiency of 32.09% while for diesel it was 26.5%. But for B50 and B75 it was 36.22% and 38.54% respectively. Similarly, a thermal efficiency of 38.19% and 38.95% has been reported for B50 and B20 blends using corn oil in single cylinder CI engine. 54 Also, as the portion of biodiesel fuel in the blends increased, the BTE increased. This is attributed to increase in the rate of diffusion and better atomization of blends with more biodiesel that resulted in their combustion.28,53 The difference in the BTE was insignificant compared to the change observed between the lower brake powers. It implies that 30 Nm load at 1500 rpm engine speed would give the best BTE among the range of factors studied. Similar results have been reported in the literature. 55 Hence, engines fueled by African seed oil biodiesels would run smoothly with longer maintenance intervals than those fueled by petro-diesel.
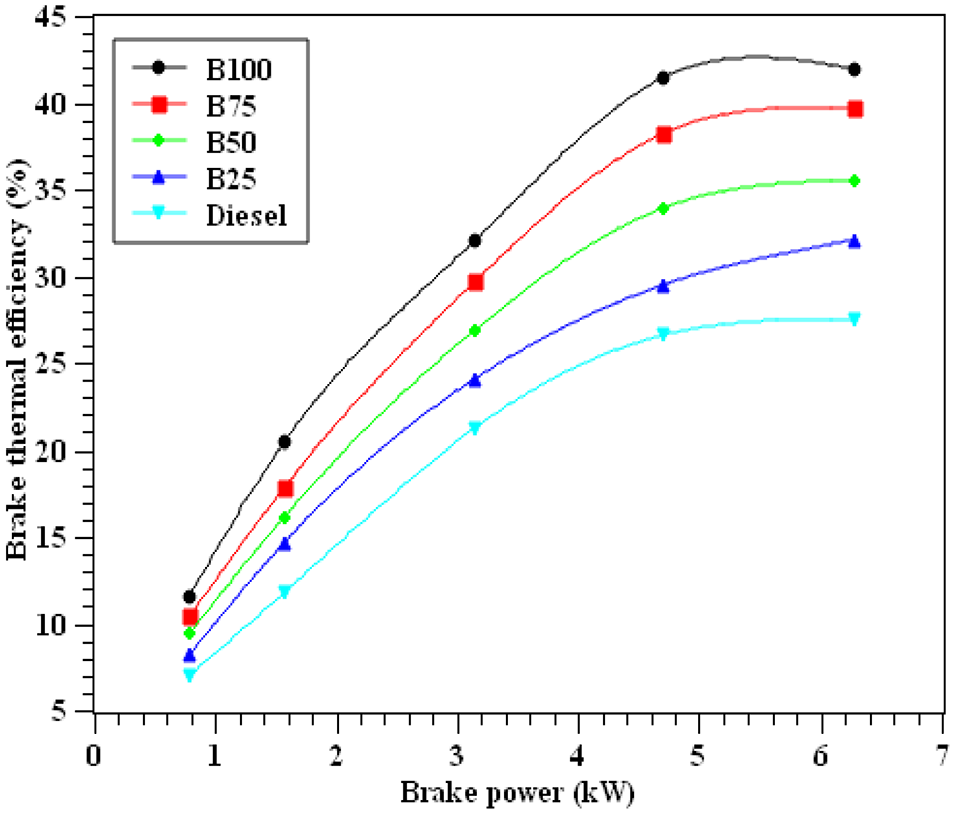
BTE versus brake power.
Basically the diesel engine has highest thermal efficiency of any regular internal or external combustion engine due to its very high compression ratio (CR). Low-speed diesel engines as used in many applications where overall engine weight is relatively unimportant can have a thermal efficiency that exceeds 50%. The highest result obtained in this study is about 44% which is fairly higher than 30% obtained at B50 at same load using mahua and rice bran oil.8,53 However, the CR of their engine (17:1) is found to be quite less than 22.1:1 CR of the diesel engine used in this study. Notwithstanding, BTE up to 43% has been reported using motor diesel chang Chai 8× 175 run with B40 of jatropha biodiesel-petrodiesel blend. 22 Higher CR permits the same combustion temperature to be reached with less fuel while given longer expansion cycle. 21 Although, some researchers have reported that low calorific value of biodiesel could lead to lower BTE, the nature and modes of operation of the diesel engine can affect the BTE and so many researchers have reported that high CN and high oxygenated nature of biodiesel enhance BTE compared to petrodiesel fuel as observed in the experimental result of this study. 56
Combustion emission results
The variation of exhaust gas temperature with brake power is presented in Figure 10. It showed an upward trend with increase in the concentration of biodiesel in the blends. This trend is similar to what was reported previously using jatropha curcas on Kirloskar Tv.1 diesel engine and Five-gas analyzer. 29 The increase in the exhaust gas temperature may be due to the high viscosity of the biodiesel which resulted in changes in the injection. 8 The highest exhaust gas temperatures recorded for B100 in this study was 232°C at full load (40 Nm). At all loads, petro-diesel was found to have the highest exhaust gas temperature (250°C) while B25 recorded the highest exhaust temperature (248°C) among the blends at full load. The highest exhaust gas temperature obtained was below 260°C against about 349°C reported by Haiter et al., 8 using mahua biodiesel . The exhaust gas temperature is affected by density, viscosity, calorific value, etane number etc. Since it has been reported that low EGT implies good combustion, less heat loss, effective usage of thermal energy, the lower EGT recorded in this study against reports from Haiter et al., 8 could have been caused by better atomization resulting from low density and low viscosity that promoted shorter ignition delay, earlier start of combustion and shorter cylinder power cycle.44,57,58 The variation of HC emissions with brake power is shown in Figure 11. The emission of various fuels was lower at low and medium loads but increased at higher loads. This could be because at higher loads, when more fuel is injected into the engine cylinder, the availability of free oxygen is relatively less for the reaction. 8 Again, at higher loads the increase in viscosity increases the emission levels. 30 Equally, it was observed that the higher the biodiesel in the blends, the lower the HC emissions. This is because higher oxygen contents of the biodiesel promotes complete combustion and reduces HC emissions. 33

Exhaust gas temperature versus brake power.

HC emissions versus brake power.
Figure 12 shows the variation of CO2 with brake power. The CO2 emission increased with load and concentration of biodiesel blends while B100 emitted the highest CO2 which indicates complete combustion of the fuel. Higher density of the blends probably increased the fuel flow rate as the load increased which in turn increased the CO2 emission with load. Fortunately, the CO2 emission from biodiesel engines can be absorbed by the plants for photosynthesis. Therefore, the CO2 level in the atmosphere may be kept in balanced condition due to the increased greenery and plants cultivated to yield bio-fuels. The variation of oxides of nitrogen (NOx) with brake power is shown in Figure 13. NOx emission is observed to increase significantly with load. It has reported that oxygenated fuels results in higher combustion temperature which promotes higher NOx formation (oxidation of nitrogen molecules at high temperature inside the cylinder is the cause of NOx formation as by-product). 8 Therefore, the presence of oxygenated biodiesel in the blended fuels could have resulted in their higher NOx formation than found in diesel fuel. Also, at high engine torque, combustion temperature is increased because of the slow cooling rate and poor atomization in the premixed region). 16 Conversely, lower NOx emission has been observed by several researchers while applying ethanol-gasoline blends and this was attributed to higher heat of vaporization of ethanol which reduces the combustion temperature. The results obtained in this study agree with the previous reports. 46 However, based on this study, to obtain a minimal NOx emission requires running the engine at low brake power and with B25 fuel blend. The adjustment of the injection timing, introduction of exhaust gas recirculation and application of nano additives have been suggested as ways of reducing the NOx emissions of biodiesel.16,59
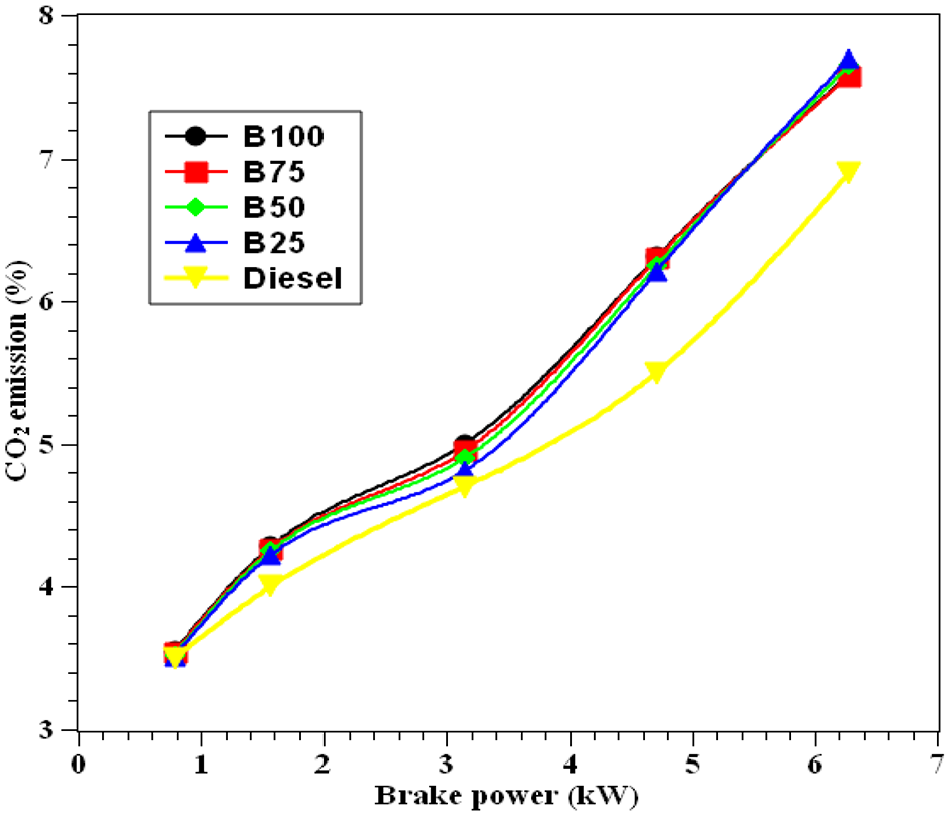
CO2 emission versus brake power.

NOx emission versus brake power.
Figure 14 shows the percentage change in the exhaust emissions against the blends. At high torque of 40 Nm, the percentage change of CO, and HC showed decrease in values as the biodiesel content in the blends increased, while CO2 and NOX showed increase in values with increase in biodiesel in the blends. In this study, about 35% reduction in HC emission was obtained using 25 vol.% fuel blend which compares well with 22.32% reduction reported by other authors using 10 vol.% fuel blend.60,61 The percentage change in the CO emissions at 5 and 20 Nm for all the blends were negative. The percentage change of CO at 10 Nm was the same for all the blends. The value of the percentage change of CO emission at 30 Nm was highest for B25 followed by B75 and least for B100. The percentage emission change of CO was more pronounced than other emissions at low biodiesel blends but same with CO2 and NOX at B100. The percentage change of NOX emission showed least values at 40 Nm and B25 blend (−7.89%). The variation of carbon monoxide (CO) with brake power is shown in Figure 14 for APSOME blends with diesel in comparison with diesel fuel. In general, CO is produced from partial combustion because of insufficient oxygen to produce CO2. It is a product of the imperfect combustion of hydrocarbon fuels and is affected by engine speed, air-fuel ratio, fuel pressure, fuel type, and injection timing. 16 The carbon monoxide emissions are found to have slight increase with increase in load. This is not surprising as at higher brake powers, incomplete combustion tendency would be higher due to high rate of fuel injection which would result in small amounts of other compounds (CO and aldehydes) which could eventually degrade into CO2. 63 Although, the CO emission for B25, B50, B75, and B100 fuels were not much different from those of diesel at low and medium loads, it is observed that the engine emits more CO for diesel at lowest brake power conditions than in the other blends. Similar results have been reported. 48 Meanwhile, at full load the CO emission for B100 of APSOME became about 10.71% higher than that of diesel

Variation of blends’ CO emission with brake power.
Engine performance and emissions optimization
RSM optimization
A central composite design (CCD) was applied to develop a relationship between the factors affecting the BTE, BSFC, and combustion emissions. The experimental design matrix and the response surface results for process optimization are shown in Table 6. The minimum experimental BTE value of 14.56% was recorded at 10 Nm load, 40% fuel blend, and 2000 rpm engine speed while the maximum BTE value of 35.00% was obtained at 20 Nm engine load, 80% fuel blend, and 2000 rpm engine speed. Also, the minimum predicted BTE value of 14.83% and maximum predicted BTE value of 36.59% were recorded at same conditions of experimental minimum and maximum BTE values. The minimum experimental BSFC was 0.14 kg/kW-h against 0.13 kg/kW-h as predicted at 20 Nm. However, the BSFC maximum experimental and predicted values were 0.64 and 0.63 kg/kW-h respectively at 15 Nm, 20% fuel blend, and 2500 rpm engine speed conditions. Also, the minimum CO emission obtained for experimental and RSM predicted were 0.12 and 0.13 vol.% respectively at 15 Nm engine load, 20% fuel blend, and 2500 rpm engine speed conditions. The maximum CO emission for experimental and RSM predictions were 0.48 and 0.47 vol.% respectively at same conditions of load (15 Nm) and fuel blend (60%) and varying speeds of 2500 and 3500 rpm respectively. The NOx minimum experimental and RSM predicted responses were 300 and 309.56 ppm respectively at 10 Nm, 40 vol.% fuel blend and 2000 rpm engine speed conditions while the NOx maximum experimental and RSM predicted responses were 830 and 830.27 ppm at 15 Nm, 100 vol.% fuel blend and 2500 rpm engine speed. Also the HC emission minimum experimental and RSM prediction responses were 20.15 and 20.30 ppm respectively at 20 Nm, 80 vol.% fuel blend and 2000 rpm engine speed condition while the maximum HC emission obtained through experimental and RSM predicted response were 38.70 and 38.59 ppm at the same engine conditions of 15 Nm engine load, 60 vol.% fuel blend, and 1500 rpm as engine speed.
CCD of the variables with experimental and predicted responses.

Exp: experimental; Pred: predicted.
Regression analysis, model equations, and ANOVA
The general approach to fit empirical model with collected response variable data is regressional analysis and responses obtained in Table 6 were correlated with the three independent variables using the polynomial equation in equation (16). Considering the p-values ≤0.05 from the results of the ANOVA based on the effects of experimental factors (X1– load (Nm), X2– fuel blend (vol.%), and X3– engine speed (rpm) on the responses as contained in Table 6, all the model terms were found to be significant. Summaries of the analysis of variance are tabulated in Tables 7 and 8. The
ANOVA for response surface quadratic models.
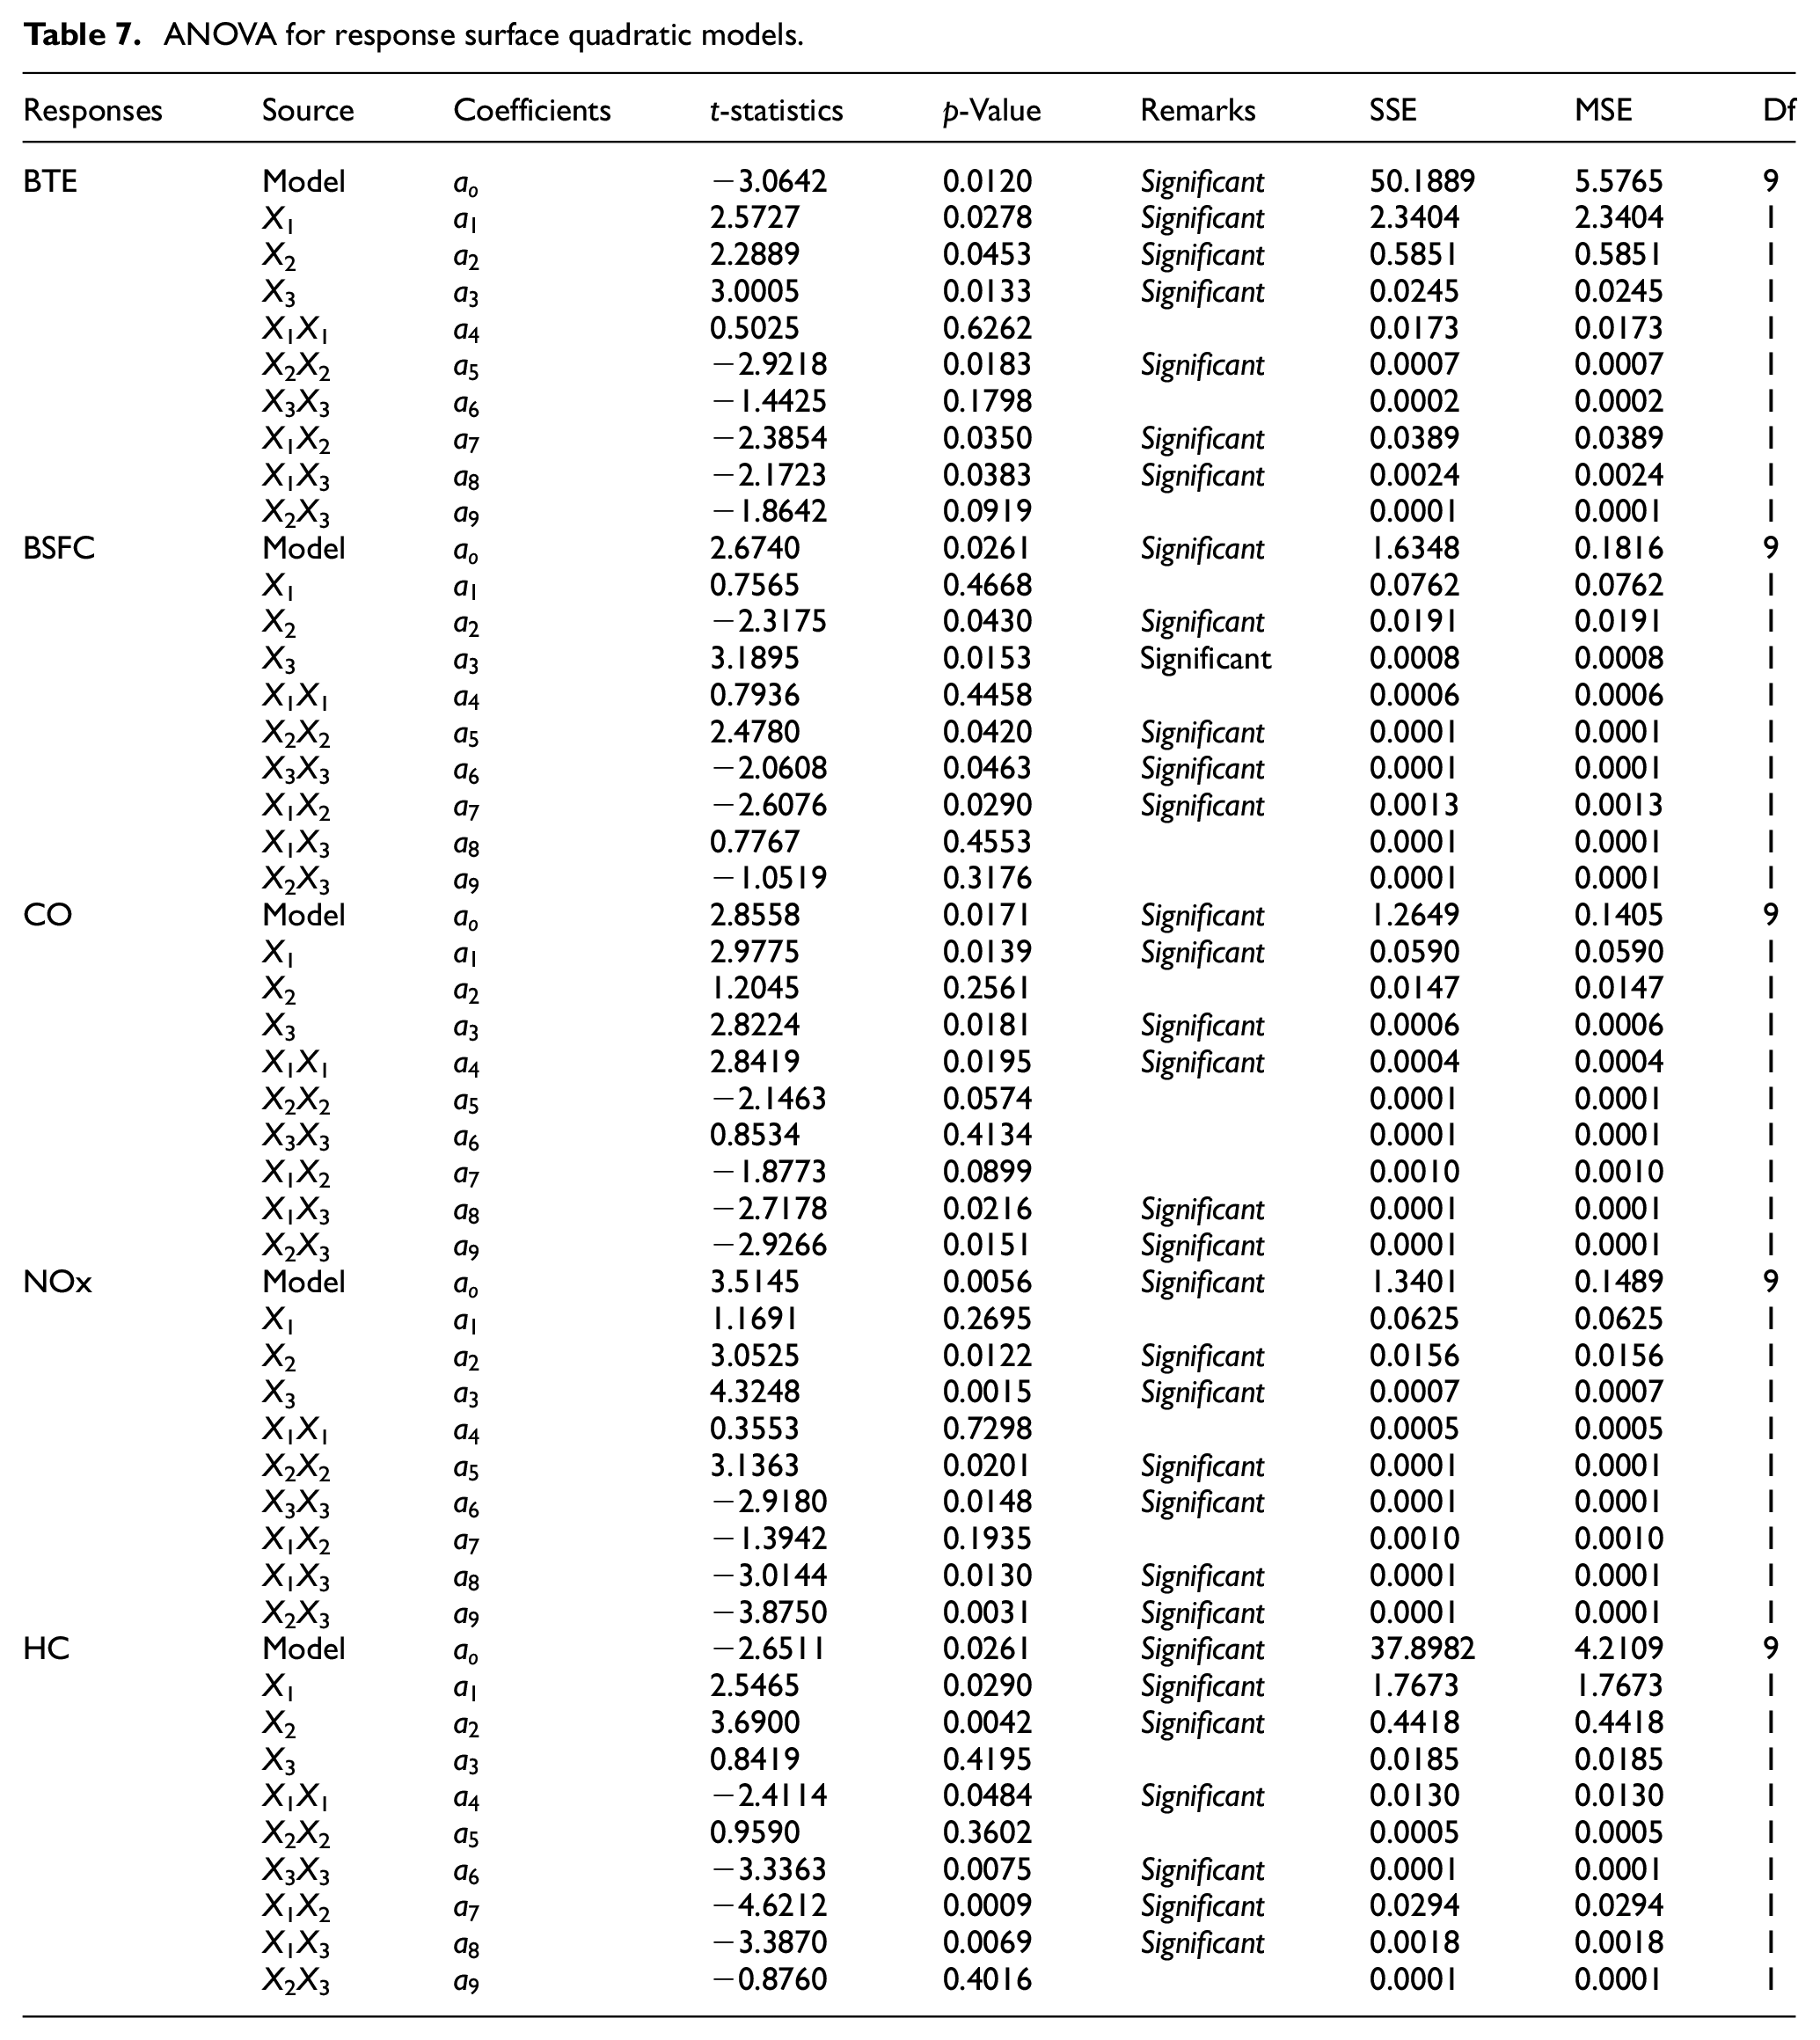
ANOVA for response surface quadratic model continues.

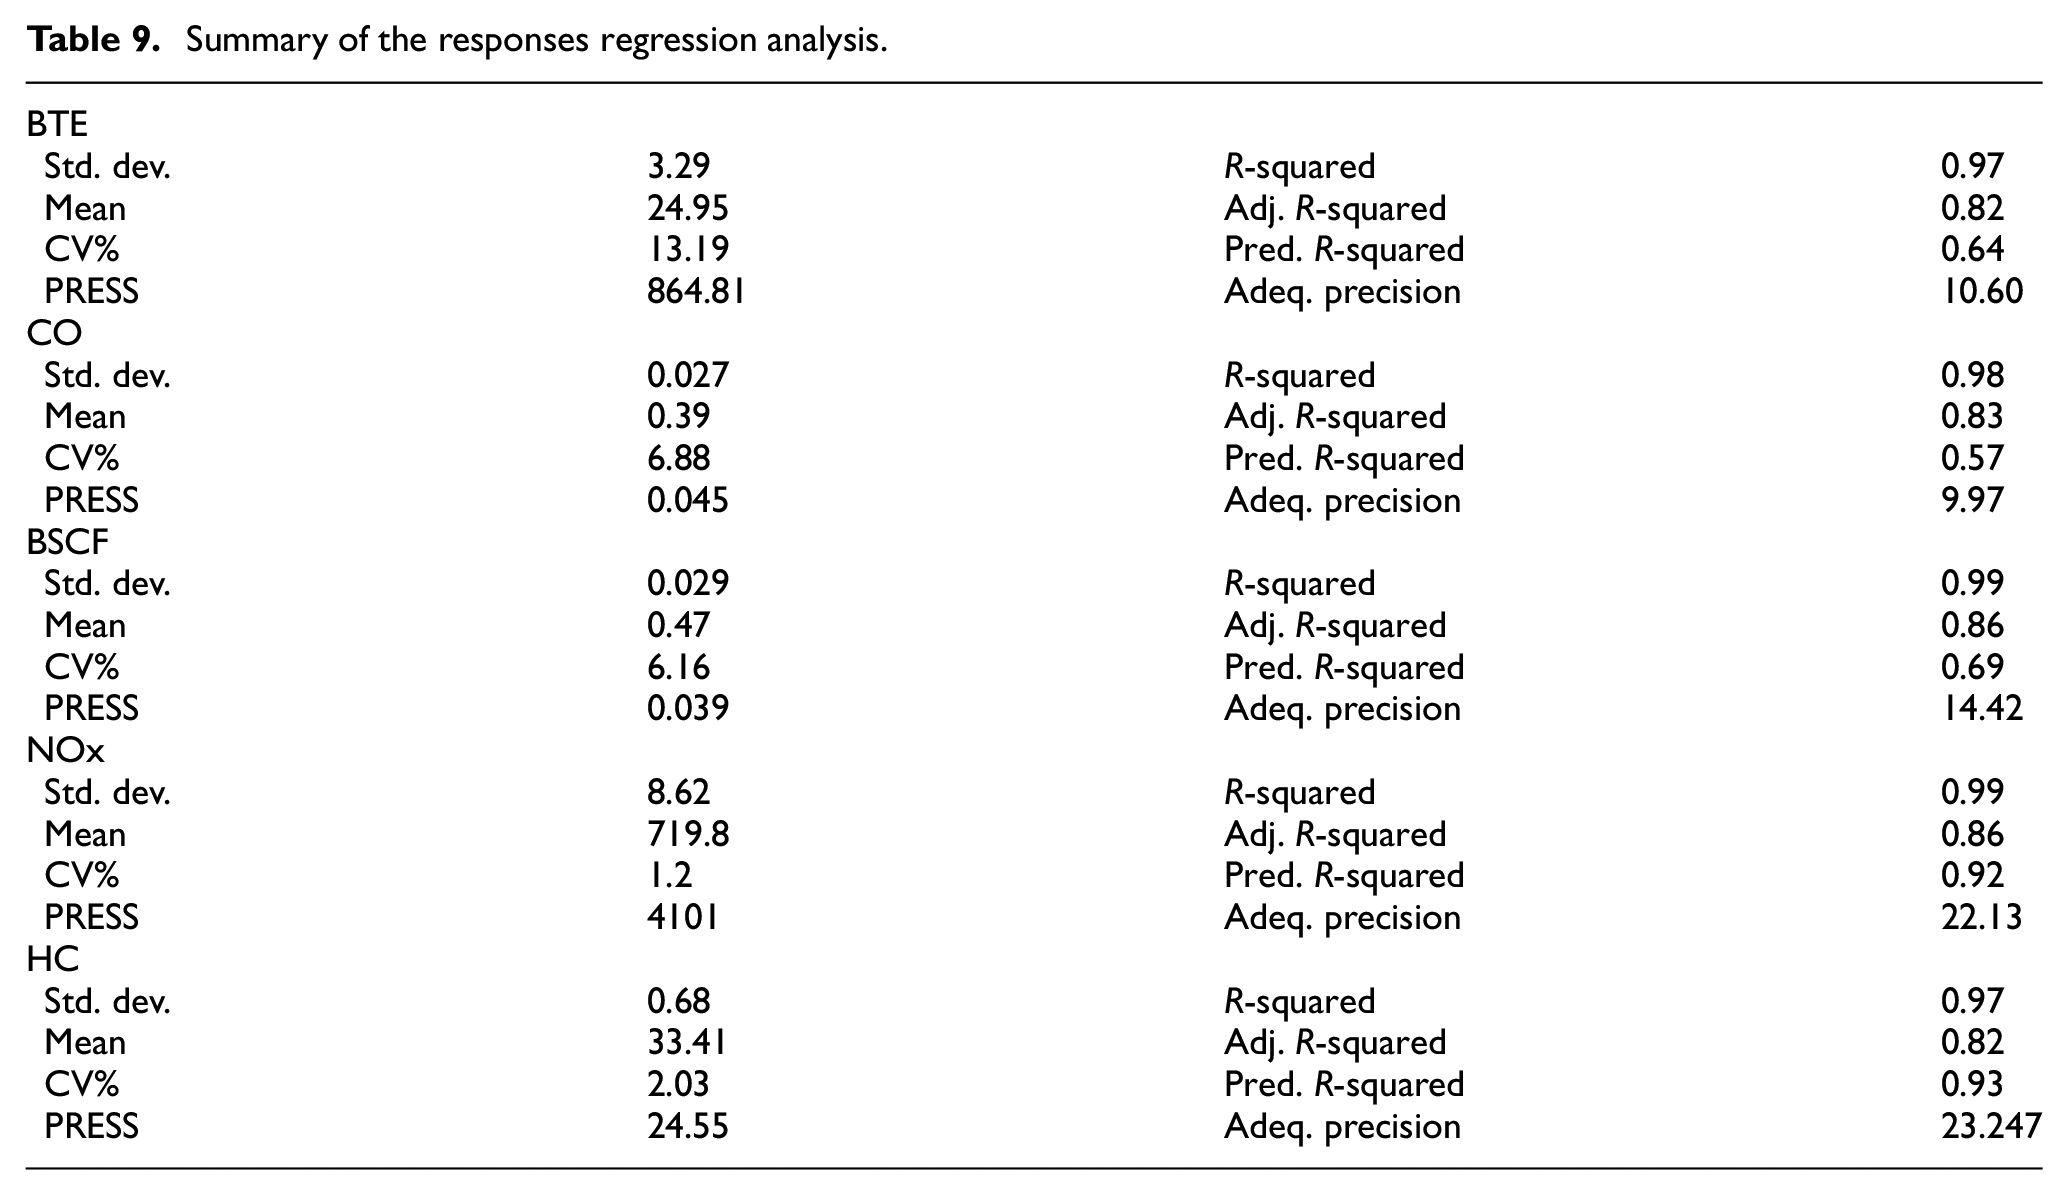
Summary of the responses regression analysis.
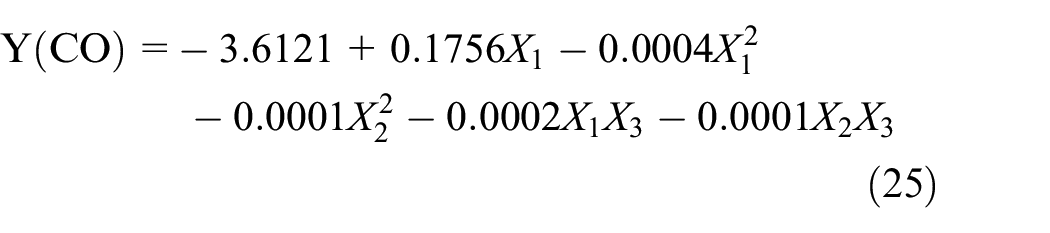
From the regression analysis, the most fitted models based on the coded values and significance of factors obtained are shown in equations (23) to (27). The significance was justified on the bases of the low p-values (≤0.05) and larger t-values.


The effects of the process variables on the responses
The CCD of RSM allows for the establishment of the interactions among load, engine speed and percentage fuel blend through a valid model that relates these factors to BTE, BSFC, CO, NOx, and HC emissions as well as the justification of the optimum conditions for biodiesel combustion.
Considering Figure15(a) to (c), increase in fuel blend increased BTE when the fuel blend was within 20–60 vol.%. This means that incomplete combustion occured below and above 20 and 60 vol.% fuel blends respectively. Again, increase in fuel blend and speed with decrease in load resulted in the increase of BTE. This phenomenon is attributed to the lubricating effect of the biodiesel and its oxygen content that promote efficient combustion. 15 It was also observed that decrease in speed and load decreased BTE all through the speed and laod range studied. Considering the interactive effect of fuel blend and load, the fuel blend beyond 60 vol.% resulted in decrease in BTE with optimum values of 60 vol.% fuel blend and 20 Nm load. It was observed that the interactive effect of load and fuel blend had the greatest effect (BTE > 35%), followed by load and speed (BTE < 35%), and least by speed and fuel blend (BTE < 32%).
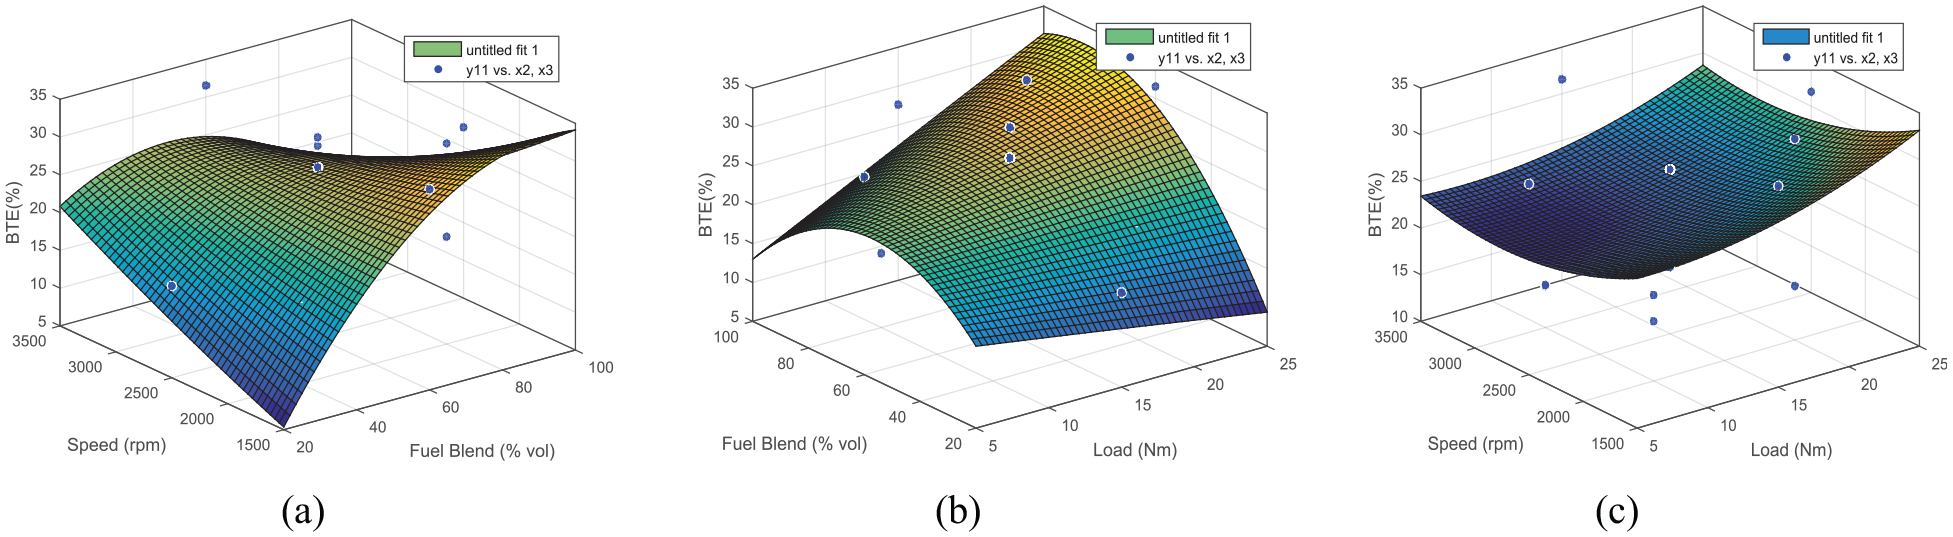
Response surface plots of the three variables and BTE.
In Figure16(a), combination of low fuel blend and low load resulted in high BSFC. High speed and load gave high BSFC (Figure 17(b)) while low speed and fuel blend gave high BSFC (Figure 17(c)). Typically, higher speed encourages low fuel consumption. This fact was shown at higher loads from 20 Nm and as the speed increased from 1500 rpm up to about 3000 rpm. Similar results have been reported concerning the decrease of BSFC with increase in speed up to 2000 rpm. 48 Therefore, to achieve minimum BSFC, high factors of fuel blend and low factors of speed and load are required. This implies better economic and eco-friendly results since it would require more concentrations of biodiesel and less petrodiesel to acheive the result.

Response surface plots of the three variables and BSFC.

Variation of percentage emissions with the blends.
Figure 18(a) to (c) shows the interactive effects of the variable on the CO emisssion. It was observed that simultaneous increase in load and fuel blend while keeping the engine speed at a contant rate of 2500 rpm resulted in increase in CO (Figure 15(a)). This may be attributed to the joint effects of increase in engine turbulence and oxygen content of the fuel blend. Low fuel blend and load reduced CO emission but high fuel blend and load beyond 15 Nm reduced the CO emission. Similar trend was observed in the interactive effect of load and speed (Figure 15(b)) as well as speed and fuel blend (Figure 15(c)) on percentage volume of CO emission.

Response surface plots of the three variables and CO emission.
The main and interactive effects of load, fuel blend, and speed on NOx emission is shown in Figure 19(a) to (c). Low factor values of speed and fuel blend reduced NOx emissions. This supports the fact that high concentrations of biodiesel results in higher cylinder temperature which gives rise to higher NOx emissions. Therefore, to minimize NOx emission while running APSOME-petrodiesel blend in CI engine requires low concentrations of the biodiesel, low speed, and minimal engine load.

Response surface plots of the three variables and NOx emission.
Figure 20(a) to (c) represents the interractive effects of fuel blend, engine speed and load on the HC emission. Considering Figure 18(a), low factors of load and fuel blend favored low HC emissions when the speed is kept at a constantly at 2500 rpm. But varying the speed and the engine load at constant biodiesel concentration of 60 vol.% shows that decrease in speed and load results in high HC emissions (Figure 18(b)). When the effects of speed and fuel blend were considered at constant engine torque of 15 Nm, up to 60 vol.% concentration of the biodiesel in the blend, HC emission increased. The decrease in the HC emissions beyond 60 vol.% fuel blend could be due to improved combustion resulting from high oxygen content of biodiesel but the reverse trend observed earlier could have been due to low air-fuel ratio at higher blends.

Response surface plots of the three variables and HC emission.
RSM versus RSM-GA optimization
The results of the optimized conditions obtained using the numerical optimization tool of RSM and GA are presented in Tables 10 and 11 respectively. For the GA loop, a population size of 100 was chosen because on repeating the GA more than 100 iterations were coming. The scaling, selection, mutation, and crossover functions were assigned as Rank, Stochastic uniform, Heuristic and scattered respectively. Other functions were selected as the default by GA itself for the optimum result. The GA optimization parameters were determined by a trial-and-error method. The best condition was defined in which the initial range was [1,100], the selection function was stochastic uniform, the values of the elite count and crossover fraction were, respectively, equal to 2 and 0.8, and the mutation and crossover function were selected as the migration, stopping criteria, output function and level of display, respectively. The process of GA optimization continued until convergence forms a best-optimized result for the variables. The results of RSM-interfaced with GA showed better conditions and responses than RSM. The results show improved conditions and responses in comparison with RSM (Table 10). Using the RSM-GA optimized solution, the validated experimental run for Dyacrodes edulis seed oil biodiesel performance in CI engine was carried out by carrying out three independent experimental replicates under this optimal condition. The results of the experimental values obtained were very close to the ones calculated from the model. Results suggested that the optimal conditions attained had the least error and can be practically applied in the viability and feasibility analysis of the application of seed oil derived from Dyacrodes edulis in biodiesel production Therefore, the optimal responses and their conditions provided in Tables 10 and 11 were presented as viable route for excellent engine performance and low combustion emission through RSM-GA and the optimized emissions are found to compare with international standards for environmental protections. 9 From the optimized results of RSM-GA, the results appeared better than both RSM results and those of Nelder Meads’ simplex algorithm previously reported. 15 This is evidenced by its higher thermal efficiency, lower specific fuel consumptions and lower exhaust emissions. Also, the conditions of operations showed that the above improved results were obtained at higher amount of biodiesel in the fuel mixture than the previous results. 15 It implies that RSM-coupled with GA showed a better optimized route for higher engine efficiency (performance), lower fuel consumption, and combustion emissions.
Optimal conditions for engine performance and emission using RSM.

Optimal conditions for engine performance and emissions using RSM-GA.
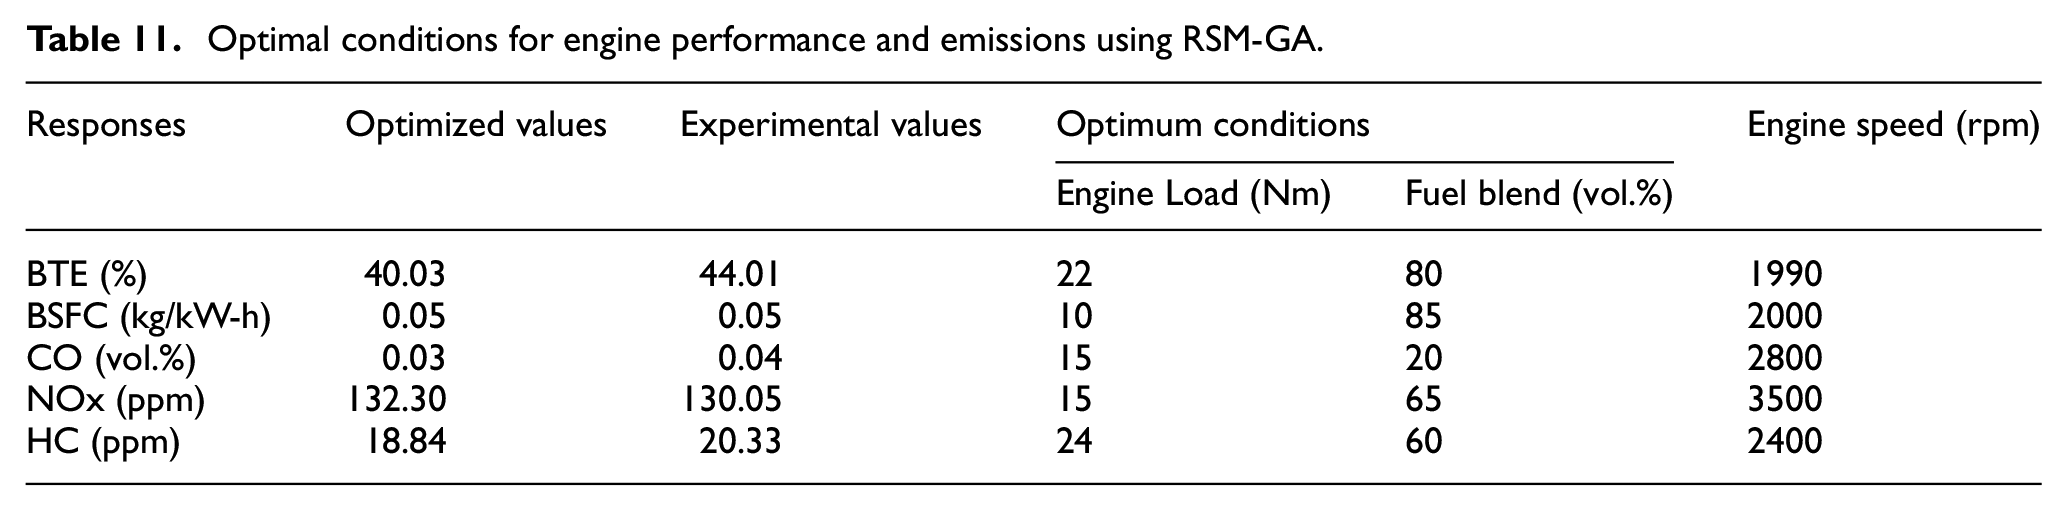
Table 12 contains the result of the maximum BTE and BSFC in comparison with the compression ratio. It could be observed that the higher the compression ratio the more improved engine performance than the result obtained previously in the literature using lower CR values.8,62,64,65 The result obtained in this study recorded the highest brake thermal efficiency. Therefore, high compression ratio engines are desirable because it allows an engine to extract more energy from a given mass of air/fuel mixture due to its higher thermal efficiency and equally allows the same temperature to be reached with less fuel while given a longer expansion cycle. 21
Compression ratio versus thermal efficiency and BSFC: this study compared with previous studies.
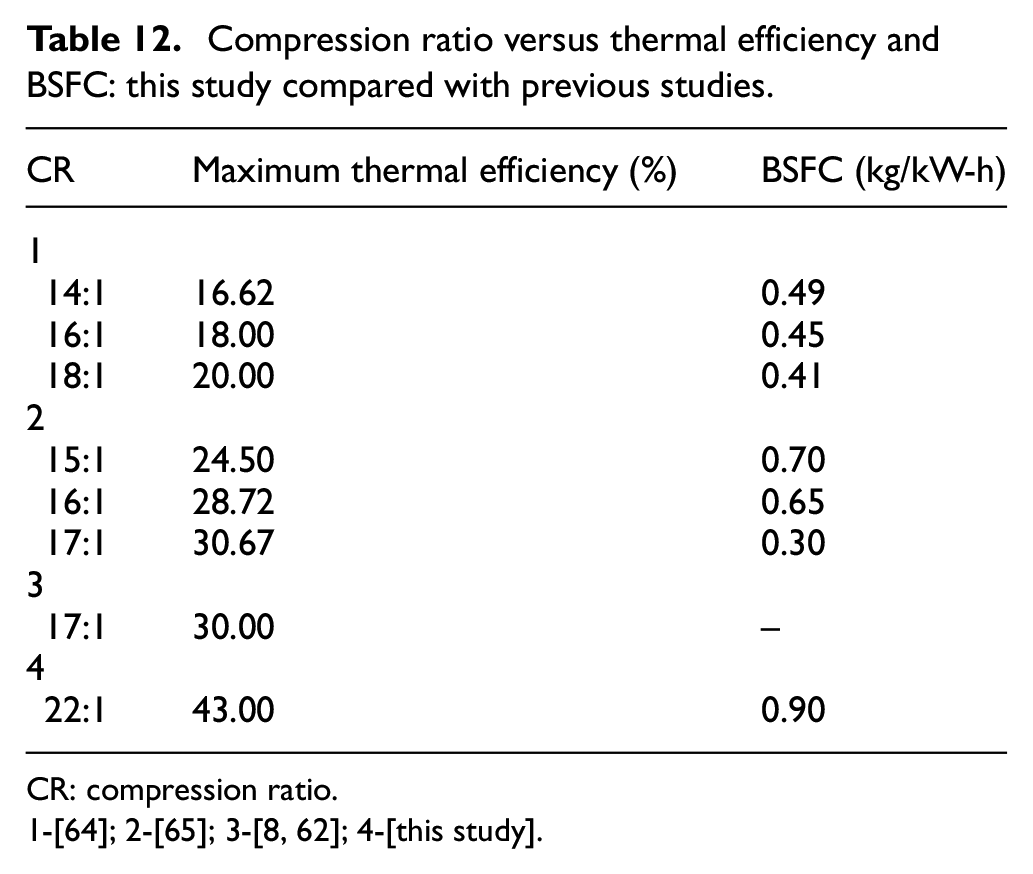
CR: compression ratio.
1-[64]; 2-[65]; 3-[8, 62]; 4-[this study].
Model appraisal statistics
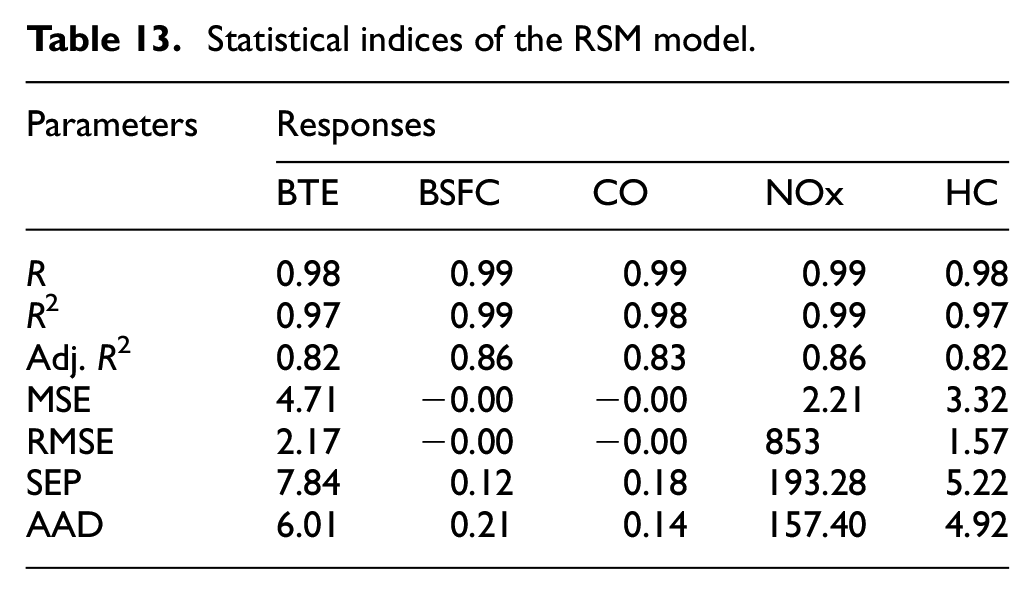
The RSM quadratic models for each response were appraised using different statistical indices and the results are presented in Table 13. The plots of the experimental versus predicted responses are shown in Figure 21(a) to (e). It was observed that they all had higher coefficient of correlation and low error values. This shows that RSM had excellent predictive capability on the modeling of all the responses. The RSM model results compared well with multi-input multi-output artificial neural network (MIMO ANN) and Nelder-Meads (NM) algorithm results previously reported when considering the insignificant differences in the values of the indices. 15
Statistical indices of the RSM model.

Comparison between experimental and predicted values of RSM models: (a)-BTE, (b)-BSFC, (c)-NOx, (d)-HC, and (e)-CO.
Conclusion
The engine performance experiments were carried out on a four cylinder diesel engine using biodiesel derived from the seed oil of D. edulis and its blends with diesel. The combustion characteristics of the biodiesel and blends with petro-diesel were evaluated and found to be comparable to that of petro-diesel with reduced emissions. Higher oxygen content and viscosity of Dyacrodes edulis seed oil methyl ester and its blends was responsible for their better engine performance and emission characteristics than petrodiesel. The emission of all the pollutants except NOx decreased with biodiesel used. The experimental results showed that B25 was most viable. The value of the percentage change of CO emission at 30 Nm was highest for B25 followed by B75 and least for B100. The percentage emission change of CO was more pronounced than other emissions at low biodiesel blends but was the same with CO2 and NOX at B100. The percentage change of NOX showed least values at 40 Nm and B25 blend (−7.89%). The result showed good correlation (R2 > 0.95) of results of experimental and predicted values while RSM-GA outperformed conventional RSM. Therefore, biodiesel performance and emission characteristics can be optimized using RSM-GA. Using Dyacrodes edulis seed biodiesel in the tropics will accelerate the development of the countries’ economy and protect the environment globally. Future works shall involve studies on the emissions of non regulated pollutants, variation of eat release rate with crank angle and the development of diesel engine combustion kinetics models of the Dyacrodes edulis seed oil biodiesel to compliment the results of this study.
Footnotes
Appendix
Acknowledgements
The authors would like to thank the staff and management of the National Centre for Energy Research and Development (NCERD), University of Nigeria Nsukka, National Research Institute for Chemical Technology (NARICT), Ahmmadu Bello University (ABU), Zaria, and PZ/NOTAP Chemical Engineering laboratory of Alex Ekwueme Federal University, Abakaliki, Nigeria for the availability of the laboratory facilities, apparatus, and analytical equipment.
Handling Editor: James Baldwin
Declaration of conflicting interests
The author(s) declared no potential conflicts of interest with respect to the research, authorship, and/or publication of this article.
Funding
The author(s) received no financial support for the research, authorship, and/or publication of this article.
Availability of supporting data
All available data are attached with the manuscript.