
Abstract
Tip clearance between the runner blade tip and shroud in a Kaplan turbine is inevitable, and the tip leakage flow (TLF) and tip leakage vortex (TLV) induced by the tip clearance have a considerable effect on the flow behaviors. To reveal the effect of the tip clearance on the flow characteristics, based on the Reynolds time-averaged Navier-Stokes (N-S) equation and the shear stress transfer (SST) k-ω turbulence model, the three-dimensional turbulence flow in a Kaplan turbine is simulated using ANSYS CFX. Meanwhile, the flow laws in the tip clearance are emphatically analyzed and summarized. Results show with the increase of the tip clearance, the negative pressure region in the blade suction side (SS) middle, the SS near the blade tip and the blade tip becomes more and more obvious. In the meantime, the flow behaviors on the blade pressure side (PS) are relatively stable, and the flow separation on the SS near blade tip merges. The larger the tip clearance is, the more obvious the flow separation phenomenon displays. In addition, the TLV is a spatial three-dimensional spiral structure formed by the entrainment effect of the TLF and main flow, and as the tip clearance increases, the TLV becomes more obvious.
Introduction
As a core component of the global energy structure, hydropower has become the third largest energy source after coal and natural gas. Meanwhile, hydropower resources in our country are abundant and the development potential is also huge. Hydropower plays an increasingly important role in the energy structure adjustment. In the dotted hydropower stations, hydraulic turbines are undoubtedly the core equipment. Among them, the Kaplan turbine has been widely used because of its large flow rate, easier maintenance, and high efficiency.1–3 As an important member of hydraulic machinery, it is mainly composed of rotating components (runner) and stationary components (spiral casing, stay vanes, draft tube, etc.). To avoid friction, tip clearance (Figure 1) between the runner blade tip and shroud is existed. 4 In the meantime, because of the pressure difference between the blade pressure side (PS) and the suction side (SS), the tip leakage flow (TLF) in the tip clearance generates, which evolves into a tip leakage vortex (TLV). The TLV has a greater impact on the internal flow behaviors in the Kaplan turbine. Certainly, the TLV phenomenon not only exists in hydraulic turbines, but also in other turbomachinery, such as pumps, compressors, and fans. Thus, this phenomenon is also attracted widespread attention.5–7

Tip clearance.
To reveal the TLF and TLV behaviors, numerous scholars investigated on this issue. In the aspect of theory research, Rains 8 considered that the TLF is a jet flow induced by a pressure difference, and established a leakage model. Similarly, Lakshminarayana 9 proposed a model which takes the leakage vortex core characteristics into account and accurately predicts the tip clearance loss. Chen et al. 10 established a simplified model of the tip clearance and deduced the two-dimensional trajectory coordinates of the TLV.
Except the theoretical research, as a result of the development of experiment and testing technology in recent years, high-speed photography technology, laser doppler velocimetry (LDV) and particle image velocimetry (PIV) are widely adopted for the TLF and TLV investigations. Laborde et al. 11 utilized high-speed photography to capture the cavitation flow in an axial flow pump with different tip clearances, and confirmed the cavitation initiation point. McCarter et al. 12 adopted a five-hole probe and LDV technology to measure the flow behaviors in the axial flow impeller and uncovered the passage vortex in the flow passage played a restrictive role in the spreading of the TLF. Wu et al. 13 employed the PIV technology to investigate the flow structure in the tip clearance of the axial water-jet pump. Results showed the TLF entrained in wall jet flow and then formed a TLV. Dreyer et al. 14 selected a NACA0009 hydrofoil as the research object and adopted stereo particle image velocimetry (SPIV) to measure the three-dimensional (3D) velocity field of the TLV. The effect of the flow conditions on the structure of the TLV was uncovered. Meanwhile, the vortex core trajectory and clearance flow alteration are demonstrated using the high-speed camera.
Compared with theoretical and experimental researches, numerical simulations are still in the majority. To facilitate the researches, the hydrofoil is employed to probe into the TLF and TLV at first. Based on large eddy simulation (LES) method, Xu et al. 15 and Cheng et al. 16 simulated and uncovered the tip-leakage cavitating flow characteristics around a NACA0009 hydrofoil. Results showed the evolution of the tip leakage cavitating flow was divided into three stages. Meanwhile, with the increase of tip clearance, the tip separation vortex (TSV) cavitation was decreased, however, TLV cavitation was increased first and then decreased. Similarly, Guo et al. 17 also adopt computational fluid dynamics (CFD) technology to investigate the effect of the clearance geometries on the flow field of a hydrofoil, and declared the sharp tip reduced the leakage flow losses and increased the velocity gradient. After in-depth investigation on the hydrofoil, the research on fluid machinery began. In the aspect of hydraulic turbines, on account of shear stress transfer (SST) k−ω turbulence model and the finite volume method (FVM), Kim et al. 18 probed into the effect of tip clearance on the flow characteristics in a Kaplan turbine using ANSYS CFX, and pointed out with the increase of tip clearance, the efficiency of the Kaplan turbine decreased. Based on the Zwart-Gerber-Belamri model cavitation model, Chen et al. 19 employed CFD method to unmask the effect of tip clearance on the cavitation flow in a Kaplan turbine. Through contrastive analysis, the cavitation bubbles increased when the runner blade tip clearance is considered. Likewise, Motycak et al. 20 also revealed the TLV cavitation in a Kaplan turbine, and further proposed suppression measures for cavitation. Liao et al. 21 applied the Reynolds stress differential model and unstructured mesh technology to thoroughly disclose the generation and development of the TFL in a Kaplan turbine, and the entrainment mechanism of the TLV and main flow. On the strength of the Reynolds stress model and Reynolds time-averaged Navier-Stokes (N-S) equation, Zhang et al. 22 numerically simulated the tip clearance flow in the axial flow turbine. Simulation results show the tip clearance flow has a greater impact on the turbine efficiency, and when the tip clearance exceeded than 1 mm, the effect of the tip clearance on the pressure on blade PS near the shroud is also larger. In terms of pumps, on account of the three-dimensional Reynolds time-averaged N-S equation and SST k−ω turbulence model, Wang et al. 23 investigated the TLV in a semi-open centrifugal pump using ANSYS CFX and the relative vorticity transport equation. Through the research, the TLV near the blade middle extended to the PS, which deteriorates the flow patterns and induced the passage vortex. Liu et al. 24 and Hao et al. 25 taken advantage of the CFD method to investigate the inner flow and radial force characteristics of a mixed flow pump with different tip clearances. As the tip clearance increases, the TLV strength is enhanced, and the asymmetric tip clearance induced asymmetric TLF. Base on SST k−ω turbulence model, Liu and Tan26,27 investigated the TLV in a mixed pump with different tip clearances, and proposed the evolution of the TLV was classified into three stages: splitting stage, developing stage and merging stage. Zhang et al.28,29 utilized numerical simulation methods to explore the TLV and its cavitation flow in an axial flow pump, and found with the increase of flow rate, the initial point of the TLV moved from the blade leading edge (LE) to the trailing edge (TE) along the blade profile. The TLV shear layer cavitation is related to the interaction between the TLF and main flow. Han and Tan 30 adopted dynamic mode decomposition (DMD) method to reveal the decomposition and reconstruction of TLV in a mixed flow pump as turbine at pump mode, and discovered the major vortex structures mainly consisted primary tip leakage vortex (PTLV) and secondary tip leakage vortex (STLV). In addition, other simulations on TLF and TLV are also carried out in fans,31,32 compressors, 33 pumps as turbines (PAT) 34 and other turbomachinery.
In short, numerous investigations on the TLF and TLV phenomenon are mainly focused on numerical simulations. Compared with other turbomachinery, this phenomenon in hydraulic turbines receives little attention, especially in the Kaplan turbine. Besides, because of the wear and cavitation, the tip clearance size also varies in turbine actual operation. Meanwhile, the inner flow mechanism is more complicated. Therefore, the TLF and TLV mechanisms in a turbine remain to further investigated.
On account of the analysis above, the numerical simulation in present work is employed to investigate the effect of tip clearance on the inner flow characteristics in a Kaplan turbine runner, and the TFL and TLV characteristics are emphatically analyzed. The findings not only provide a basis for the optimal design, performance improvement and structural analysis for hydraulic turbines, but also have a certain reference value for the investigation on TLF in other turbomachinery.
Geometry and computational mesh
Geometry
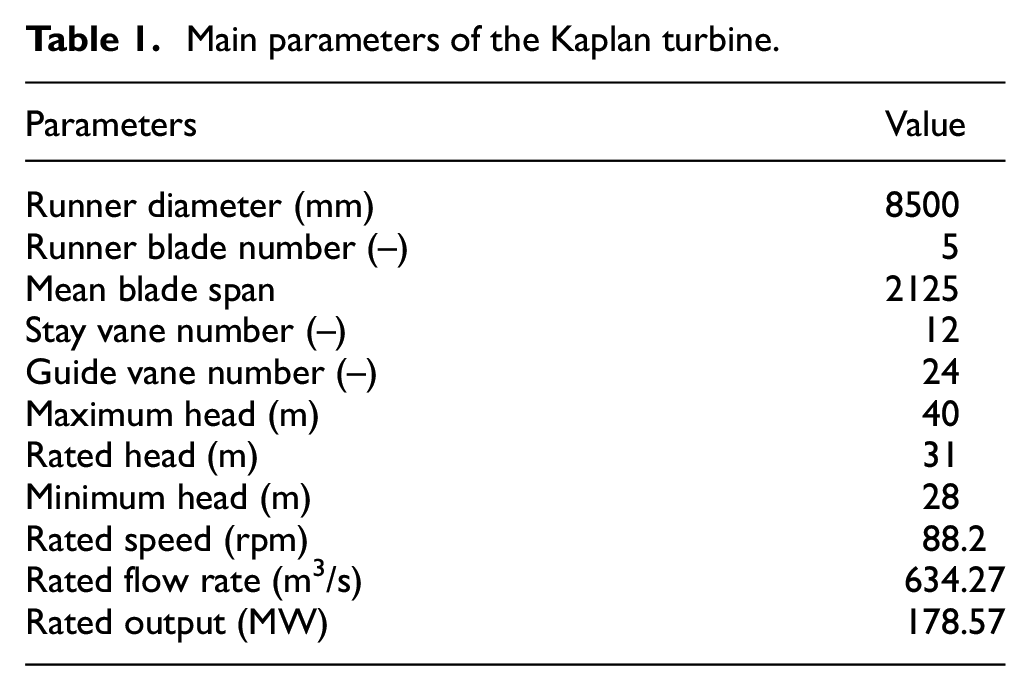
The research object in present work is the Kaplan turbine at the Tongjiezi hydropower station in Leshan City, China, which composes of five components: spiral casing, stay vanes, guide vanes, runner and draft tube. The three-dimensional geometry and main performance parameters are shown in Figure 2 and Table 1. Moreover, to investigate the effect of tip clearance on the flow characteristics in the Kaplan turbine runner, three different tip clearance sizes are designed, and the tip clearance sizes (Rtc) are 8.5, 46.5 and 85 mm, which are about 0.4%, 2% and 4% of blade span, respectively. Then, the tip clearance displays in Figure 3.

Three-dimensional model of the Kaplan turbine.
Main parameters of the Kaplan turbine.

Schematic of the tip clearance in a Kaplan turbine runner.
Mesh arrangement
Mesh generation is a key step in the pre-process of numerical simulation, and the mesh quality also plays an important role in the accuracy of the simulation results. The runner is the core component for energy conversion in the turbine. Meanwhile, the guide vanes and runner blades rotate mutually to remain a better combination relationship. Thus, the runner and guide vane are generated with hexahedral structure mesh using TurboGrid. To control the boundary layer near the blade, O-shaped topology is employed. At the same time, to accurately capture the flow details in the tip clearance, at least 30 layers meshes are arranged, as shown in Figure 4. In addition, ICEM-CFD is performed to generate unstructured meshes for other parts, such as spiral casing, stay vanes and draft tube, and the local large curvature region is refined.
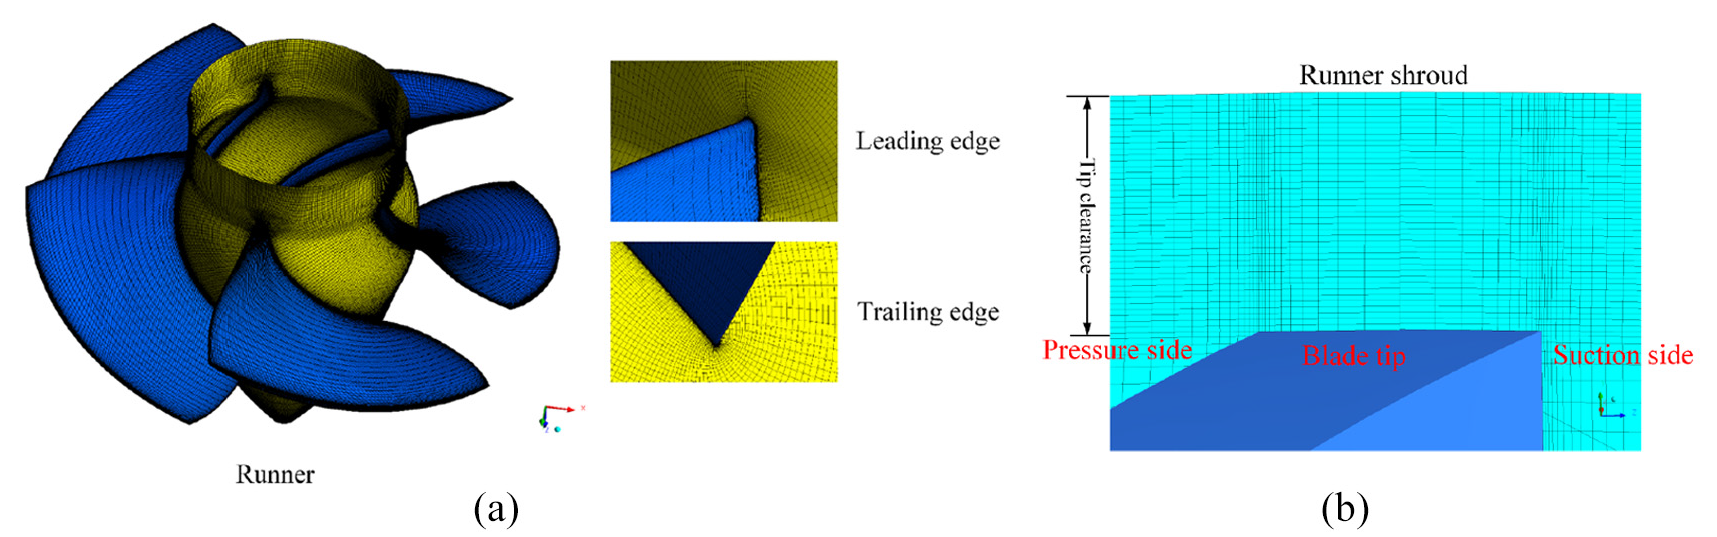
Computational mesh: (a) runner mesh and (b) tip clearance.
Mesh independence verification
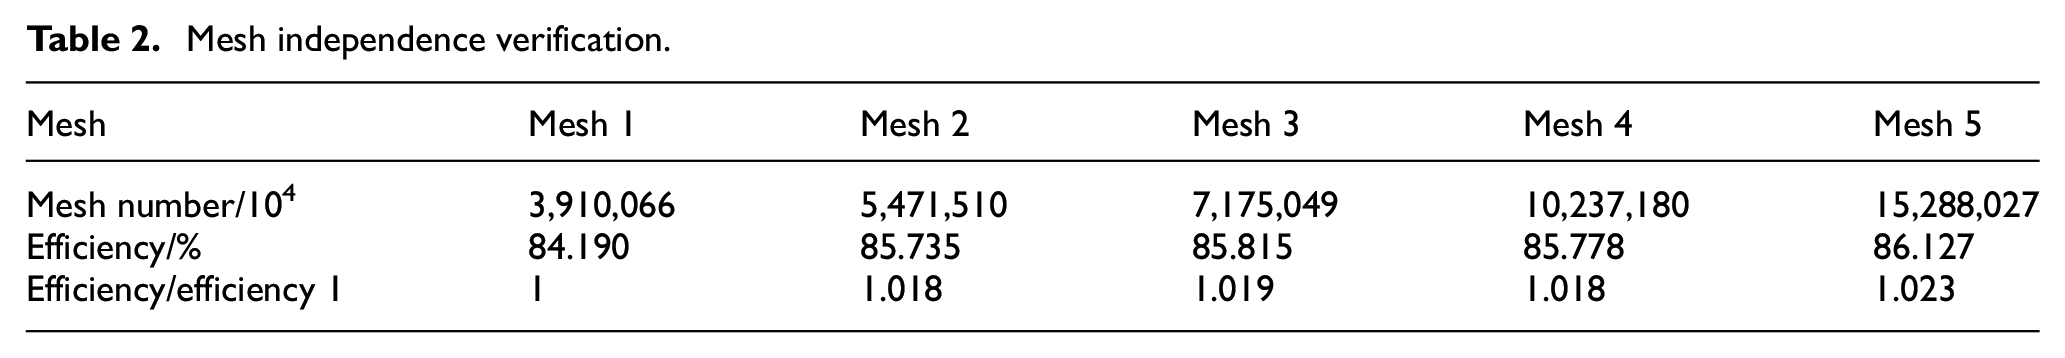
To reduce the effect of mesh density on the simulation results, five sets of computational meshes ranging from 3,910,066 to 15,288,027 are generated to verify the mesh independence. Table 2 displays the simulation results with different mesh numbers. From Table 2, when the mesh number exceeds 5.5 million, the maximum error of the simulation efficiency in the four sets of meshes does not exceed 0.5%, and the efficiency error between mesh 3 and mesh 4 does not exceed 0.05%, which indicates the result difference induced by the mesh number is ignored. Weighing the computational resources and cost, mesh 3 is adopted in present work.
Mesh independence verification.
Numerical methods and settings
Governing equations
Although the inner flow in the turbine is a complicated three-dimensional turbulent state, it also follows the basic governing equations. In simulations, the fluid is assumed as incompressible, and the temperature is constant without heat exchange, so the energy equation is ignored.35,36 The continuity equation and momentum equation are as follows:
The continuity equation:

The momentum equation:

where the ui and uj denotes velocity component, m/s; ρ denotes density, kg/m3; p denotes pressure, Pa; τij denotes shear stress, N/m2; Sij denotes additional source term, N/m3.
Turbulence model
SST k−ω turbulence model integrates the advantages of the k−ε and k−ω models, and preferably predicts the inverse pressure gradient flow. Meanwhile, it also has quite applicability to the simulation on the TLF and TLV in turbomachinery, which confirms in the previous investigations.37–39 Therefore, SST k−ω turbulence model employed in this paper meets the requirements for capturing the TLF and TLV characteristics, and the tensor expressions are as follows:


where i and j denote the tensor symbols; x denotes the variable; k denotes the turbulence kinetic energy, m2/s2; ω denotes the specific dissipation rate; ρ denotes the density, kg/m3; ui (i = 1, 2, 3) denote the velocity component, m/s; t denotes the time, s; Γ k and Γ ω denote the effective diffusion terms of the turbulence kinetic energy k and specific dissipation rate ω, respectively; Gk and Gω denote the generation items of the turbulence kinetic energy k and specific dissipation rate ω, respectively; Yk and Yω denote the divergent terms of the turbulence kinetic energy k and specific dissipation rate ω, respectively; Dω denotes the orthogonal divergence term; Sk and Sω denote user-defined terms.
Boundary conditions and settings
Based on the Reynolds time-averaged N-S equation and Finite Volume Method (FVM), the ANSYS CFX is employed to simulate the three-dimensional flow in a Kaplan turbine runner with different tip clearances. The inlet and outlet boundary conditions are set the total pressure and average static, respectively. In addition, the reference pressure, convergence residual wall boundary, and runner speed are set as 1 atm, 10−5, non-slip wall, and 88.2 rpm, respectively. The effect of gravity is also taken into account. In the simulations, the interface between rotational and stationary components is set to “Frozen Rotor,” and the interface between stationary components is set to “General Connection.” When the residual is lower than 10−5 or the flow rate at outlet is stable, the simulation is considered convergence.
Result and discussion
Effect of tip clearance on the pressure and velocity in the Kaplan turbine runner
Figure 5 shows the pressure on the runner blade surface with the different tip clearances. From Figure 5, the pressure from the runner inlet to outlet gradually decreases under different tip clearances, which is triggered by the working characteristics of the prime mover. In addition, with the increase of the tip clearance, the high-pressure region near the runner blade inlet hub gradually disappears. However, the low-pressure region near the runner inlet hub gradually increases, and the tip clearance has little impact on the pressure near the runner cone. Moreover, the pressure affected by tip clearance obviously is on the runner blade SS and blade tip.

Pressure on the runner surface.
To thoroughly uncover the effect of the tip clearance on the pressure on the blade surface and tip, Figures 6 and 7 display the pressure on the blade surface and tip, respectively. For Figure 6, with the increase of the tip clearance, the proportion of the high-pressure region near the leading edge (LE) at the blade tip gradually increases. When the Rtc = 8.5 mm, compared with SS, a lower pressure region emerges on PS near the blade tip, which is caused by the TLV. With the further increase of the tip clearance, the negative pressure region near the blade tip is more obvious. Meanwhile, comprehensively analyzed Figures 5 and 7, the TLF flows from the PS to SS through the tip clearance, and a negative pressure region is formed near the SS at the blade tip. The larger the tip clearance is, the greater the negative pressure region exists. The negative pressure region on the blade SS middle is also obvious. In addition, as the tip clearance increases, the high-pressure region at the blade SS inlet near the tip gradually decreases. However, the pressure gradient on the blade PS from the blade inlet to the outlet varies uniformly. In the meantime, as the tip clearance increases, the high-pressure proportion at the blade inlet decreases, and the negative pressure region near the blade tip is also gradually reduced.

Pressure at blade tip.

Pressure on runner blade surface.
Figure 8 demonstrates the streamlines on the runner blade surface. In Figure 8, the streamlines on the PS from the blade inlet to outlet is relatively smooth, and the vortexes barely generate. Therefore, the tip clearance variation has little effect on the streamlines on PS. However, velocity on the blade SS near the blade tip is evidently larger, and as the tip clearance increases, flow separation occurs in the blade tip. The larger the tip clearance is, the more obvious the flow separation phenomenon emerges. In addition, compared with the streamlines on the blade PS and SS, the velocity near the runner shroud is larger than that near the hub.

Streamlines on runner blade surface: (a) pressure side and (b) suction side.
To facilitate the analysis of the pressure characteristics in the runner, three sections near the runner blade inlet, middle and outlet are designed and named section 1, 2 and 3 in turn, as shown in Figure 9. Figure 10(a) to (c) are the pressure on section 1, 2 and 3, respectively.

Schematic of runner sections.

Pressure in the runner axial sections: (a) section 1, (b) section 2 and (c) section 3.
From Figure 10(a), under different tip clearances, the pressure near the runner hub and shroud at the section 1 is lower. However, the pressure near the middle of the flow passage is higher, and the high-pressure region is symmetrically distributed along the circumference direction. With the increase of the tip clearance, the low-pressure regions near the runner hub and shroud become more obvious, and the proportion of high-pressure region in the middle of the flow passage gradually decreases. Thus, the tip clearance has various degree influence on the pressure in the blade inlet section.
For Figure 10(b), in the section 2, the pressure in the tip clearance is greatly affected by the tip clearance size. Except for the tip clearance, the effect of tip clearance on pressure in other locations is less. On account of the TLV, a more obvious negative pressure region in the tip clearance is appeared near the blade SS. As the tip clearance increases, the tip leakage gradually increases, and the range of the negative pressure region is gradually increased. Meanwhile, the larger the tip clearance is, the stronger the TLF and TLV are, which have a greater impact on the Kaplan turbine performance. Therefore, the clearance is reasonably selected during the design of the Kaplan turbine to maintain the high efficient and strong stability in operation.
In Figure 10(c), in the section 3, the pressure near the TE is higher. However, the pressure in the flow passage is lower. The high-pressure region and low-pressure region are alternately distributed. As the tip clearance increases, the pressure in the high-pressure region decreases slightly. Meanwhile, the negative pressure in the low-pressure region is more obvious, and the low-pressure region range gradually extends from the runner shroud to hub.
On the whole, the variation of the tip clearance has an effect on the pressure in the runner axial sections. In terms of the range of influence, the tip clearance has an effect in entire sections 1 and 3. However, in section 2, the location evidently affects by tip clearance is merely in the tip clearance. Therefore, the effect mechanism of the tip clearance on the pressure in the Kaplan turbine runner is more complicated.
Effect of tip clearance on runner blade load and velocities at runner inlet and outlet
Figure 11 shows the runner blade loads at different spans under different tip clearances. Three representative spans, namely 0.1, 0.5, and 0.9 spans, are employed to represent the runner hub, and the radial middle of the blade and blade tip, respectively. Meanwhile, the distance from the blade inlet to outlet along the streamwise is normalized and named the streamwise coefficient. The blade inlet is 0, and the blade outlet is 1.

Runner blade load with different tip clearances.
From Figure 11, at 0.1 span, the pressure on blade PS gradually decreases with the increase of the tip clearance, which is more obvious from the blade inlet to the streamwise coefficient of 0.5. After the streamwise coefficient of 0.5, the effect of the tip clearance is weakened. Meanwhile, on the blade SS, the pressure variation trend is similar to that on the blade PS. The difference is that except for the blade inlet, the negative pressure is appeared at other locations of the blade. The pressure difference between the PS and SS is the blade load. The blade load along the streamwise under different tip clearances varies, yet, the blade load is displayed as stationary curves without obvious fluctuations. At 0.5 span, the effect of tip clearance on the pressure on the blade PS and SS is not as obvious as that at 0.1 span. Of course, blade load is rarely changed. At 0.9 span, the effects of tip clearance on PS pressure and SS pressure are both great. On blade PS, the pressure greatly affected by the tip clearance is from the blade inlet to the streamwise coefficient of 0.6. With the increase of the tip clearance, the pressure gradually declines. However, from the streamwise coefficient of 0.6 to the blade outlet, the pressure is basically unchanged with the increase of the tip clearance. On the blade SS, the effect of the tip clearance on the pressure from the blade inlet to the streamwise coefficient of 0.5 and from the streamwise coefficient of 0.5 to the blade outlet shows diametrically opposite trends. That is, the pressure augments from the blade inlet to the streamwise coefficient of 0.5with the increase of the tip clearance, and it gradually decreases from the streamwise coefficient of 0.5 to the blade outlet with the increase of the blade tip clearance. In addition, the tip clearance variation give rise to the blade load fluctuates sharply, especially from the streamwise coefficient of 0.5–0.8. At the meantime, the fluctuation of the blade load curves also indicates that the power capability is unstable and the hydraulic efficiency is low.
In short, the blade load greatly affected by tip clearance is near the blade tip region, and the one rarely affected by tip clearance is in 0.5 span. Meanwhile, the effect of tip clearance on blade load also provides guidance for the tip clearance optimization.
Figures 12 and 13 display the axial and radial velocities along the spanwise direction at the runner inlet and outlet with different tip clearances. The distance from the runner hub to the shroud in the radial direction is normalized and named the span coefficient, namely, the span coefficient at hub is 0, the span coefficient at shroud is 1. In Figure 12, at the runner inlet, the axial velocity under different tip clearances gradually decreases from the runner hub, and then gradually increases from the span coefficient of 0.1–0.9, and finally drops sharply from the span coefficient of 0.9 to runner shroud. Except tip clearance has little effect on axial velocity at runner hub and shroud, the axial velocity from the span coefficient of 0.1–0.9 gradually increases with the increase of the tip clearance. Under different tip clearances, the radial velocity from the runner hub to shroud firstly decreases. After reaching the minimum value near the span coefficient of 0.8, it gradually increases to the same velocity at the runner hub, and the radial velocity along the spanwise is in a “V” shape. In the meantime, the effect of tip clearance on radial velocity is most obvious near the span coefficient of 0.8.
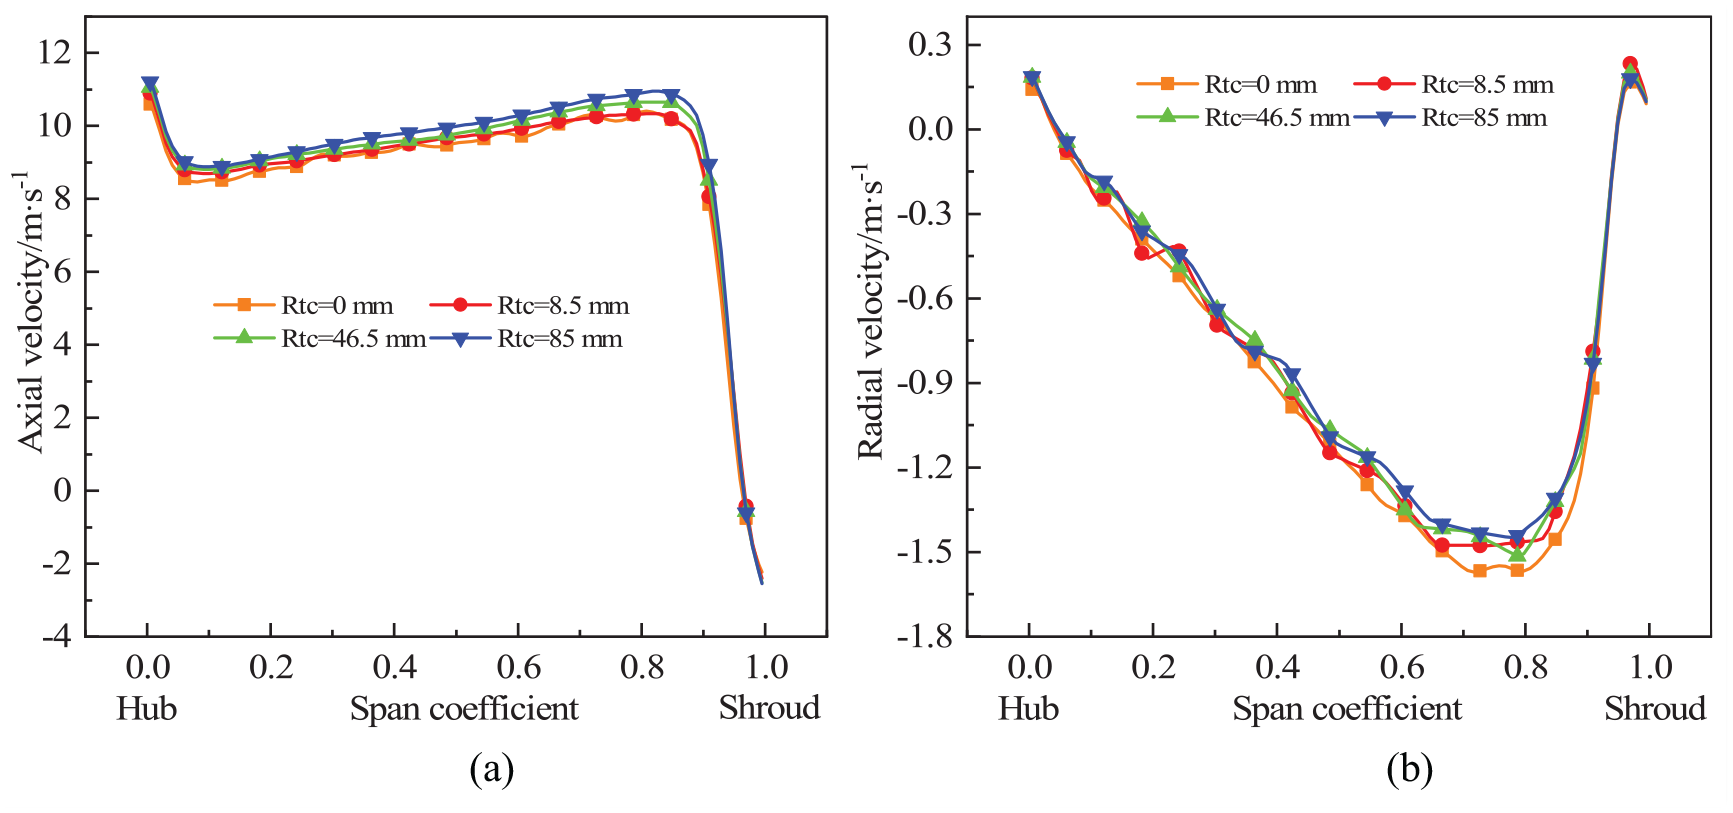
Velocity at runner inlet: (a) axial velocity and (b) radial velocity.

Velocity at runner outlet: (a) axial velocity and (b) radial velocity.
For Figure 13, the axial velocity at the runner outlet is obviously different from that at the runner inlet. That is, the axial velocity gradually increases from the runner hub, then begins to decrease near the span coefficient of 0.2. Afterwards, the axial velocity begins to have a small increase near the span coefficient of 0.6 and to decrease until the span coefficient of 0.9. Finally, from the span coefficient of 0.9 to runner shroud, the axial velocity presents different trends according to different tip clearances. Apparently, the axial velocity greatly affected by the tip clearance is from the span coefficient of 0.5 to the runner shroud. The radial velocity is different from that at the runner inlet. That is, the radial velocity starts to decrease sharply from the runner hub. After reaching the minimum value of −2 m/s, it gradually increases until the span coefficient of 0.9. From the span coefficient of 0.9 to runner shroud, the radial velocity has different trends depending on the tip clearance. In the meantime, except for the runner hub and shroud, the radial velocity gradually increases with the increase of the tip clearance, and the radial velocity range is from −2 m/s to 1.5 m/s.
TLV characteristics with different tip clearances
Figure 14 demonstrations the tip leakage vortex in the runner with different tip clearances, and the TLV core is identified by the Q criterion. From Figure 14, due to the pressure difference between the runner blade PS and SS, the fluid from the high-pressure side flows into the blade SS in the jet flow through the tip clearance, and entrains with the incoming flow. Then, it forms a TLV with a spatial three-dimensional spiral structure. With the increase of the tip clearance, the tip leakage increases, the entrainment between the main flow and the leakage flow becomes stronger, and the TLV also becomes more obvious. In addition, the effect of tip clearance on TLV and TLF velocities is larger. When Rtc = 8.5 mm, the TLF velocity is higher as the TLF enters the tip clearance. However, it is relatively lower during the leakage and entrainment processes, and when the TLV moves downstream, the velocity increases. When Rtc = 46.5 mm, the biggest difference with Rtc = 8.5 mm is that the TLF and TLV velocities are higher. When the tip clearance further increases to 85 mm, the TLF velocity is relatively lower than that with Rtc = 46.5 mm case, and the high velocity region is mainly concentrated near the TLV.

TLV characteristic: (a) global view and (b) enlarged view.
The swirling strength is a physical quantity that symbolizes the strength and distribution area of the vortex in the flow field. Figure 15 illustrations the swirling strength in the runner axial section. For Figure 15, under different tip clearances, the velocity swirling strengths near the runner hub, the blade surface and the runner shroud are greater due to the effect of the wall boundary layer. In the meantime, the velocity swirling strength near the runner shroud in tip clearance case is stronger than that without tip clearance. In addition, the velocity swirling strength near the TLV is greater, and the lower velocity swirling strength mainly exists near the runner inlet hub and blade TE.
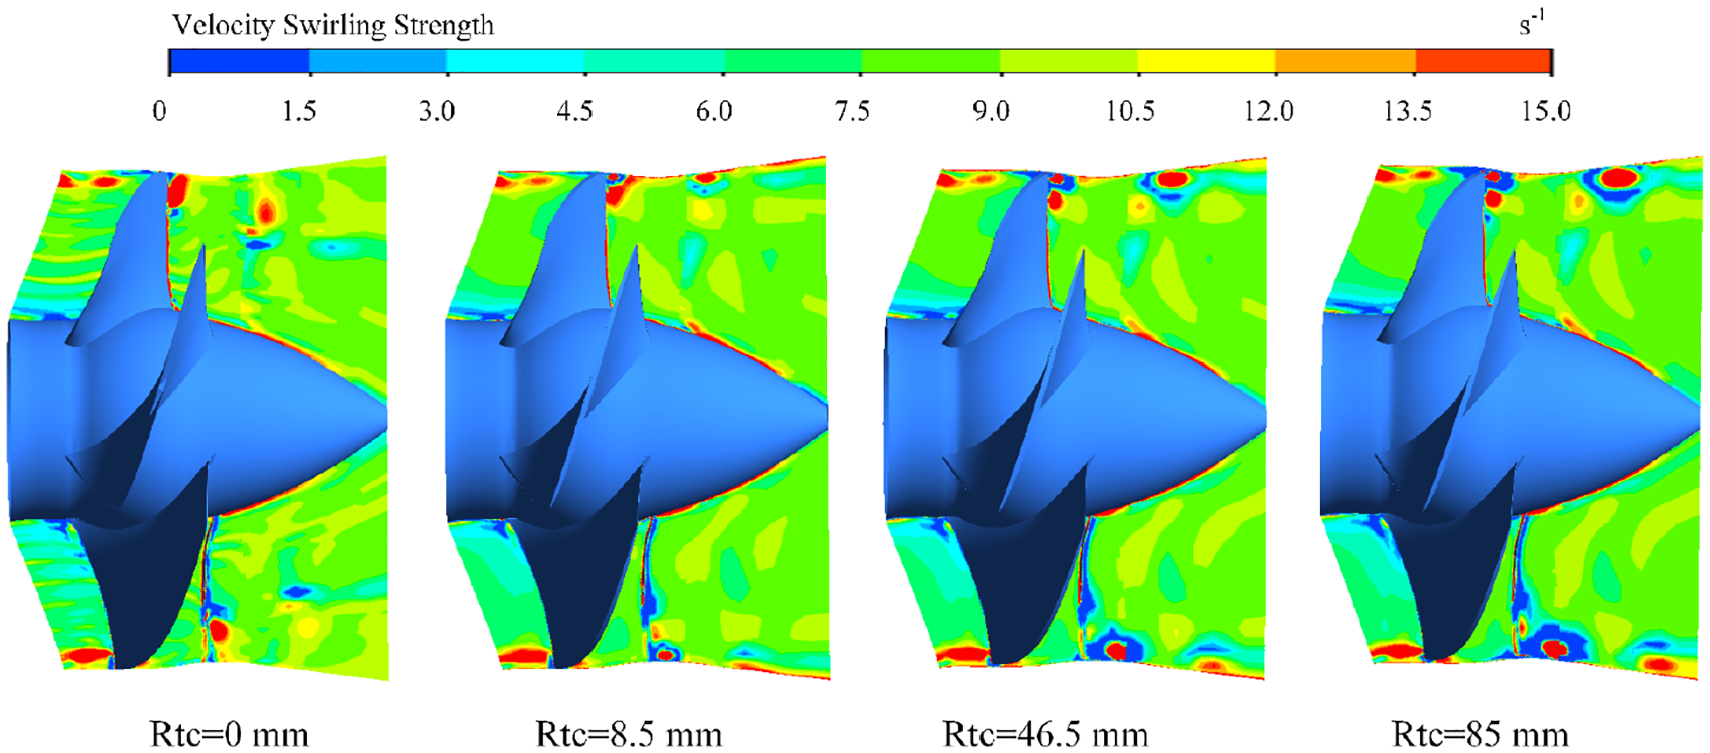
Velocity swirling strength in the runner axial section.
To investigate the pressure characteristics near the TLV, five axial sections are set from the blade LE to TE, and the pressure on each section is displayed, as shown in Figure 16. From Figure 16, because of the entrainment effect, a low-pressure region appears near the TLV core, thus, the low-pressure region also describes the TLV trajectory. When Rtc = 8.5 mm, the TLV has little effect on the downstream fluid pressure. However, when Rtc = 46.5 and 85 mm, the TLV has a greater effect on the downstream fluid pressure. Furthermore, with the increase of the tip clearance, the TLV initial point gradually moves to the TE along the blade profile.
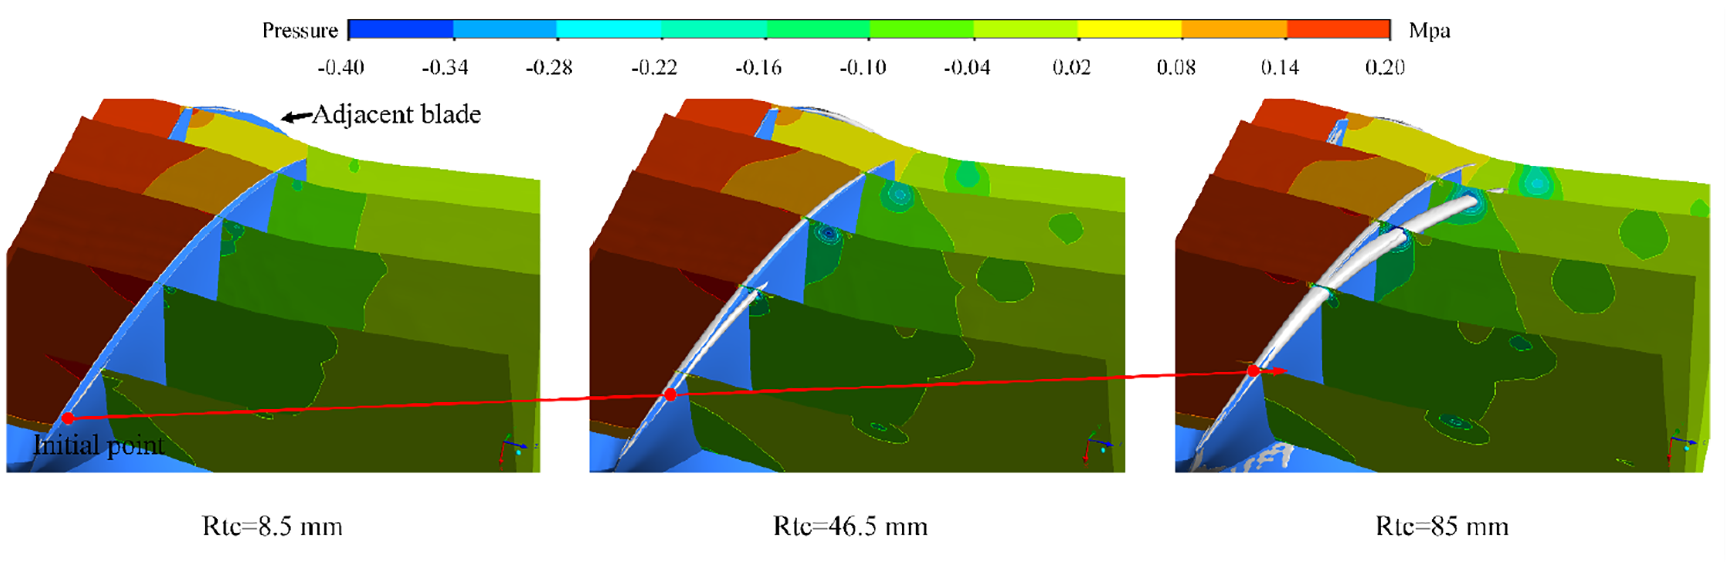
Pressure in runner axial sections.
Figure 17 presents the swirling strength near the runner shroud with different tip clearances. For Figure 17, with no tip clearance case, the larger velocity swirling strength near runner shroud is at the runner inlet and the blade SS. With the tip clearance cases, the velocity swirling strength at the runner inlet gradually increases with the increase of the tip clearance. In the meantime, the velocity swirling strength near the TLV on the blade SS also increases. Moreover, the leakage separation angle (the angle between the TLV and the blade profile) gradually increases with the increase of the tip clearance.

Velocity swirling strength near the runner shroud.
Figure 18 displays the turbulent kinetic energy at 0.9 span of the runner. In Figure 18, the tip clearance has a greater influence on the turbulent kinetic energy near the blade tip. As the tip clearance increases, the turbulent kinetic energy at the runner inlet gradually decreases. Simultaneously, the turbulent kinetic energy near the TLV on the blade SS gradually increases, which is a large energy loss induced by the TLV. Moreover, the larger turbulent kinetic energy location corresponds to the maximum velocity swirling strength in Figure 17, which also demonstrates the energy loss here is induced by the TLV.

Turbulent kinetic energy near runner blade tip.
The TLF in the tip clearance is a necessary condition for the TLV formation, and the TLV is the inevitable result of the TLF development. To thoroughly analyze the TFL and TLV characteristics near the blade tip, an axial section is set in the runner, as shown in Figure 19.
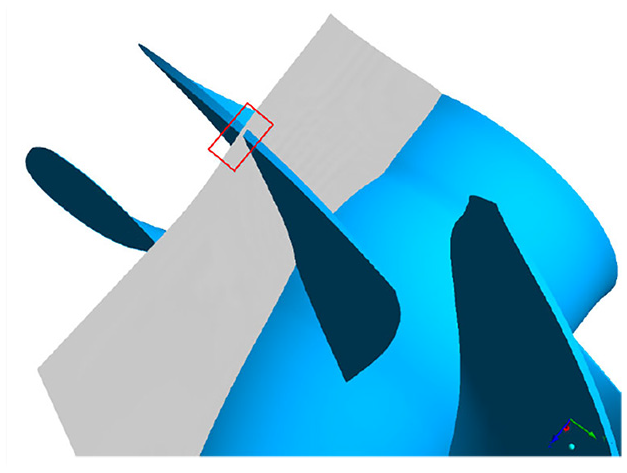
Axial section near blade tip.
Figure 20 presents the correlation characteristic between the pressure and velocity vector in the axial section. For Figure 20, under the effect of the pressure difference between the blade PS and SS, the TLF flows to the SS through the tip clearance, and a negative pressure region is formed near the tip when the TLF enters the tip clearance. As the tip clearance increases, the negative pressure region gradually expands. The TLF enters the flow passage near PS side, then, it entrains and mixes with the main flow to form a TLV. As the tip clearance increases, the TLV becomes more and more obvious. Simultaneously, a low-pressure region is formed near the TLV core, and the low-pressure region also increases with the increase of the tip clearance.

Pressure and velocity vector near blade tip.
Figure 21 displays the meridional velocity near the blade tip. For Figure 21, the meridional velocity near the blade tip is small. However, it near the runner shroud is larger. As the tip clearance increases, the area of the low velocity near the blade tip and high velocity region near the runner shroud gradually expands. At the same time, when the TLF enters the blade PS side, a low-velocity region is formed in the process of entrainment and mixing with the main flow. The range of the low-velocity region gradually decreases with the increase of the tip clearance.
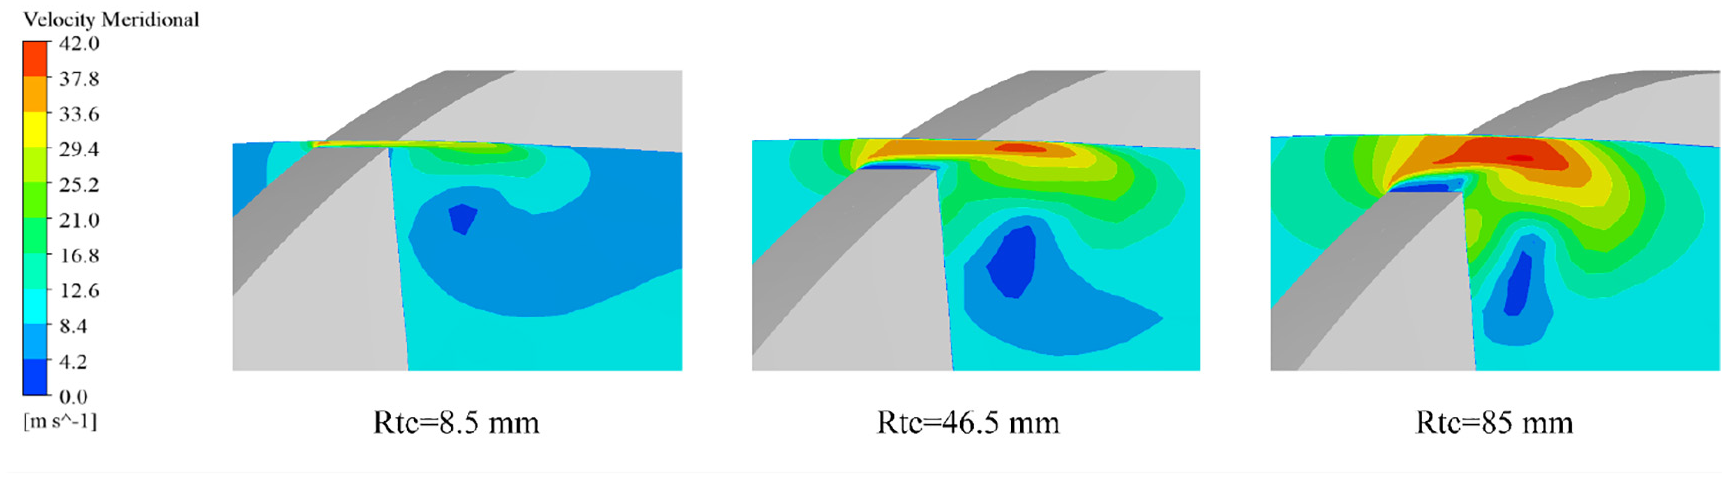
Meridional velocity near the blade tip.
Conclusions
The effect of tip clearance on the flow characteristics in Kaplan turbine runner in this paper is systematically investigated, and the TLF and TLV characteristics with different tip clearances are emphatically analyzed. Then, the following conclusions are obtained:
The pressure affected by tip clearance obviously is on the runner blade SS and blade tip. With the increase of the tip clearance, the negative pressure regions on the blade SS middle, SS near the blade tip, and blade tip are also obvious. In addition, the streamlines on the PS are relatively smooth. However, flow separation occurs in the blade tip. The larger the tip clearance is, the more obvious the flow separation phenomenon emerges.
Compared with other spans, the blade load affected by tip clearance fluctuates sharply at 0.9 span, especially from the streamwise coefficient of 0.5–0.8, which greatly affects the power capability of the Kaplan turbine. In addition, the effect of the tip clearance on the axial and radial velocities at the runner outlet is greater than that at the runner inlet, and the axial and radial velocities obviously affected by tip clearance are both from the span coefficient of 0.5 to the runner shroud. Moreover, the radial velocity range at the runner outlet along the spanwise as twice as that at the runner inlet. However, the axial velocity at the runner inlet and outlet along the spanwise has no significant difference.
The TLF induced by the pressure difference between the blade PS and SS flows through the tip clearance, mixes with near the main flow near the blade SS and forms into the TLV with the spatial three-dimensional spiral structure. Simultaneously, a negative pressure region is generated near the TLV, which causes a large energy loss. With the increase of the tip clearance, the TLV becomes more obvious, the TLV initial point moves to the TE along the blade profile, and the leakage separation angle also gradually increases.
Footnotes
Handling Editor: James Baldwin
Declaration of conflicting interests
The author(s) declared no potential conflicts of interest with respect to the research, authorship, and/or publication of this article.
Funding
The author(s) disclosed receipt of the following financial support for the research, authorship, and/or publication of this article: This research was supported by the National Key Research and Development Program (Grant No: 2018YFB0905200).