
Abstract
The clearance exists inevitably between the turbine guide vanes and the fixed wall, and the resulting tip leakage vortex leads to the increase of hydraulic loss. Based on the fluid simulation software ANSYS CFX, the hydrofoil was numerically simulated under different flow velocity conditions. The trajectory and energy dissipation of the tip leakage vortex are discussed. The results show that the jet entrainment with the main flow to form the tip leakage vortex, which is mainly divided into main leakage vortex and separation vortex. The flow evolution of tip leakage vortex can be divided into three stages. The evolution of tip leakage vortex can be divided into three stages: independent development of main leakage vortex and separation vortex, fusion stage, and dissipation of main leakage vortex. The strongest turbulent kinetic energy dissipation occurs in the clearance, which confirms that the clearance causes non-negligible energy dissipation for hydraulic machinery. The results provide guidance for tip leakage vortex control of hydraulic hydrofoil.
Introduction
With the strong development of the world economy, renewable energy is the main direction of energy transformation in the world today. There is a clearance between the guide vanes and the fixed wall surface, and there is a pressure difference between the guide vanes pressure surface and the suction surface, so the clearance leakage flow is generated. The clearance leakage flow and the main stream entrainment form a complex tip leakage vortex structure, which increases flow loss, induces cavitation and noise, and results in the hydraulic performance of the unit decline. Therefore, it is particularly important to deeply analyze the structure of tip leakage vortex and understand its flow law.
Many scholars have conducted relevant experimental studies on clearance leakage flow, such as the influence of hydrofoil geometry, clearance width, and attack angle on clearance leakage flow.1–3 The results show that the width of the clearance affects the vortex core pressure of the tip leakage vortex, and then affects the cavitation performance. Moreover, the study of the clearance of the inner tip of the mixed transport pump by the Shi team4–6 found that the clearance size significantly affected the internal flow field of the pump, and then affected its external characteristics. Zhang et al. 7 , Liao et al. 8 , and Zhao et al. 9 conducted visual tests on cavitation in the tip clearance of axial flow pumps, revealing the process of flow channel blockage caused by cavitation vortices. Miorini et al. 10 conducted a systematic test on the tip leakage vortex structure of axial flow hydraulic rotating machinery, revealing the generation, and evolution process of the internal clearance vortex structure in detail. Dreyer et al. 11 and Liu and Tan12,13 measured the downstream flow field characteristics of NACA0009 hydrofoil by using three-dimensional particle image velocity measurement technology, and found that the strength of the tip leakage vortex affected the axial velocity of the vortex core, and as the clearance width increased, the tip leakage vortex gradually moved away from the suction surface of the hydrofoil. Simanto et al. 14 investigated the emergence and development of vortex cavitation around the tip of an elliptical foil and the distortion of the cavitation shape under different flow field conditions using laser Doppler velocimetry (LDV) measurements and high-speed image processing analysis. Wang and Devenport 15 and Li et al. 16 conducted an experimental analysis of compressor blade cover and found that the movement of the side wall had no significant difference in the flow characteristics of the clearance leakage flow compared with the static condition. With the rapid development of CFD technology, the numerical simulation of clearance flow field has reached a high precision. Cheng et al. 17 , Xu et al. 18 , and Chen et al. 19 analyzed the clearance flow field under cavitation and non-cavitation conditions and found that compared with the condition without cavitation, the occurrence of cavitation would expand the scope of the main leakage vortex and tip separation vortex, but would weaken the vortex intensity. At the same time, cavitation enhances the strength of interstitial jets, resulting in more turbulent kinetic energy dissipation. Wang et al. 20 and Cheng et al.21,22 conducted a study on how the TLV’s development impacts the TLVC inception and cavitation’s effect on TLV’s evolutionary behavior and characteristic parameter, indicating that TLV’s cavitation development greatly influences its vorticity and turbulent kinetic energy distributions. Shen et al. 23 , Li et al. 24 , and Zhu et al. 25 revealed the flow characteristics under different tip clearances. There are also some scholars who focus on modifying hydrofoil to suppress tip leakage vortex, such as following corners, 26 adding baffle strips, 27 and adding rough bands.28,29 It is found that these methods are beneficial to restrain clearance leakage vorticity, reduce hydrofoil drag coefficient and improve cavitation performance.
Based on the above literature, it can be seen that few literatures have reported the influence of velocity on the flow characteristics of hydrofoil tip leakage vortex. In view of this, this paper adopts numerical method to study the flow characteristics of the hydrofoil tip leakage vortex by changing the inlet velocity, and discusses the movement trajectory and energy dissipation law of the tip leakage vortex. The research results can provide guidance for the tip leakage vortex control of rotary hydraulic machinery.
Mathematic model
Governing equation
The fundamental governing equation is an important theoretical basis for the study of hydrodynamic phenomena. 30 It describes the conservation laws of momentum, mass, and energy in fluids. 31
Equation of continuity
Fluid is regarded as a continuous object, so the rate of change of fluid mass can be analyzed according to its density and velocity, thus obtaining the differential expression of the continuity equation as follows:

Momentum conservation equation
Momentum conservation comes from Newton’s second law, which states that the force acting on physics at a certain time is equal to the rate of change of the momentum of the object, and the differential expression of the momentum equation is as follows:


Where P is the pressure, x is the coordinate, and the subscripts i, j, and k are the tensor coordinates.
Turbulence model
The SST k-ω model combines the advantages of the k-ω model for the calculation of far-field turbulence and the model for the treatment of the near-wall region. 32 It can simulate the transition process from laminar flow to turbulent flow well, and is suitable for the flow with flow separation, jet, and large curvature. Compared with the k-ε turbulence model, the RNG k-ε model, and the k-ω turbulence model, the SST k-ω turbulence model is able to predict the unfavorable pressure gradient flow better and capture the flow state accurately.33,34 The expression of turbulent kinetic energy k and turbulent pulsation frequency ω of SST k-ω model is as follows:


Where, t is the time, x is the coordinate, ρ is the fluid density, u is the fluid velocity, Gk is the turbulent kinetic energy k-generation term, Gω is the ω-generation term, Г
k
is the effective diffusion phase for k, Гω is the effective diffusion phase for ω, where: Г
k
= μ + μ
t
/σ
k
, Гω = μ + μ
t
/σω. Yk is the evanescent phase of k, Yω is the evanescent phase of ω, Dω is the orthogonal evanescent phase, Sk and Sω are user-defined, μ
t
is the coefficient of turbulent eddy dynamic viscosity, σ
k
is the turbulent Prandtl number of k, and σω is the turbulent Prandtl number of ω, σ
k
= [0.85 F1 + (1−F1)]−1, σω = [0.5 F1 + 0.856(1−F1)]−1, F1 is the value of the wall function, Gk = μtS2,
Numerical computation method
Geometrical model
In this study, the guide vane shape of a pumped storage power station is selected as the research object. The chord length l of the model hydrofoil is 32.7 mm, the maximum thickness h of the hydrofoil is 5.5 mm, and the clearance width δ is 0.3 mm. The calculation domain of the three-dimensional hydrofoil is a cuboid of 210 mm × 33 mm × 45 mm, and the placement angle of the hydrofoil α is 10°, as shown in Figure 1.
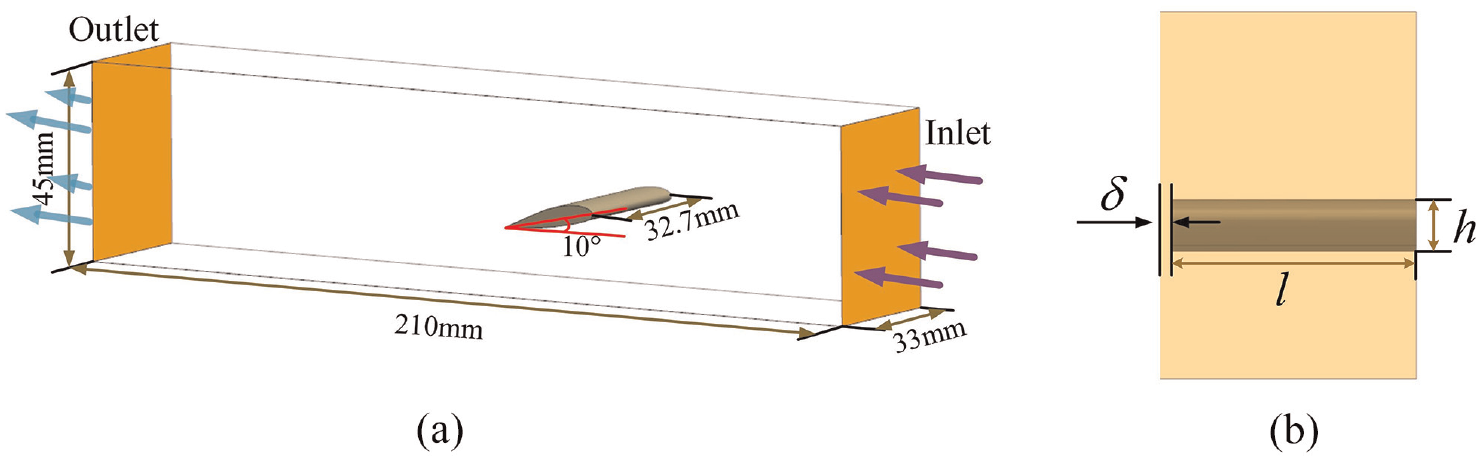
Hydrofoil calculation domain model: (a) computational domain model and (b) guide vane end clearance.
Mesh generation
In this paper, structural grid is used to divide the computing domain. In order to improve the calculation accuracy near the hydrofoil, O-topology was applied to the mesh near the hydrofoil, and the mesh near the clearance was locally encrypted. Seven layers of boundary layer mesh with thickness of 0.001 mm were added to the surface of the hydrofoil. The mesh model is shown in the Figure 2.

Mesh model and local enlarged view of hydrofoil calculation domain: (a) computational domain mesh and (b) local mesh enlargement diagram.
At the same time, in order to reduce the influence of the number of mesh on the calculation results, five groups of mesh, including 3.02, 4.0, 5.32, 7.26, and 9.11 million, were divided respectively, and the pressure difference on the front and back edges of the hydrofoil was selected as the monitoring parameter to complete the independence verification of the hydrofoil mesh, as shown in the Figure 3. When the number of mesh reaches 7.26 million, the pressure difference is stable in the region, indicating that the influence of the number of mesh on the calculation results is small and can be ignored. Therefore, this paper uses a grid of 7.26 million for subsequent calculation.

Mesh independence verification.
Y plus represents the distance from the first grid cell to the surface wall, and its boundary layer thickness helps improve the accuracy and efficiency of fluid simulation calculations. Through the preliminary calculation of 7.26 million mesh, the Y plus value of the near-wall mesh of the hydrofoil ranges from 1 to 15, as shown in the Figure 4.
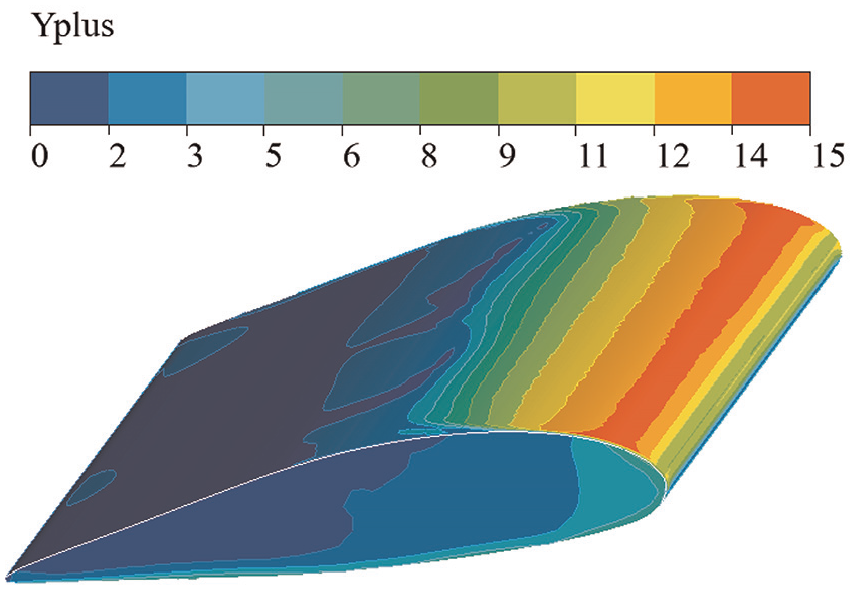
Mesh Y plus distribution on the hydrofoil surface.
Boundary conditions
In this paper, SST k-ω turbulence model is used to calculate the fluid domain of hydrofoil. The inlet of the calculation domain are set as velocity inlet with calculated velocities of 6, 8, and 10 m/s for three conditions, and the outlet is a pressure outlet set at 1 atm. And no slip condition is set for the hydrofoil surface and wall. Iterative calculation of algebraic equations adopts mean-square error residual and sets the convergence accuracy to 10−5.
Results and discussion
Movement path of tip leakage vortex
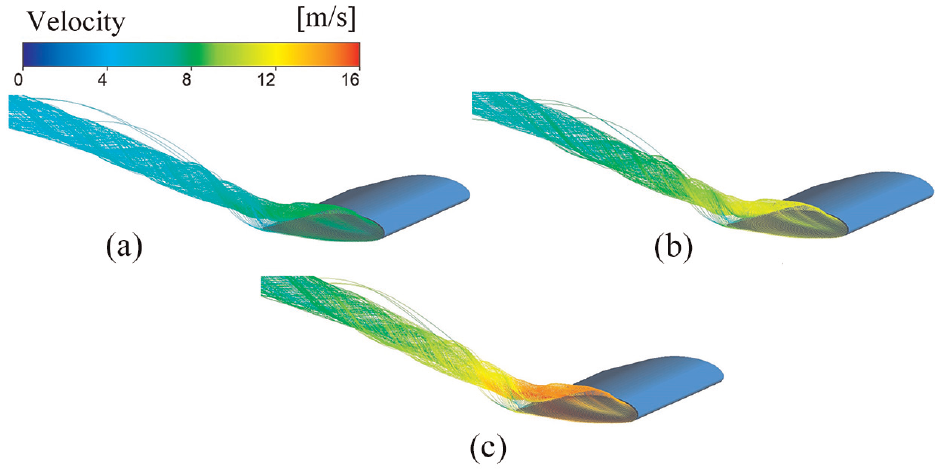
In order to study the vortex structure of hydrofoil tip leakage vortex, the Q criterion (Q = 1 × 10⁶ s−2) was used to show the vortex strength. As can be seen from Figure 5, the main stream passes through the clearance and forms a jet effect at the clearance outlet. The jet and the main stream entrain to form a tip leakage vortex, which is mainly divided into main leakage vortex and separation vortex. The flow evolution of tip leakage vortex can be divided into three stages. In stage I, the main leakage vortex and separation vortex develop independently; In stage II, the main leakage vortex and the separation vortex merge; In stage III, main leakage vortex dissipates. In stage I, the vortex scales of the main leakage vortex and the separation vortex are very small. The main leakage vortex is born at the corner of the suction surface of the leading edge of the hydrofoil, while the separation vortex is born at the corner of the pressure surface of the leading edge of the hydrofoil. Therefore, there is no interaction between the main leakage vortex and the separation vortex, and they are in an independent development stage. At this time, the size of the main leakage vortex gradually increases, while the separation vortex gradually moves from the pressure to the suction surface. In stage II, near the trailing edge of the hydrofoil, the separation vortex surrounds the main leakage vortex, and is finally sucked up by the main leakage vortex. Finally, in stage III, the main leakage vortex is in a strong state and then dissipates gradually. With the increase of the main flow velocity, the vortex intensity of the main leakage vortex and the separation vortex gradually increases, and the fusion point of the two vortexes is closer to the leading edge of the hydrofoil. In particular, when the flow rate is 10 m/s, the tip leakage vortex has the longest track and the largest vortex scale, resulting in more energy dissipation.

Flow pattern of tip leakage vortex: (a) v =6 m/s, (b) v = 8 m/s, and (c) v = 10 m/s.
In order to capture the flow track of the tip leakage vortex, a line segment is made in the clearance, and the flow line is arranged starting from the line segment. As can be seen from Figure 6, due to the pressure difference between the pressure surface and the suction surface of the hydrofoil, leakage flow occurs in the clearance, and the angle between the flow direction and the mainstream direction is about 45°. In the clearance, the flow velocity of the leakage flow increases gradually, and the flow velocity reaches the maximum when it is mixed with the main stream. The larger the inlet flow velocity, the larger the maximum value of the leakage flow velocity, which was 8, 11.3, and 15.6 m/s, respectively, and the maximum flow velocity of the leakage vortex increased non-linearly. The leakage flow and the main stream encoil each other near the pressure surface of the hydrofoil to form a spiral leakage vortex, and the flow lines intertwine. Along the flow path of the main leakage vortex, the velocity of the main leakage vortex increases gradually. When approaching the trailing edge, the velocity is maximum due to the fusion of the separation vortices. After that, with the dissipation of leakage vortex, the velocity gradually decreases. Taking the calculated condition with an inlet velocity of 10 m/s as an example, the flow velocity along the leakage vortex line segment increases from 13.2 to 15.6 m/s and then gradually decreases to 8.3 m/s. Comparing the flow lines of different flow rates, it is found that the angle between the main leakage vortex and the main flow becomes larger and larger as the flow rate increases. This is because the higher the flow rate, the stronger the jet effect in the clearance.
Streamline of tip leakage vortex: (a) v =6 m/s, (b) v = 8 m/s, and (c) v = 10 m/s.
The vorticity and turbulent kinetic energy dissipate on the motion trajectory
The magnitude of the turbulent kinetic energy characterizes the intensity of the turbulent flow, and larger values imply an increase in the length and time span of the pulsations during the development of the turbulent flow. An increase in turbulent kinetic energy in fluid leads to an increase in the intensity of vortex bypassing, and the turbulent kinetic energy dissipation rate is an indicator that describes the turbulent energy loss. Budugur 35 found that viscous loss is directly proportional to the turbulent kinetic energy that characterizes the velocity pulsation. The localized pressure drop and viscous loss due to leakage flow at the top of the blade is the main cause of axial hydrodynamic efficiency decline, and the viscous loss in the hydrofoil end region due to turbulence kinetic energy dissipation accounts for 91.2% of the total viscous loss in the gap region. 36
In order to analyze the vorticity and turbulent kinetic energy dissipation of clearance leakage vortices, 11 sections were made along the movement path of clearance leakage vortices, named A1–A11 in turn, and the vorticity and turbulent kinetic energy dissipation were displayed on the sections. As can be seen from Figure 7, the point with the highest vorticity on each section is defined as the core of the vortex core, and the movement trajectory of the main leakage vortex is formed by connecting each point. It is found that the vortex core moves forward and tends to move away from the inside of the flow channel. Along the trajectory of the main leakage vortex, the vorticity of the vortex core on the cross section gradually decreases, while the vorticity range gradually expands. Leakage vortex core has the strongest vorticity, with the vortex core as the center of the circle, the vorticity gradually decreases along the radial direction. Along the motion path of the separation vortex, the vortex volume of the vortex core on the section gradually decreases, and the vortex core gradually approaches the suction surface of the hydrofoil until it fuses with the main leakage vortex core. It is also found that on the same section, the vorticity of the separation vortex is higher than that of the main leakage vortex, indicating that the flow in the clearance is more complicated, forming a small vortex group. With the increase of flow velocity, the core vorticity of tip leakage vortex increases gradually, and the vortex scale increases.

Vorticity distribution in each section of hydrofoil: (a) v =6 m/s, (b) v = 8 m/s, and (c) v = 10 m/s.
It can be seen from Figure 8 that, along the movement path of the main leakage vortex, the turbulent kinetic energy dissipation mainly occurs near the suction surface of the hydrofoil. This indicates that the eddy energy dissipation distribution shows an opposite trend to the eddy energy distribution, that is, the eddy energy dissipation in the vortex core of the leakage vortex is the lowest, and the eddy energy increases gradually along the radial direction with the vortex core as the center. At the same time, the distribution of turbulent kinetic energy dissipation in the clearance is highly coincident with that of leakage vortex. This shows that the leakage vortex is the main form of energy dissipation in this region. Obviously, the strongest turbulent kinetic energy dissipation exists in the clearance, which confirms that the clearance causes non-negligible energy dissipation to hydraulic machinery. The turbulent kinetic energy dissipation increases with the increase of velocity.

Turbulent kinetic energy dissipation distribution in each section of hydrofoil: (a) v =6 m/s, (b) v = 8 m/s, and (c) v = 10 m/s.
The above analysis qualitatively describes the vorticity and turbulent kinetic energy dissipation distribution of each section along the trajectory of the tip leakage vortex. In order to quantitatively analyze the changes of vorticity and turbulent kinetic energy dissipation on the trajectory of clearance leakage vortices, the vortex nuclei on each section were named C1–C11.
Figure 9 shows the dissipation of vorticity and turbulent kinetic energy in the vortex core. It can be seen from Figure 9 that the change law of vorticity and turbulent kinetic energy dissipation is highly consistent with the flow evolution of clearance leakage vortices. Firstly, C1–C3 corresponds to the phase I of the evolution of tip leakage vortex flow. When the vortex core is born, the vorticity is the strongest and the turbulent kinetic energy is dissipated strongly. Along the trajectory of the main leakage vortex, the vorticity and turbulent kinetic energy dissipation in this stage decrease sharply. Secondly, C4–C7 corresponds to phase II of the evolution of tip leakage vortex flow. In this stage, the main leakage vortex and the separation vortex are engulfing and merging with each other, which helps to enhance the vortex strength of the main leakage vortex. Therefore, C4–C7 still maintains a high vorticity, and the vorticity shows a slow downward trend.

Curves of vorticity and turbulent kinetic energy dissipation.
Finally, C8–C11 corresponds to phase III of the evolution of tip leakage vortex flow. In this stage, the vortex size of the main leakage vortex increases and dissipates gradually, while the dissipation of the vortex volume and turbulent kinetic energy decreases gradually. In addition, it is found that with the increase of flow velocity, the flow pattern of tip leakage vortex becomes worse, resulting in higher vorticity and turbulent kinetic energy dissipation.
The turbulent kinetic dissipation energy in the clearance
The flow in tip clearance is complex and is the main energy dissipation area. In order to explore the flow characteristics inside the clearance, the cross section of the tip clearance was extracted, from the beginning of the edge to the trailing edge, as shown in Figure 10. Where l represents the distance from the leading edge of the hydrofoil to the trailing edge, which is normalized, that is, the leading edge of the hydrofoil is 0, and the trailing edge of the hydrofoil is 1. The δ represents the height of the tip clearance, and ζ represents the distance from a certain point in the tip clearance to the tip of the leaf. ζ/δ is used to normalize the height of the tip clearance, that is, the tip of the leaf is 0 and the wall is 1.

Schematic of tip clearance.
As can be seen from Figure 11(a), since the edge of the clearance is a right angle, the fluid impacts the edge of the clearance, forming a small scale vortex at the entrance of the clearance, resulting in a small range of low pressure area. At the same time, a low pressure area is formed in the middle of the clearance, which is caused by the tip separation vortex. Combined with the flow pattern of the separation vortex in Figure 4, it can be found that the separation vortex originates from the pressure surface of the hydrofoil and moves along the tip of the hydrofoil to the suction surface. Obviously, with the increase of velocity, the range of low pressure region caused by separation vortex expands, and the core pressure of separation vortex becomes lower and lower. As can be seen from Figure 11(b), a small range of low speed areas appeared at both the leading edge and trailing edge of the hydrofoil, which were all related to the generation of small-scale vortices. Due to the motion of the separation vortex, the low-pressure region correspondingly appears the low-speed region. In general, the emergence of separation vortices disturbs the pressure gradient and velocity distribution in the clearance.

Velocity and pressure distribution in the middle section of hydrofoil under different working conditions: (a) pressure distribution and (b) velocity distribution.
Figure 12 shows the turbulent kinetic energy dissipation curve in guide vane tip clearance under different velocity conditions. The curve close to the guide vane tip region (ζ/δ = 0–0.3) presents a high turbulent kinetic energy dissipation, reflecting that the region with high energy dissipation is closely related to the generation of vortices. First, both the leading edge and trailing edge vortices enhance the dissipation of turbulent kinetic energy. Secondly, due to the strong entrainment effect of the separation vortex in the middle of the clearance, a high energy dissipation region is generated accordingly. Obviously, the energy dissipation is strongest and widest near the tip of the leaf (ζ/δ = 0). From leaf tip to wall surface, the intensity and range of turbulent kinetic energy dissipation gradually decrease. However, it is found that the turbulent kinetic energy dissipation near the wall (ζ/δ = 1) is much higher than that in the middle of the clearance (ζ/δ = 0.4–0.9). Because small-scale vortices are generated near the wall surface, the energy dissipation is enhanced. In addition, with the increase of flow velocity, the energy loss within the clearance increases significantly.

Curves of turbulent kinetic energy dissipation in clearance: (a) v =6 m/s, (b) v = 8 m/s, and (c) v = 10 m/s.
Conclusion
In this paper, the flow pattern vorticity and turbulent kinetic energy dissipation of the tip leakage vortex of hydrofoil. The movement trajectory and energy dissipation law of tip leakage vortex at different inlet velocity is revealed. The main conclusions are as follows:
(1) The jet and the main stream entrainment form a tip leakage vortex, which is mainly divided into main leakage vortex and separation vortex. The flow evolution of clearance leakage vortices can be divided into three stages: independent development, fusion, and dissipation. As the velocity increases, the trajectory of the tip leakage vortex becomes longer and the vortex scale is larger.
(2) The vorticity is strongest at the core of the leakage vortex, and the vorticity gradually decreases along the radial direction with the core as the center. With the increase of velocity, the tip leakage vortex kinematics deteriorates and both vorticity and turbulent kinetic energy dissipation in the section are enhanced.
(3) The presence of the separation vortex, disrupt the pressure gradient, and velocity distribution inside the clearance. The separation vortex produces strong entrainment in the middle of the clearance, and produces a wide area of high energy dissipation, which causes the strongest turbulent kinetic energy dissipation in the clearance. There is also strong turbulent kinetic energy dissipation near the wall due to the generation of small-scale vortices. With the increase of flow velocity, the energy loss inside the clearance increases significantly. The turbulent energy dissipation at the inlet flow rate of 10 m/s condition is about 5.2 times that of the 6 m/s condition.
Footnotes
Handling Editor: Jianjun Feng
Authors’ contributions
Yuanyuan Gang: Conceptualization, Methodology, Writing-Original draft preparation, Investigation. Ziyao Zhou: Investigation, Writing-Original draft preparation. Jialing Li: Investigation. Liang Peng: Data curation, Investigation. Demin Liu: Supervision, Investigation. Xiaobing Liu: Writing manuscript revision, Supervision. Jiayang Pang: Writing manuscript revision, Supervision.
Declaration of conflicting interests
The author(s) declared no potential conflicts of interest with respect to the research, authorship, and/or publication of this article.
Funding
The author(s) disclosed receipt of the following financial support for the research, authorship, and/or publication of this article: This study is supported by the Sichuan Province Major Science and Technology Project “Development of Key Technologies and Core Equipment of Complete Sets of Variable Speed Pumped Storage Equipment” (Project No. 2022ZDZX0041) and the National Natural Science Foundation of China project “Air doping erosion reduction mechanism and control of cavitation wear coupling damage of pump turbine in high altitude area” (No: U23A20669)
Data availability statement
Data will be made available on request.