
Abstract
To solve the problems of low processing efficiency and poor glass surface quality when using rare earth polishing powder to grind super-hard K9 glass. The potential, phase structure, surface morphology, and particle size distribution of the nano-rare earth polishing powder were characterized. Compare the evaluation indexes such as polishing efficiency, surface morphology, and contact angle after the polishing process is changed. The results of the comparative study show that the average surface roughness of the glass after heating ultrasonic polishing process is 0.9064 nm, the polishing rate reaches 0.748 μm/min, the average surface roughness of the glass without heating ultrasonic polishing process is 1.3175 nm, and the polishing rate reaches 0.586 μm/min, the ultrasonic assisted polishing process is superior to the conventional polishing process. The heating ultrasonic method provides experimental basis for precise and rapid processing.
Keywords
Introduction
K9 optical glass has been applied in various sectors including industry, science, technology, and civilian use as the fast development of cutting-edge technologies. 1 Ultrasonic vibration assisted polishing (UVAP) combines the advantages of ultrasonic vibration and mechanical action. 2 It can prevent the agglomeration and facilitate the even distribution of nanoparticles in the polishing solution compares with traditional abrasive polishing (AP). 3 Recently, lots of achievements are realized in the research of ultrasonic processing and manufacture of production equipment at home and abroad. 4 Higher surface polishing quality of K9 glasses with special purposes is increasingly demanded, 5 which make the development of ultrasonic polishing technology and its application in CMP a research hotspot. 6
According to Qi et al., 7 the ultrasonic vibration-assisted abrasive slurry jet machining of micro-holes on K9 glasses was proposed to enhance the machining performance. It is found that the effect of ultrasonic vibration on the particle trajectories and the resultant particle dynamic impact process in the stagnation zone significantly contributes to the performance enhancement of micro-hole, including the material removal rate and bottom surface morphology, rather than its effect on inducing the additional brittle erosion due to the less increase of particle impact energy. According to Yu et al., 8 axial ultrasonic vibration assisted polishing method was employed to improve polishing efficiency of SiO2 glass, an orthogonal experiment method was adopted to research the effects of five key process parameters. Zhang et al., 9 focused on predicting the generated local surface profile and providing a theoretical basis to reduce this error by controlling the polishing parameters. The results showed that the Preston coefficient is affected by axial ultrasonic amplitude, and large ultrasonic amplitude improves the polishing ability. Zhao et al. 10 investigated the material removal mechanism of ultrasonic vibration assisted polishing (UVAP) on micro cylindrical SiC surface to fulfill a fundamental understanding of this process in comparison to the conventional polishing without employing ultrasonic vibration. Through computation and analysis, it shows that the lower polishing force and relative lower speed as well as the higher vibration frequency and amplitude could result in a lower surface roughness and less polishing marks of micro cylindrical surface on SiC. Li et al. 11 investigated the effect of the ultrasonic vibration on the chemical–mechanical polishing. They established the model of the chemical–mechanical polishing with the assisted ultrasonic vibration in order to understand the contribution of the ultrasonic vibration to chemical–mechanical polishing in detail. Liu et al. 12 installed ultrasonic-assisted magnetic powder grinder on the internal surface of quartz glass tube to accelerate the rolling of abrasive powders, and therefore achieve better polishing quality and higher processing efficiency. Han et al. 13 took an optimization slot-contained rectangular hexahedron ultrasound generator as platform to realize the ultrasound-assisted vibration, then investigated the ultrasound-assisted polishing performance on austenitic stainless steel. Zhai et al. 14 investigated the influence of fluid characteristics on the performance of sonar-assisted polishing and analyzed the effect mode of ultrasound on the removal rate of materials on workpiece surface. Guan et al. 15 utilized ultrasonic vibration grinding technology in the processing of aerospace SiC reflectors in semi-grinding step to investigate the removal mechanism and defects. Ralchenk, 16 Kobayashi, 17 and Suzuki 18 used CVAP in the polishing process, the processing efficiency and polishing quality of workpiece surface were improved simultaneously.
Though lots of efforts have been made, the polishing of K9 optical glasses still faces challenges such as low processing efficiency and poor surface smoothness. In this work, glass surface roughness and polishing rate are selected as the evaluation standard, in view of this, the influence of ultrasound assistance on K9 glass polishing performance is investigated. Meanwhile, various measurements, such as particles size distribution, Zeta potential analysis, XRD, and SEM are used to characterize the rare earth polishing powder. Where after, the author focuses on the impact of different technologies on CMP performance of K9 glass. The morphology of glass surface before and after polishing are observed through AFM, in addition, surface roughness is measured, which will provide a reference for the application and investigation of UVAP on K9 glasses.
Experimental section
Materials and reagent
Rare earth polishing powder was purchased from Anyang Jinshi Abrasives Limited Company, with composition of cerium oxide (CeO2) 66%, lanthanum oxide (La2O3) 35%, and fluorine (F) 4%. Concave glasses and K9 glasses were produced by Haian Baode Optical Glass Limited Company. Silicon wafer with one polished side: (size 10 × 10 mm) was bought from Kaihua Shunsheng Electronic Scientific and Technological Limited Company; absolute ethyl alcohol (99.7%) was purchased from Shandong Jiaying Chemical Limited Company.
Rare earth polishing powder characterization
SZ-100 particle analyzer (HORIBA) was applied to analyze particle size and potentials; small-angle XRD was carried out by D8 Advance powder X-ray diffractometer (Germany, Bruker); the morphology and structure was investigated by SEM.
Preparation and characterization
About 150 g rare earth polishing powder and 500 ml de-ionized (DI) water were mixed in a beaker and stirred by glass rod for 5 min. Then the mixture was transferred into a larger beaker (>2 l), the original beaker was rinsed with DI water for three times and the cleaning solution was transferred into the larger one. After that, DI water was constantly added until the volume of solution reached to 1.5 l, the solution was agitated by glass rod for 5 min, then heated and ultrasonically dispersed for 60 min to obtain polishing solution with evenly distributed rare earth particles. The final solution was ready for experiment in glass polishing machine, and the production process can be seen in Figure 1.

Preparation of rare earth polishing solution.
Preparation of dispersity samples of rare earth polishing solution: Before sample preparation, absolute alcohol was used to clean two concave glasses, a single-polishing-side silicon wafer, and a 150 ml beaker. The cleaned apparatus was ultrasonically treated for 30 min to further remove surface impurities and then dried in an oven. When preparing samples, 100 ml DI water was added into the beaker firstly, then 0.5 ml rare earth polishing solution was added via a disposable pasteur pipet drop by drop, after that the mixture was stirred with glass rod for 5 min, heated in water bath, and ultrasonically treated for 60 min. After ultrasonic treatment, 0.5 ml mixture was obtained by a disposable Pasteur pipet and dropped on the polished side of silicon wafer. Considering the superfine polishing particles and preventing the influence of impurities in the external environment on the testing result, two concave glasses were compressed and inhibit the contact between wafer and surroundings, then it was dried in an oven. At last, AFM was utilized to detect the dried single-polishing-side silicon wafer.
YMPZ-2 automatic metallographic sample polish-grinding machine (Shenzhen Deka Precision Instrument Limited Company) was used to polish on K9 glass surface; HARKE-SPCAX3 contact angle meter (Beijing Hake Test Instrument Factory) was used to measure the contact angle of rare earth polishing solution; Nanite AFM (Nanosurf) was used to investigate the dispersity of particles in polishing solution.
Polishing experiment and technology
Before experiment, the weight of each K9 glass sample was measured by an electronic analytical balance with precision of 0.1 mg. The pump device was firstly activated to allow the circulation of rare earth polishing solution for 2–3 min until all of them were evenly distributed on rotating disk and polishing disk. Four K9 glass were inserted into four circular grooves in the rotating disk; then the pressure pillar was lowered and compress tightly the sample under 0.1 MPa; the rotate speed of polishing disk and rotating disk is set as 260 and 30 rad/min, respectively, meanwhile the polishing time is set as 30 min. After the experiment, the pressure pillar and rotating disk were lifted to obtain K9 glass sample, which was dried and weigh to determine the weight difference before and after the experiment. Besides that, the tester, polishing disk and glass beaker should be cleaned with industrial pure water for next experiment.
Two different polishing technologies were applied in this paper: Technology A was ultrasound-assisted polishing, which can be seen in Figure 2, while Technology B was traditional polishing.

Schematic diagram of Technology A.
Polishing performance evaluation
Polishing rate (VR) is defined as the cutting thickness of polished glass surface per unit time:

Of which, Δm is the mass difference before and after polishing (g); ρ is the density of K9 glass (g/mm3); R is the radius of K9 glass (mm); t is polishing time (s).
The cutting thickness was measured as follows: firstly, subtraction method was used to determine the total removal mass of glass before and after polishing, then the total removal mass on glass surface per unit could be obtained, finally, according to the density of glass, it would be converted into the cutting thickness per unit time. Each weight is the average value of three measurements.
Result and discussion
Characterization of rare earth polishing powder particles
Measurement and analysis of Zeta potential
Zeta potential has great significance since it is closely related to colloidal dispersion stability. In general, higher Zeta potential (positive or negative) leads to higher system stability; otherwise, lower potential results in a more volatile system, as shown in Table 1.
General relationship between Zeta potential and system stability.

According to Figure 3, the Zeta potential of rare earth polishing powder is −46.4 mv, indicating relatively high Zeta potential. Polishing particles are loaded with high energy negative charges, which generates higher repulsive force and prevents the re-agglomeration, results in good stability of the whole solution.

Zeta potential of rare earth polishing powder.
XRD analysis
Figure 4 shows the XRD spectrum of purchased sample, CeO2 standard sample and La2O3 standard sample. The position and relative intensity of characteristic diffraction peaks from the purchased sample (2θ = 28.6°, 33.1°, 47.5°, and 56.8°) are basically consistent with the standard card of CeO2 (JCPDS card, No. 34-0394), each diffraction peak corresponds to (111), (200), (220), and (311) crystal face, respectively. Meanwhile, sharp peaks represent for (400), (331), and (420) crystal face are also easy to identify and show high diffraction intensity, which proves that the sample has good crystal form. The diffraction peak corresponds to 111 crystal face (28.8°), 200 crystal face (33.1°), 220 crystal face (48.1°), and 311 crystal face (56.8°) all belongs to the characteristic peak of CeO2. Besides that, sharp diffraction peaks with high intensity indicated 100 crystal face (26.1°), 102 crystal face (39.5°), 103 crystal face (52.1°), and 114 crystal face (79.1°) can be found in the spectrum, which are consistent with the standard card of La2O3 (JCPDS card, No. 05-0602), demonstrating highly crystallized La2O3 in the sample. Since Ce has smaller atom radius compares to La, isomorphous substitution is taken place in the sample, resulting in smaller lattice constant and diffraction peak shifting to high angle, which further causes the diffraction peak moving to the right side.

XRD spectrum of rare earth polishing powder.
SEM characterization
SEM measurement were carried out on randomly selected rare earth polishing powder and the images are shown in Figure 5. The polishing powder as a whole has a loose structure made up of many small particles without no obvious agglomeration, of which monodispersed particles with loose structure and uniform distribution are clearly identified. The small particle has smooth surface and shows regular oval shape.

SEM of rare earth polishing powder.
Particle size analysis
Figure 6 shows the size distribution of polishing particles, the black curve marked with triangular represents for the possible percentage of particles with a certain size, corresponds to x-axis (particle size) and left y-axis (%), while the blue curve marked with square represents for the accumulation percent of particle size, corresponds to x-axis (particle size) and right y-axis (%). The size of polishing particles mainly focusses on 402–580 nm, particles of 455 nm accounts for 80%, while particles of 514 nm accounts for 20%. It further demonstrates the small size and even distribution of polishing particles.

Size distribution of CeO2 particles.
Polishing performance
Figures 7 and 8 show the surface morphology of K9 glasses polished by Technology A and Technology B, respectively. Before polishing, K9 glass has a rather rough surface with apparent ups and downs. After polishing, the surface of K9 glass becomes flatter. Particularly, the AFM pattern of K9 glass polished by Technology A shows more uniform color distribution, smoother surface, and negligible height difference compares to Technology B, further indicating better polishing performance.

AFM pattern of glass surface before and after polished by Technology A.

AFM pattern of glass surface before and after polished by Technology B.
Mark A1, A2, A3, and A4 correspond to four glasses polished via Technology A, while mark B1, B2, B3, and B4 correspond to four glasses polished by Technology B. Figure 9 shows the surface roughness (RMS) of glasses before and after polishing via Technology A and Technology B, respectively. Four glasses polished via Technology A show the approximately same RMS value, while them polished by Technology B have different ones. The calculated average RMS value for Technology A and Technology B is 0.9064 and 1.3175 nm, respectively, proving the outstanding polishing performance of Technology A. In addition, Technology A could improve the quality rate of glasses in same batch since the RMS value of four glasses are approximately equal to a certain value. Figure 10 shows the wear loss of glasses before and after polishing via Technology A and Technology B, as can be seen from it, the wear loss of Technology A is obviously greater than that of Technology B. The calculated average wear loss of Technology A and Technology B is 0.0398 and 0.0312 g, respectively, which in turn deduces the polishing rate (VR) as 0.748 and 0.586 μm/min according to Formula 1. Therefore, under the same experiment conditions, Technology A can effectively improve the polishing rate. The above conclusions are consistent with Zhao’s research results. 10
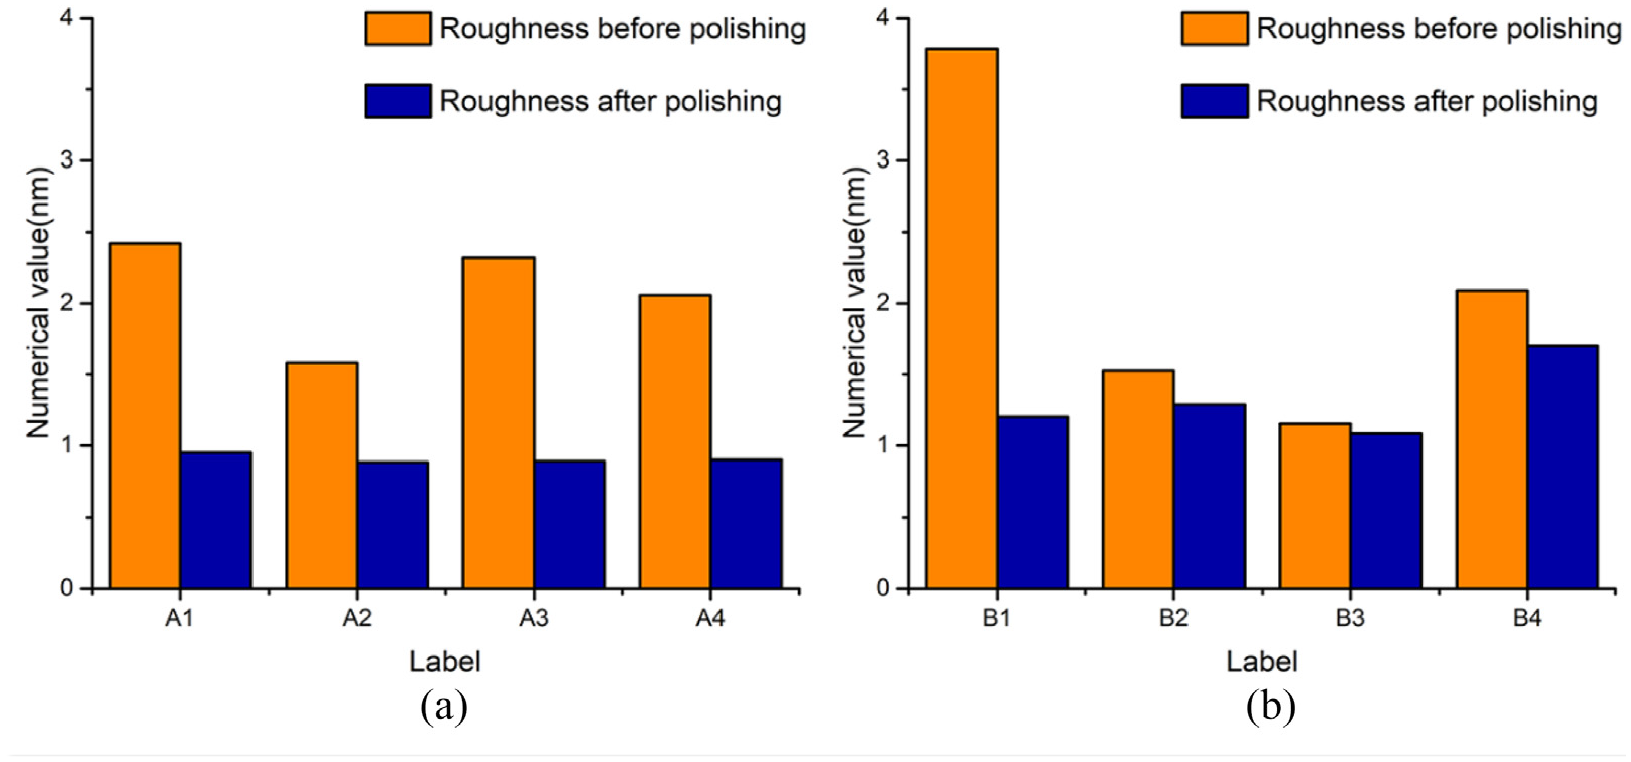
Glass surface roughness histogram of Technology A and Technology B.

Glass wear mass histogram of Technology A and Technology B.
To better reflect the surface smoothness of K9 glass before and after polishing, micro-profile, and overall roughness analysis is carried out with a diagonal of AFM 2D topography (the white straight line shown in Figure 11) as the measurement position. For AFM height map, regions with lighter color represent for higher position, while them with darker color correspond to lower position. In 2D morphology pattern, the color pillar reflects the relationship between color difference and relative height. Figure 11 shows that ups and downs on glass surface of Technology A mainly focus on a small range, while that of Technology B show huge difference.

AFM 2D morphology and diagonal fluctuation profile of polished glass surface.
To sum up, both AFM 3D morphology and surface profile show that Technology A can improve the flatness and decrease the roughness of polished K9 glass surface under same conditions. More importantly, the polishing rate is greatly enhanced by Technology A, demonstrating its huge potential in polishing application with high efficiency and zero damage.
Moreover, the polishing of glass often involves series of mechanical, physical and chemical processes. In the beginning, mechanical action plays a dominant role, under the pressure and rotation of rotating disk, CeO2 particles act as abrasives to continuously remove the ups and downs on glass surface, results in the exposure of new glass surface. Meanwhile, the water-based polishing solution contains large amount of water molecules, parts of SiO2 atomic layers on K9 glass surface will be hydrolyzed by the polishing solution, leads to the broken of internal Si-O-Si bond and the formation of new Si-O bond. Since CeO2 is multivalent, hydrolyzed
Furthermore, La2O3 particles in the polishing solution can bring F ion to glass surface and react with H+ to form HF, which will remove silicon dioxide on the glass surface according to following equation:

Polar Si-O group is electrophilically or nucleophilically attacked by F− or H+, Si-OH will continuously react with HF:

Polishing is a dynamic process, in which instrument abrasion and chemical corrosion interacts with each other. In CMP process, heat is generated from friction on the surface of SiO2 layer, which on one hand provides energy for the broken of Si-O bond, on the other hand lowers the hardness of SiO2 and makes humps on glass surface easy to be removed. Therefore, the interaction of two actions accelerates the removal of humps on glass surface. At the same time, At the same time, the relative velocity between abrasive particles and grinding surface is increased due to the existence of vibration, which improves the polishing efficiency. In addition, the larger particles are broken by vibration, and the size of all particles tends to be the same rapidly. Therefore, the size of the scratch formed by these abrasive particles on the surface of the sample is uniform in the polishing test, which makes the grinding surface more smooth. The flatness of polished glass surface can be improved significantly as the polishing process goes on, even global planarization could be realized.
Rare earth polishing solution characterization
Contact angle analysis
The contact angle δ shows the expansibility of fluid on material surface, lower value indicates better wettability, the polishing solution drops can be fully expanded on glass surface. Moreover, smaller friction resistance in the expansion process ensures uniform polishing film on glass surface. Figure 12 shows the contact angle of polishing solution against glass surface polished by Technology A and Technology B, from which Technology A shows larger contact angle. Therefore, Technology A facilitates the uniform formation of polishing film on glass surface, which in turn improves the polishing performance.

Contact angle of polishing solution against glass surface.
Distribution analysis
Figure 13 shows AFM 3D morphology of single-polishing-side silicon wafer, on which rare earth polishing particles after Technology A and Technology B are distributed. In Figure 13(a), small particles from Technology A are evenly distributed on wafer surface, no large area particle accumulation is detected. While in Figure 13(b), polishing particles from Technology B accumulate severely, cakes with large size can be easily observed.

AFM 3D morphology of single-polishing-side silicon wafer: (a) dispersing small particles and (b) agglomerate.
To further show the dispersion of rare earth polishing powder in the solution, Gwyddion software was used to analyze AFM 2D morphology pattern. Five measurement spots, which marked with 1, 2, 3, 4, and 5, were selected in the pattern for the sake of error reduction. Figures 14 and 15 show AFM 2D morphology and distribution chart of Technology A and Technology B polishing particles, respectively. The distance between two adjacent trough peaks were measured as the distance of polishing particles, while the distance between two adjacent trough bottoms were measured as particles size. Table 2 list the particle distance and particle size of Technology A and Technology B.
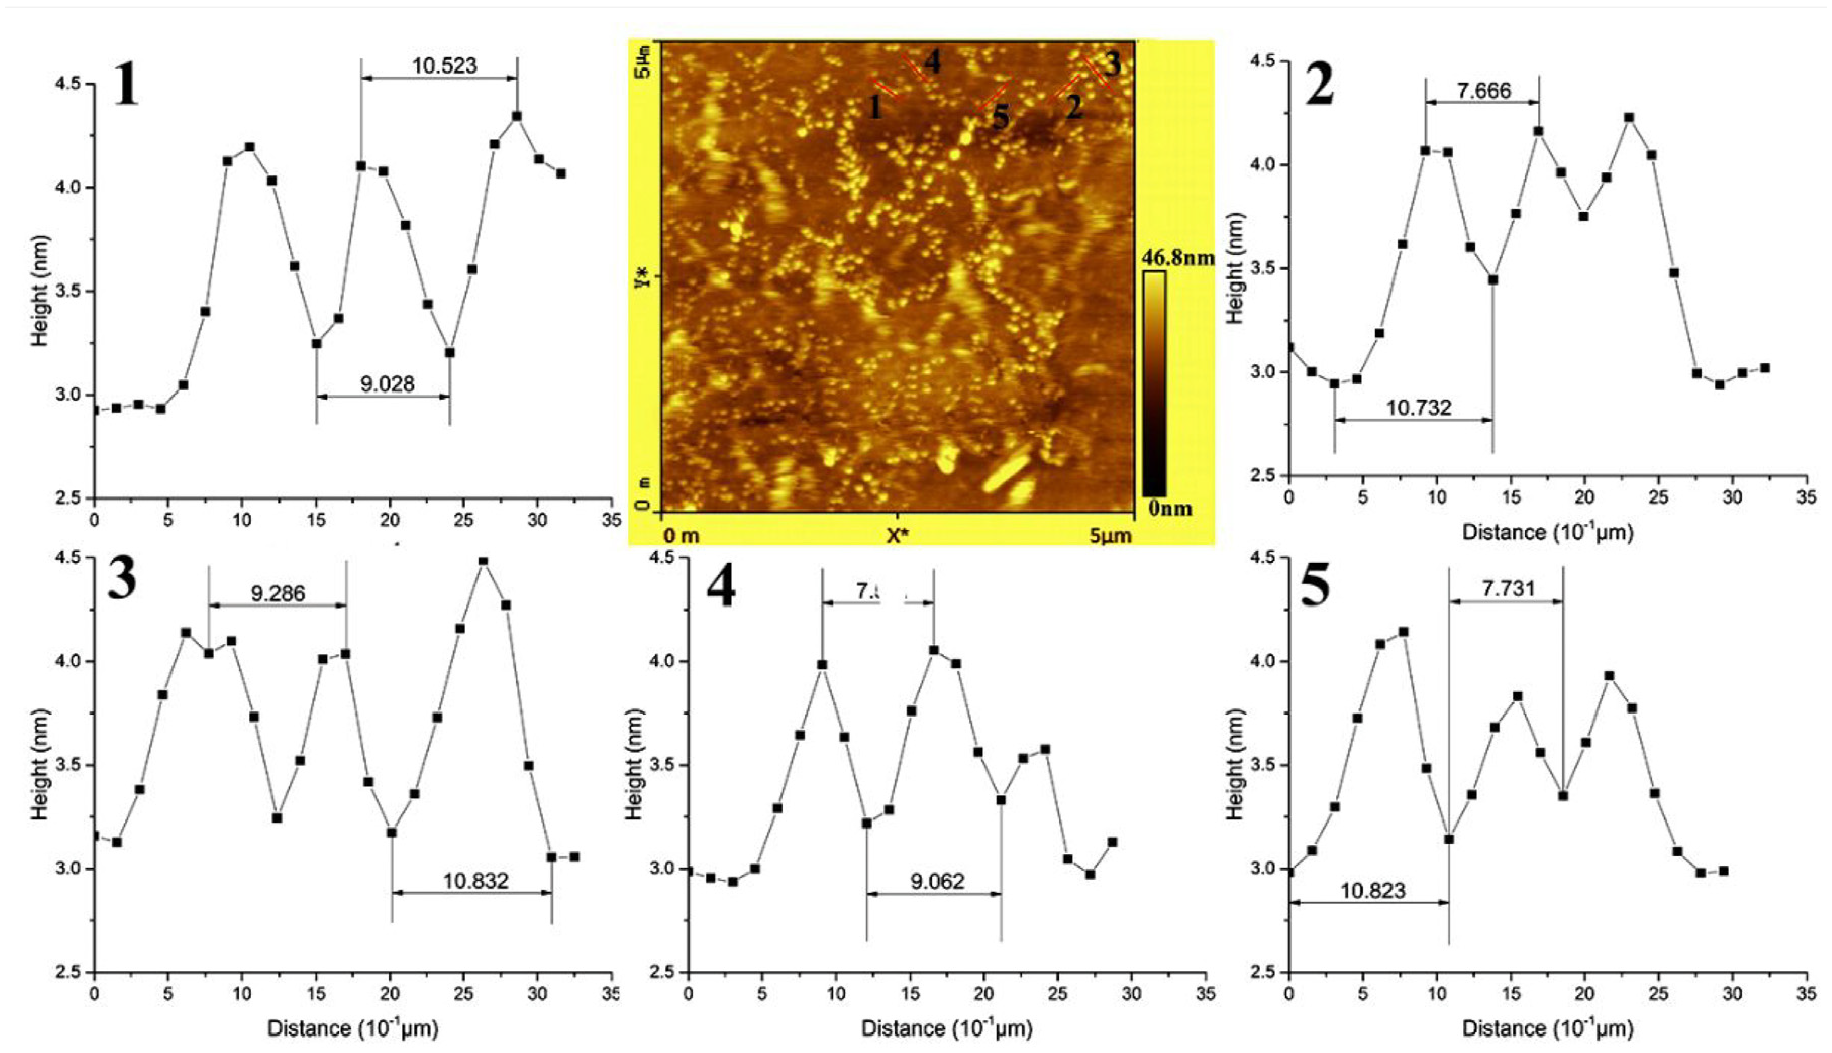
AFM 2D morphology and distribution chart of Technology A polishing particles.
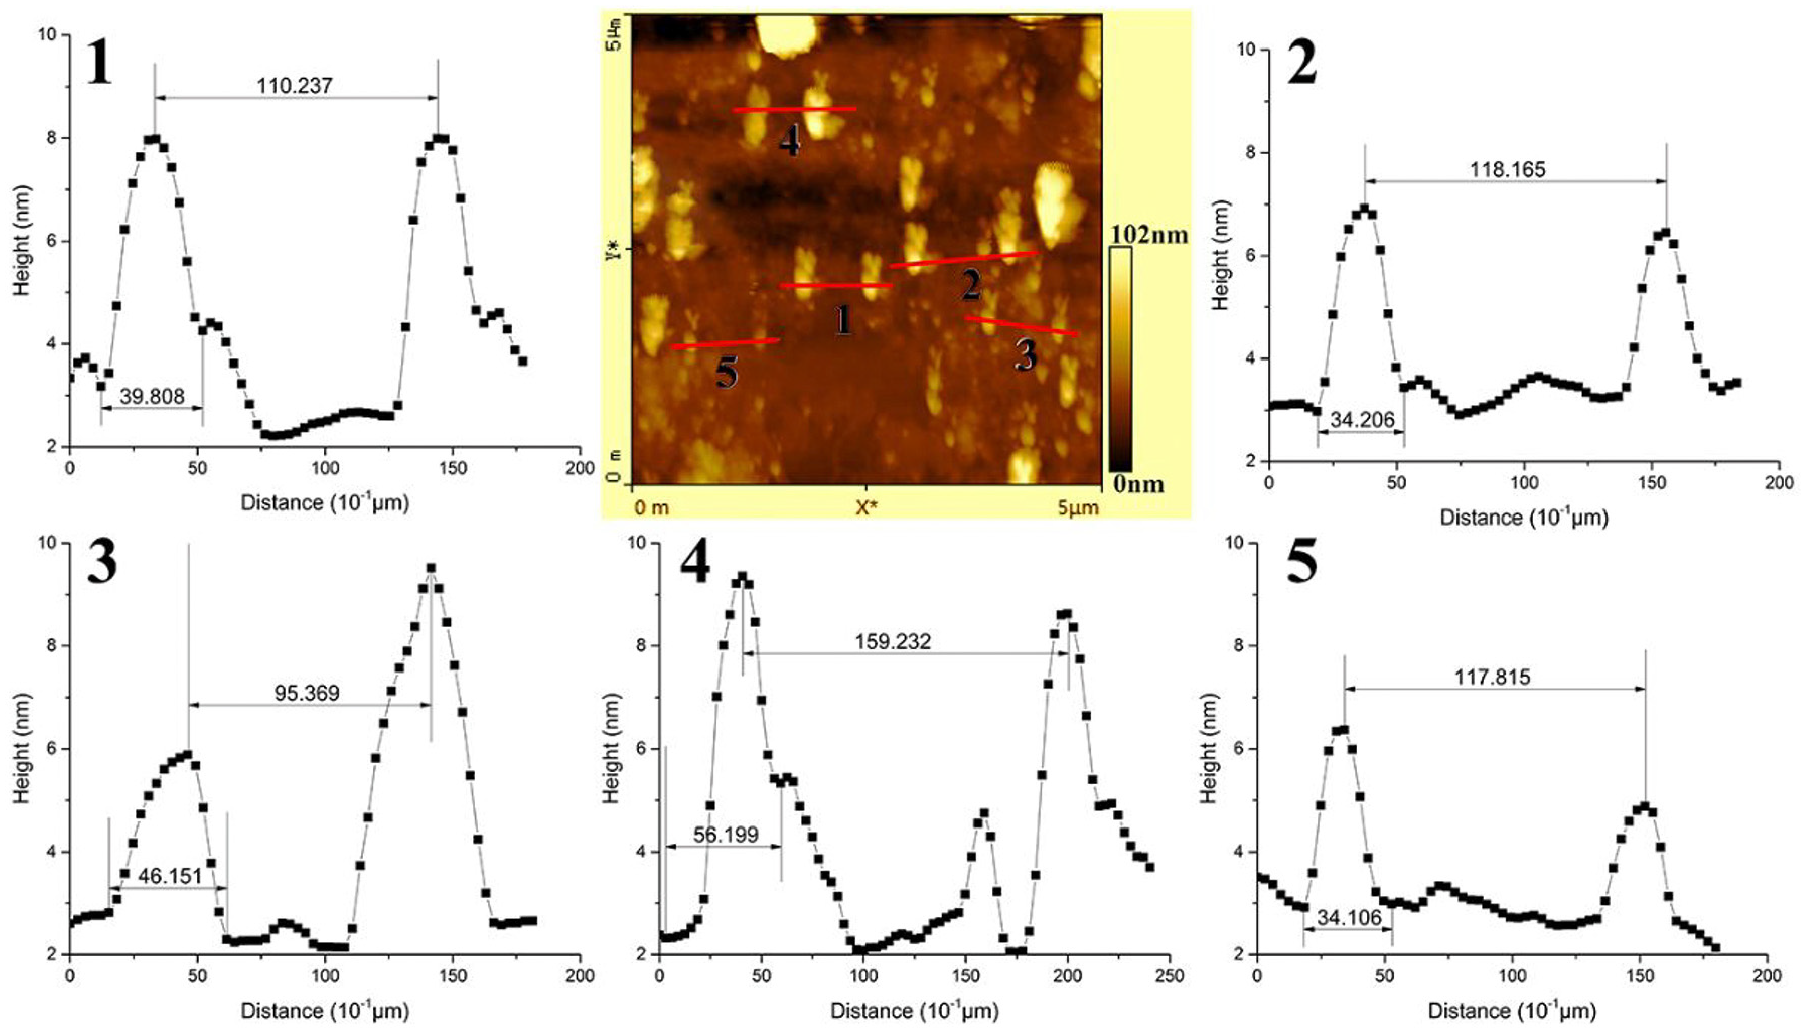
AFM 2D morphology and distribution chart of Technology B polishing particles.
Particle distance and size of different technology polishing solution.

The calculated particle distance and size are as follows: LA=0.8551 μm, LB=12.0164 μm, DA=1.0095μm, DB = 4.2094 μm. Neither DA and DB is in the range of 402–580 nm, demonstrating no accumulation of polishing particles from Technology A and Technology B, additionally, the Technology A has lower accumulation degree. According to Figures 12 to 14 and Table 2, Technology A particles have similar distance, lower accumulation trend, uniform distribution, and good dispersibility; while Technology B particles have different distance, and poor dispersibility. Therefore, Technology A could improve the dispersion of particles in polishing solution, results in better polishing performance.
Conclusions
A series of experiments were carried out to study the influence of ultrasound assistance on K9 glass polishing performance. The results are as follows:
An experimental study on the dispersion performance of the rare earth polishing liquid was carried out. The results show that particles are uniformly dispersed in the polishing solution, no obvious agglomeration is detected. Therefore, ultrasound-assisted friction polishing technology can increase the dispersibility of polishing particles in corresponding solution.
Ultrasound-assisted friction polishing technology is applied in the CMP experiment of K9 glass to investigate its influence on the polishing performance of workpiece. Results show that the interaction of instrument abrasion and chemical corrosion accelerates the removal of humps on glass surface. At the same time,the relative velocity between abrasive particles and grinding surface is increased due to the existence of vibration, which improves the polishing efficiency. And the surface quality of K9 glass can be effectively enhanced, the average surface roughness of polished glass is 0.9064 nm, while the polishing rate is 0.748 μm/min.
Footnotes
Handling Editor: James Baldwin
Author contributions
Conceptualization: Zenan Chu and Qiang He; methodology: Zenan Chu; software: Zenan Chu; validation: Zenan Chu and Tao Wang; formal analysis: Tao Wang; investigation: Zenan Chu; resources: Qiang He; data curation: Zenan Chu; writing – original draft preparation: Zenan Chu; writing – review and editing: Zenan Chu, Kai Zhao, and Qiang He; visualization: Zenan Chu; supervision: Tao Wang; project administration: Qiang He; funding acquisition: QiangHe. All authors have read and agreed to the published version of the manuscript.
Declaration of conflicting interests
The author(s) declared no potential conflicts of interest with respect to the research, authorship, and/or publication of this article.
Funding
The author(s) disclosed receipt of the following financial support for the research, authorship, and/or publication of this article: The authors appreciate the support from the Scientific and Technological Innovation Talents of Universities in Henan Province, grant number 19HASTIT023.