
Abstract
In order to predict the bolt’s stress distribution under the pre-tightening state and the loosening process under the transverse load, a 3D model considering the bolt thread structure was established by finite element method (FEM). In this study, the looseness effect of transverse load amplitude, the friction coefficient of the bolt head load bearing surface and the thread contact surface are mainly studied. The result indicated that the stress under bolt pre-tightening is mainly concentrated on the contact part of the bolt’s head and bar. At the contact area of the load threads at one end and the transition part between the bolt bar and the thread, the stress and axial direction of the thread part are offset. Under the transverse displacement load, the sliding of the bolt can be divided into three stages: full contact, viscous contact, and full slip. The numerical model of bolt relaxation obtained in this paper can provide reference for the application, checking and prediction of threaded fasteners.
Keywords
Introduction
The bolted connection has the advantages of convenient assembly, reliable connection and good economy. It is widely used in automotive, aerospace, energy, medical equipment, and other mechanical equipment. The reliability of bolt connection is related to the normal operation of the whole equipment. In a working environment such as an automobile chassis fastening system, the bolts are subjected to dynamic loads transmitted from the wheels, causing a drop in the clamping force, resulting in abnormal noise, looseness, severe breakage, and a safety accident.1–2
The research on bolt loosening has a long history at home and abroad. The initial researches3–7 focused on the looseness caused by dynamic loads acting along the axis of the fastener (axial loads). However, in a later experimental research, Junker 8 found that the bolts are more prone to loosening when subjected to dynamic loads perpendicular to the axial direction (transverse loads). And in this paper, some more detailed work is done to study the relaxation mechanism under transverse loads. Junker invented the Junker transverse vibration testing machine that is still in use today.
A series of researches by Zadoks and Yu 9 have shown that the presence of transverse displacement will inevitably lead to a decrease in pre-tightening force. Jiang et al.10–12 thought that the bolt self-looseness can be divided into two stages through the test combined with finite element analysis. In the early period, the clamping force is rapidly decreased due to irreversible plastic deformation. Then in the later period, sliding causes relative displacement of the nut bolts, and the clamping force is slowly lowered. Jianhua13,14 studied the loosening mechanism of bolts under axial excitation. It was found that due to the non-uniformity of contact, thread damage showed regional characteristics, and the wear mechanism was mainly adhesive wear, abrasive wear, and delamination. Songlin Zheng 15 used the bench test method to study the fatigue life of the suspension bolts. Guangxue Yang 16 used the finite element software ABAQUS to compare the loose characteristics between a new type of locknut and standard nut under cyclic transverse load.
Based on the above researches, this paper establishes a finite element model of bolted joints. The stress distribution and the loosening mechanism under transverse load are analyzed, which provides theoretical support and help for the bolting and anti-loose technology in practical applications.
Establishment of finite element model
The establishment of appropriate finite element model is the guarantee of accurate analysis. Due to the relatively complicated thread structure of the bolts, most studies have simplified the model to a certain extent without emphasizing the state of stress at the threads. Beam element models, two-dimensional axisymmetric models, and three-dimensional axisymmetric models17–19 are commonly used to simplify finite element models. These simplified models can reduce the modeling workload and solve the computational complexity, but the computational accuracy is relatively insufficient. 16 This paper is to analyze the stress distribution of bolts under static load and transverse load, and the accuracy of the model is crucial.20,21 Therefore, it is necessary to establish an accurate 3D model.
The model of the bolted assembly is established by finite element pre-processing software HyperMesh. As is shown in Figure 1, the connecting assembly consists of bolts, nuts and two clamped plates. The bolts model takes the threaded helix and the threaded angle into account, where the meshing is based on the variation of the distance between the thread surface and the thread axis.

The bolted joint.
At first, we need to draw the cross-section contour of the single-layer thread, as shown in Figure 2(a); Then the number of circumferential elements defined based on the number of mesh layers divided by the axial direction in a single pitch and the angle of rotation between adjacent layers. Stretching the quadrilateral meshes of bolt end faces could form a single layer hexahedral mesh, as shown in Figure 2(b); a single-pitch bolt hexahedron model can be formed by copying, rotating, and nodes replacement, as shown in Figure 2(c); A complete bolt thread hexahedral mesh model can be formed by coping and translating a single-pitch mesh according to the number of male thread teeth and female thread teeth.

Process of thread mesh creation: (a) cross-section contour of the single-layer thread, (b) hexahedral mesh of single layer and (c) hexahedron model of single-pitch bolt.
Finally, the models of nut and the polished rod are established, then they are connected to finish the complete bolt model, and the thread structure of nut is established in the same way. The bolt is established according to the standard fastener M14. The maximum diameter d is 14 mm and the pitch p of the thread is 1.5 mm; The head of the bolt is rounded and simplified, and the diameter and height are 22 mm and 10 mm, respectively; The length, the width, the height and the inner diameter of the clamped plate are 40 mm, 40 mm, 30 mm, and 18 mm, respectively; The outer part of the nut is also circularly simplified, and its diameter is 22 mm; there are six meshing thread tooth among the seven male thread teeth and six female thread teeth. All materials’ (bolt, nut and the clamped plate) Young’s Modulus and Poisson’s ratio are respectively 210 GPa and 0.3. The model contains 113,756 elements and 126,962 nodes. The element type is C3D8R. Validation of the model is provided in Section 2.2 of this article.
Relationship between tightening torque and preload
Theoretical relationship between tightening torque and preload
Since the theoretical value, the simulated value and the experimental value are to be compared below, the theoretical calculation formula used for the theoretical value is provided in this chapter. As for the nut, the component force of the pre-tightening force

The resistance

In order to overcome the frictional resistance between the thread faces, the horizontal force that is converted into a nut can be expressed as follows:

In order to overcome the frictional resistance between the nut and the clamped plate, the horizontal force acting on the nut can be expressed as follows:

For the threaded surface, the horizontal force acts equally on the mid-diameter section of the thread, the resistance arm is:

For the support surface, the distribution of frictional force is more complicated, and the equivalent frictional diameter of the load bearing surface is obtained by the equivalent resistance torque method. 23
Equivalent resistance torque can be expressed as follows:
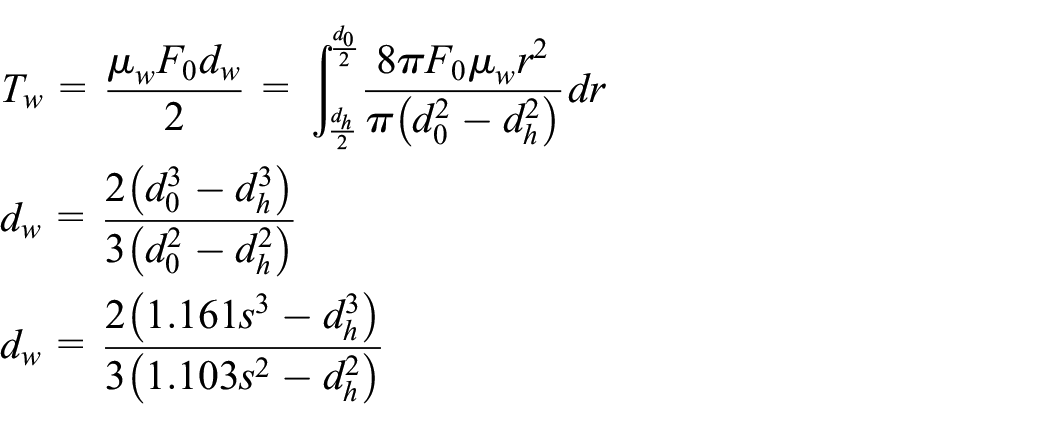
The load bearing surface resistance arm is:

Then the resulting thread torque can be expressed as follows:

The frictional torque of the load bearing surface is:

The tightening torque is equal to the sum of the thread torque and the frictional torque of the load bearing surface can be expressed as follows:

Because,


Therefore, the relationship between axial force and torque can be expressed as:

Among them,
The relation curves of the tightening torque and the preload
Fasten the bolts in the model, and apply a torque of 40 Nm to the nut. The relation curves of the tightening torque and the pre-tightening force (FEM) are shown in Figure 3.

The relation curves of the tightening torque and the pre-tightening force (FEM).
The comparison between the theoretical relation curves of the torque and the axial force (Yamamoto 24 ) and the measured data loaded by the test machine (TEST) shows that there is a good linear relationship between the pre-tightening force and the pre-tightening torque obtained by the theoretical calculation and the test machine loading, and the slopes of the relation curves are almost equal. The theoretical pre-tightening force is higher than the actual measurement; The pre-tightening force and the pre-tightening torque relation curves calculated by the finite element simulation also have a linear relationship and it is located between the theoretical curve and test curve; It is indicated that the tightening torque in the elastic range has a linear relationship with preload and the finite element model is effective.
The relation curves of the nut pre-tightening angle and the pre-tightening force obtained by the finite element simulation are shown in Figure 4. The torsion angle has a linear relationship with the pre-tightening force, but there is a short period of gentle change at the beginning of the preloading, then it enters the linear stage.
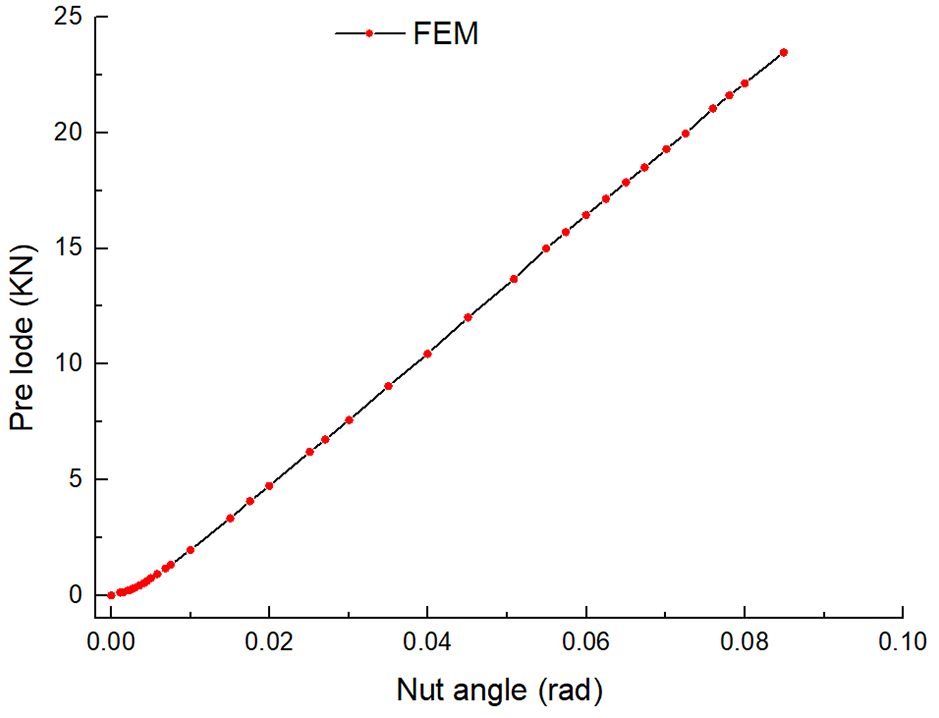
The relation curves of the nut pre-tightening angle and the pre-tightening force.
Rules of thread load distribution
Generally, the closer the thread teeth are to the surface of connected plate the higher the load is. 25 The model adopts 10 threads, and 11 male thread teeth and 10 female thread teeth are used to simulation. The axial pre-tightening force distribution of the bolt thread and the load ratio distribution of each thread are shown in Figures 5 and 6.

The axial pre-tightening force distribution of the bolt thread.

The load ratio distribution of each thread.
Theoretical calculations and simulation results show that the first thread load is the highest, the first and second threads’ load accounts for 31%, and the total load of the former five threads’ accounts for 69%. It can be seen that the thread load is mainly concentrated on the threads near the contact surfaces, and the former half threads’ load occupies about 70% of the total load.
Preloading simulation and stress analysis
Settings of preloading analysis
ABAQUS is a powerful finite element software for engineering simulation, which can solve problems ranging from relatively simple linear analysis to many complex nonlinear problems. In order to simulate the stress distribution of the bolt under preload condition, the finite element model is imported into the ABAQUS for calculation, the outer surface of bolt head and outer surface of nut are completely fixed, and release tangential freedom of the vertical axis from the side to the outer surface of the clamped plate. 25 The friction coefficient of the threaded contact surface is 0.12, the friction coefficient of the clamped plate lower surface and the friction coefficient of the bolt head upper surface are 0.15. The upper surface of the clamped plate and the lower surface of the nut are defined as frictionless contact. A face-to-face contact pair is established between the clamped plate lower surface and the bolt head upper surface, between the clamped plate upper surface and the nut lower surface, and in the threaded engagement. 26 The threaded contact surface adopts tangential Coulomb friction and normal exponential contact. Unthreaded contact surface adopts tangential Coulomb friction and normal direction hard contact. The preload of the bolt is loaded by creating a cross section in the middle of the bolt and loading a 20 kN load on this cross section.27–32
Simulation results of stress analysis
Due to the influence of the angle of the thread, the incompletion of the thread’s start and end, the uneven distribution of the joint stiffness, and the contact characteristics of the thread load, the stress distribution of the thread and the screw portion is slightly offset from the axial direction. The stress distribution of bolt and nut is shown in Figures 7 and 8.

Equivalent stress distribution cloud diagram of bolt under 20 kN preload.

Equivalent stress distribution cloud diagram of nut under 20 kN preload.
It can be found that the high stress is mainly concentrated on the bottom of the first few engaging threads, and the beginning of the thread; The eccentric distribution of the bolt stress can be clearly seen in Figure 7 (the top view of the nut); The closer area is to the contact surface, the stress is higher in the stress distribution of the nut thread; the nut contour can be seen from the distribution of the stress contour on the longitudinal section. According to the distribution of the stress contour on the longitudinal section, the stress distribution of nut thread tends to decrease from the contact end to the free end.
Since the pre-tightening force is applied to the cross section of the screw, the cross-sectional stress distribution of different parts of the screw is shown in Figure 9; the stress at the two ends of the screw shows a distinct concentric circle distribution, and the distribution is gradually weakened near the middle position.
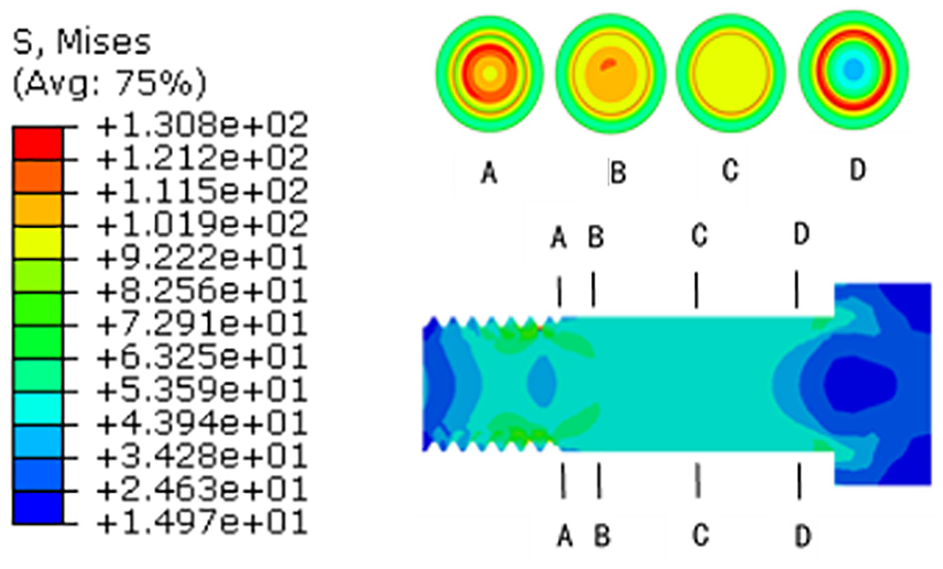
The cross-sectional stress distribution cloud diagram of bolt under 20 kN preload.
Due to the uneven distribution of the thread angle and the circumferential stiffness, the stress distribution at the cross-section near the thread end is incompletely symmetrical, that is, there is a stress deviation, such as the section A and the section B, the closer to the thread end, the more obvious the stress distribution deviation is. In the middle part of the screw, because of the pre-tightening, the influence factors such as the uneven thread angle and the uneven distribution of the circumferential stiffness are blocked, as is shown in section C the distribution of stress at a large part of the cross-section in the middle of the screw is uniform. Because of the sudden change of the load bearing area near the end of the bolt head, the stress distribution appears as a symmetric concentric circle distribution as shown in section D, and the highest stress is mainly concentrated on the transition fillet where the contact area of the screw and bolt head sudden changed.
Transverse load analysis
Settings of transverse loads
After pre-tightening, a transverse displacement load is added to analyze if the bolt connection loose. The upper clamped plate is completely fixed, and the side nodes paralleled to the plane XOZ of lower clamped plate (this plate is in contact with the bolt head) are coupled. A transverse sinusoidal alternating displacement of two cycles is applied to the coupling point. Load A can be expressed as follow:

Among them, the load amplitude
Bolt loosening under transverse displacement load
After calculation, the output is displacement of the coupling point on the side of the clamped plate and the tangential force that is the frictional force between the joint and the bolt head contact surface. The transverse load hysteresis curve is obtained as shown in Figure 10.
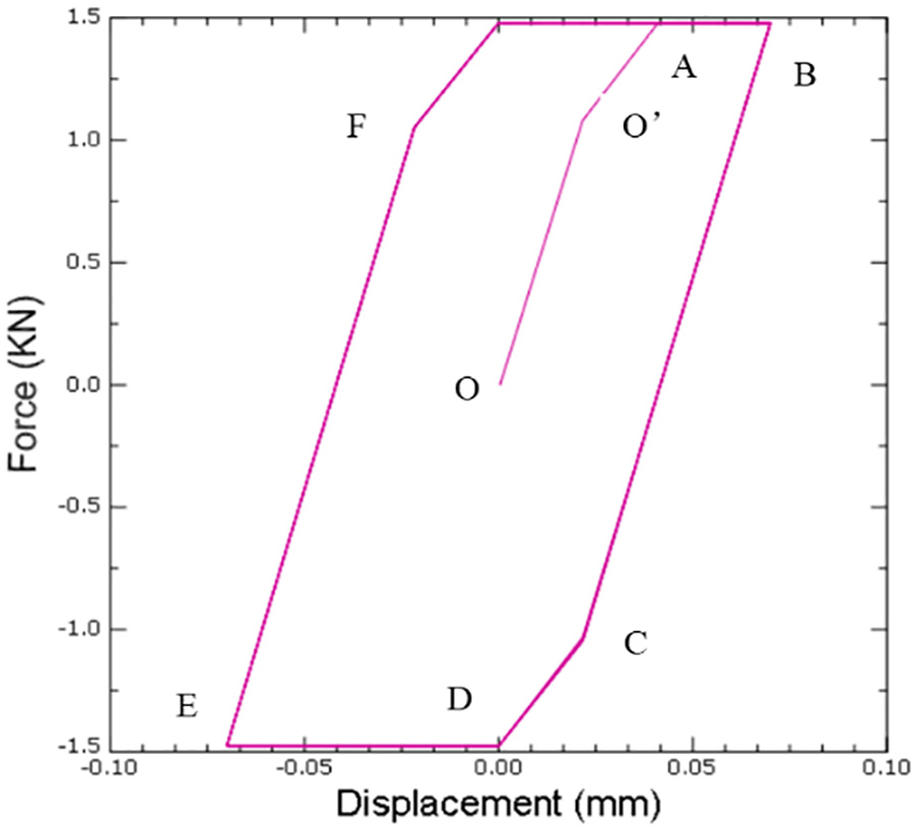
Relationship between transverse displacement load and tangential force.
It shows that the tangential force has three states: steep change state (OO’, BC, EF), gradual change state (O’A, CD, FG), and stationary state (AB, DE, GA). Corresponding, the contact states are: full contact state, viscous state and full slip state. When the tangential force increases from point O to point O’, this phase is a complete static friction process. The tangential force from point A to point B remains stable, it indicates that this phase is in a completely slip state. The intermediate state from O’ point to point A is a viscous state, so the slope of O’A is lower than OO’.
Figure 11 shows the contact change process of the bolt contact surface under transverse displacement loads. The red area indicates the contact state and the green area indicates the slip state.

The contact change process of the bolt contact surface under transverse displacement loads.
Looseness Effect of transverse displacement load amplitude
In order to study the influence of load amplitude variation on the bolting performance, the load amplitude
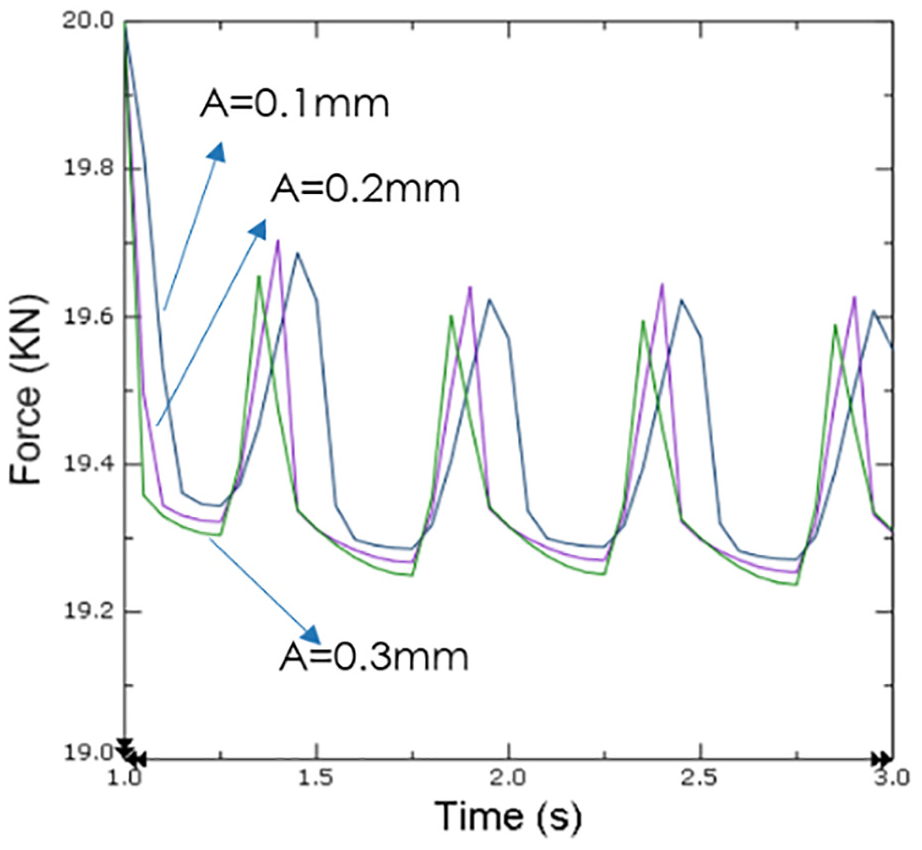
Relationship between transverse displacement preload of different amplitudes.

Nut rotation angle under transverse displacement of different amplitudes.
Moreover, the looseness is more obvious during the first cycle of load. This is mainly because the pre-tightening force caused by the plastic deformation of the bolt and the clamped plate is rapidly decreased at the initial stage of loading, and then the pre-tightening force decreases slowly and tends to be stable. This phenomenon is consistent with the loosening law of bolts in actual use. The hysteresis curve after simulation is shown in Figure 14.

Relationship between transverse displacement of different amplitudes and tangential force.
It can be found that the maximum tangential force is basically the same under different amplitudes. This is because the friction is mainly affected by the friction coefficient of the bolt head and the contact surface of the camped plate. And the effect of the axial preload of the bolt is also a factor of friction changes. After the enlarging of result curve, it is found that the tangential force does not completely coincide after the cyclic load. It can be seen that the larger the transverse displacement amplitude, the larger the tangential force. And the tangential force of the second cycle is slightly larger than the tangential force of the first cycle.
Friction coefficient influence of bolt head load bearing surface on looseness
In order to further study the friction coefficient influence on the bolt looseness, the load bearing surface friction coefficient of the bolt head is 0.14, 0.16, 0.18, the friction coefficient of the thread is 0.12, and the pre-tightening force is obtained after applying the transverse displacement load of 0.2 mm. The pre-tightening force attenuation curve is shown in Figure 15.

Different bolt head load bearing surface friction coefficient − preloading force attenuation curves.
The nut rotation angles under different friction coefficients are shown in Figure 16. It can be seen that the larger the friction coefficient, the more pre-tightening force will decrease and the larger nut rotation angle will be.

Nut rotation angle of different bolt head load bearing surface friction coefficients.
Friction coefficient influence of threaded contact surface on looseness
In order to investigate friction coefficient influence of threaded contact surface on bolt looseness, the friction coefficient of the bolt head load bearing surface is kept to be 0.15, and the friction coefficient of the threaded contact surface is 0.12, 0.14, 0.16 for comparative simulation. Similarly, a pre-tightening force attenuation curve is obtained after applying a transverse displacement load of 0.2 mm as shown in Figure 17, and the nut rotation angle is as shown in Figure 18. It can be seen that compared with Figure 15, the difference between the three pre-tightening force descent curves is not obvious, indicating that the friction coefficient of the thread contact surface has less influence on the looseness of the bolt.
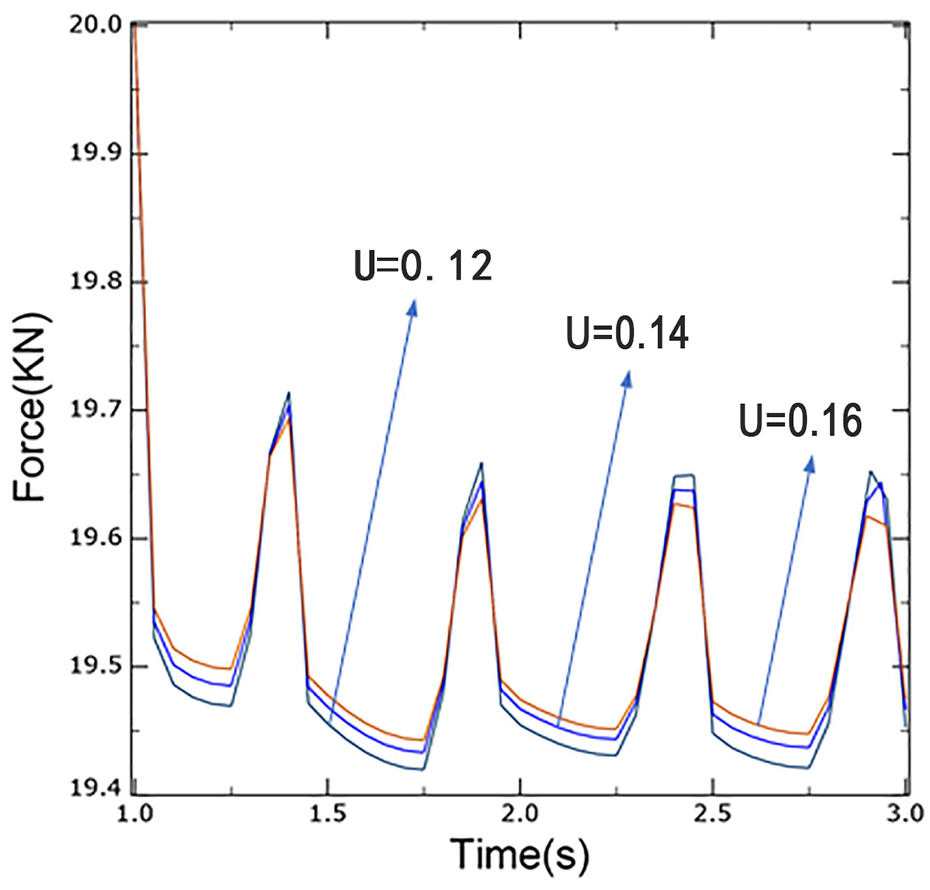
Different thread friction coefficient − preloading force attenuation curves.

Nut rotation angle of different thread friction coefficient.
However, the difference in the nut rotation angle between the different friction coefficients is obvious. It can be seen that the first amplitude load has a greater influence than the second one, and the second amplitude load has a greater influence than the third one, and the main affects occurring in the first cycle of amplitude loading.
Discussion
To sum up, this paper explores the innovative modeling method of threaded joint, validation of model, stress distribution and the characteristics of preload and its decay. The effect of bolt strength grade, size, tooth shape, and loading position on preloading force was analyzed qualitatively by test, which provides a reference for the application, checking and releasing mechanism of threaded fasteners. However, due to the complexity of threaded fasteners, there are still some shortcomings in this paper, and the decay mechanism of threaded fasteners still needs further study:
The amount of simulation calculation is large due to the usage of fine thread model. Long time load spectrum can’t be taken as the input excitation in reflecting the decline of pre-tightening force. We have done both simulations and tests, and find that it still can’t be as well as the bench vibration test;
The experimental samples in this paper are limited, so only some qualitative conclusions can be drawn after processing the limited data, and the quantitative conclusions drawn after expanding the samples will be more conducive to the reference of enterprises;
In the finite element simulation of threaded connection, plastic parameters are not added in the aspect of material properties. When the thread reaches the yield point due to preload or external load, the load and contact changes of the thread, and the decline of preload still need to be further studied.
Conclusion
In this paper, the finite element method is used on the basis of establishing the 3D accurate model of bolt to simulate and analyze the stress distribution and the loosening process of bolts under transverse load. The effects of transverse load and friction coefficient of bolt load bearing surface and thread friction coefficient on loosening are studied. The main conclusions are as follows:
In the case of pre-tightening, the high stress area of the bolt is mainly concentrated on the contact part of the bolt head and the bolt bar, the first few load threads, and the transition part of a screw thread. And the stress of the screw shows a certain degree of eccentric distribution. On basis of this, we can strengthen them according to the distribution of stress in application of bolts manufacturing.
The sliding of the bolt under transverse load can be divided into three states: full contact state, viscous state, and full slip state. The tangential forces corresponding to different states are different.
The greater the transverse load is, the more pre-tightening force decreases, and the larger bolt rotation angle is. The larger friction coefficient of bolt load bearing surfaces is, the greater the effect of preventing the fastening system from entering full slip. Once falling into full slip stage, the greater the friction coefficient is, the greater the influence is on the attenuation and relaxation of preload. Compared with the friction coefficient of the bolt load bearing surface, the friction coefficient of the threaded contact surface has lesser influence in bolt looseness. On basis of this, we can accurately adjust the parameters of bolts to apply that in the manufacture of bolts.
Footnotes
Handling Editor: James Baldwin
Declaration of conflicting interests
The author(s) declared no potential conflicts of interest with respect to the research, authorship, and/or publication of this article.
Funding
The author(s) received no financial support for the research, authorship, and/or publication of this article.