
Abstract
The research of the load distributions and bending stresses with helix deviations in power transmission systems is important for effectively improving gear load capacity. The equations of tooth surface with helix slope and form deviation were established by the given forming rack-cutter tool and the path for processing rack-cutter tool. And various kinds of engaged helical gear models with helix slope and form deviation were developed using finite element method software. Finally, tooth surface load distribution and tooth root bending stress were numerically calculated. The effects of the helix slope deviation, different shape, period, and amplitude of helix form deviation on tooth surface load distribution and tooth root bending stress were investigated and the results were compared to each other as specified by grades 5 and 7. It is found that the single helix slope deviation on tooth surface load distribution and tooth root bending stress shows “superposition” effect. Especially, the different shapes, periods, and amplitudes of helix form deviation exhibit significant effect on tooth surface load distribution and tooth root bending stress. Helix form deviation mainly affects the tooth surface load distribution and tooth root bending stress along the tooth longitudinal direction, while has little impact between tooth pairs. The study benefits gear load capacity analysis and provides valuable guidelines for improving the performance of power transmission systems.
Keywords
Introduction
Helical gears are widely applied in many types of mechanical equipments with the advantages of high contact ratio, excellent mesh performance, and high load capacity. 1 In the gear machining process, it is believed that the installation error of rack-cutter, the distortion of slide guide in the machine tool, and the indexing drive-chain period error are the main reasons of helix deviation generated. It is impossible to make the mating gear enter contact in pure involute position because there is a sudden interference corresponding to the helix deviation. Real meshing tooth profile of helical gears deviates from the ideal location under tooth deviation and causes stress concentration and the change in the tooth surface load distribution (TSLD). Consequently, the helical gear load capacity decreases. Therefore, investigating the TSLD and tooth root bending stress (TRBS) response under the helix deviation is very significant for effectively improving the helical gear load capacity.
Until now, many investigations have been performed on TSLD and TRBS. A qualitative analysis on the effect of no deviation for spur gear on tooth bending stress, contact stress, and load distribution were performed using the analytic calculation method.2,3 Some scholars4,5 investigated the effect of manufacturing and assembly-related carrier and tooth deviations on load distribution using finite element method (FEM). Li6–8 investigated the effect of assembly error, manufacturing error, and tooth modification on load distribution, bending stress, contact stress, and transmission error of spur gear using FEM and experimental methods. The result showed that manufacturing error and assembly error greatly affected the load distribution and bending stress, which were in agreement with the measured one. Some scholars9,10 built a model for spur gears with manufacturing error and assembly error as well as its effect on the dynamic behavior was investigated. The above-mentioned researches on gear performance with profile deviation, assembly error, and tooth modification have focused on dynamic behavior, contact strength, transmission error, and noise vibration harshness (NVH). However, spur gears were still the main research object. Liu 11 investigated the effect of tooth deviation of helical gear on tooth contact load and transmission error. It drew a conclusion that the existence of errors magnified the contact stress and deformation. Guilbault et al.12,13 investigated the effect of diverse helix slope and form deviation on the bending stress and load distribution given by a sine-wave presenting three protuberances over the face width. The effect of flank deviation on the tooth surface contact stress and load distribution was performed by Wei et al. 14 However, all these studies simplified the error model, thus inducing a big difference between research and actual situation.
The equations of tooth surface with helix slope and form deviation were established based on the conjugated theory and the given rack-cutter equation. In order to improve the modeling efficiency, the helix deviation was carried out on the rack-cutter and the path for processing rack-cutter tool. Thus, the desired helical gear with helix deviation was obtained. And new approaches for establishment of FEM with flank deviations were proposed. Finally, the processes of meshing for the helical gear with helix slope and form deviation were simulated.
Definition and description of helix deviation
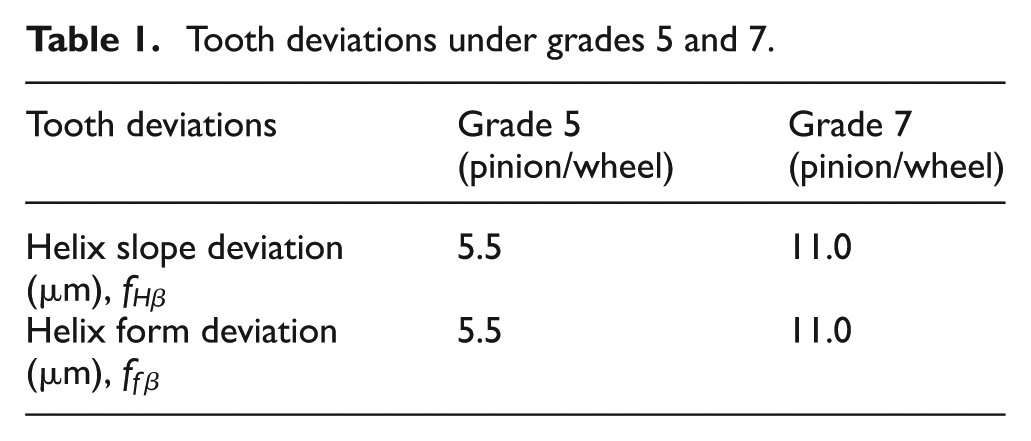
The helix deviation refers to the distance of the actual helix and the ideal helix measure in the tangential direction of the transverse base circle. 15 Helix deviation under different accuracy grades from their tooth number is listed in Table 1. The toothed portion’s design range Lβ has been decreased by 5% of the tooth width b 16 from its both sides, resulting in the evaluation length being shorter than the tooth face width (Figure 1). In this study, the evaluation length is equal to the tooth face width for taking the state of engaging-in and engaging-out into account.
Tooth deviations under grades 5 and 7.
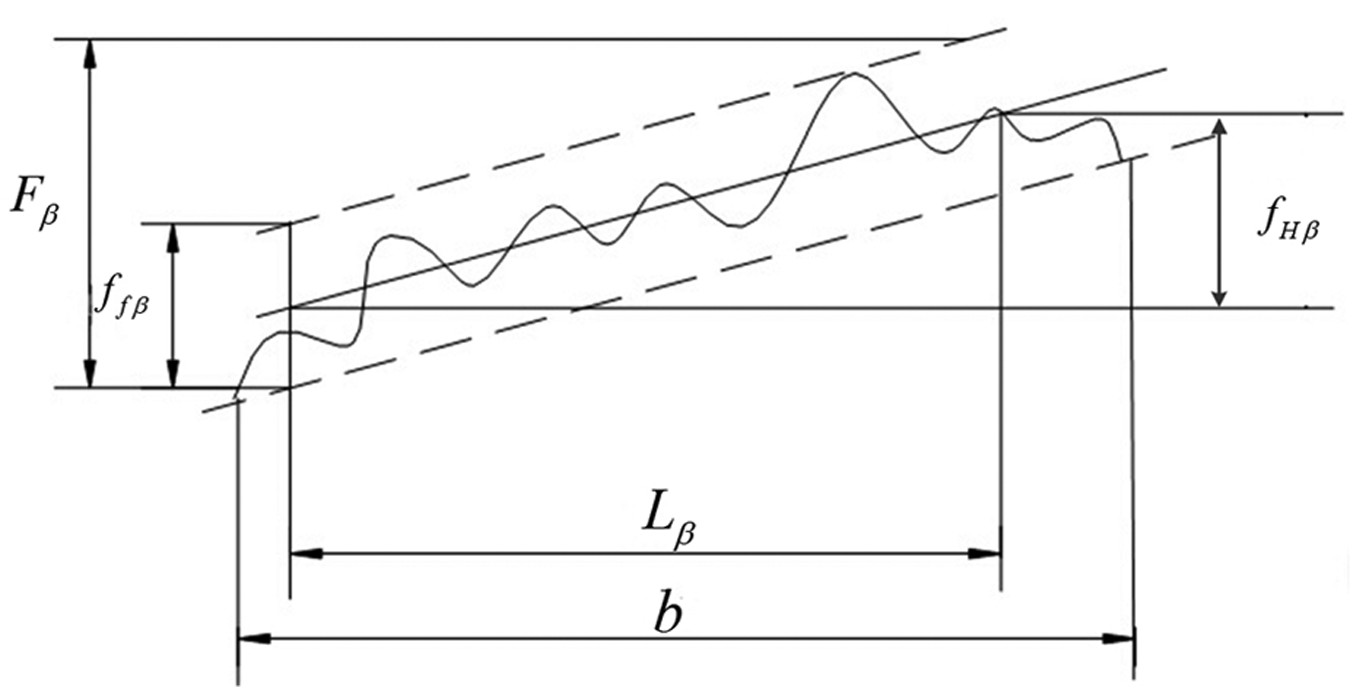
Helix deviation.
Helix slope deviation
The definition of helix slope deviation (HSD) is the distance between two design helix lines which intersect the mean helix line at the endpoints of the valuation range. The error corresponds to the helical angle of the slope of average line of the trace error curve, as shown in Figure 2. Normally, when actual helix angle is greater than the design value, HSD is positive, whereas negative.
15
Using an orthogonal experimental strategy, the simulation of three cases (in Table 2) covers possible typical combinations. Cases A and D represent the single tooth pair with HSD, and Case E represents the combination of Cases A and D. Nevertheless, the offset of the axial direction in middle section of the gear is defined as 0, from the middle section to the two cross sections keeping an offset of equal distance but in the opposite direction to reduce the effect of single pitch deviation when analyzing HSD.
14
Error of the tooth trace.
Case with HSD.

Helix form deviation
Helix form deviation (HFD) measurement is made between two design helix lines to the mean helix trace. The two design helix lines are separated by a given HFD value 15 (Figure 2). The different shapes of HFD are given both by a sine-wave and saw-toothed wave presenting the same protuberances over the face width, such that the driving pinion and driven wheel deviations are in phase (Figure 3). It can be assumed that the two pairs of tooth on TRBS and TSLD are limited to the deviated tooth pair itself when analyzing TRBS and TSLD with HFD. Thus, the driving pinion and driven wheel of tooth pair 2 with HFD are investigated, while theoretical form is kept on the other teeth pairs. Finally, different periods of the HFD over face width are also investigated.

Studied different shapes of HFD.
The contact lines are shown on pinion member in Figure 4, where two tooth pairs mesh simultaneously. Figure 4 also presents the tooth meshing sequence: tooth pair 1 is the main meshing tooth pair, while tooth pair 2 follows. It is found that contact line 2 in tooth pair 2 passes through the whole tooth surface. For tooth pair 1, the contact line 1 passes from a radius above the pitch circle to the tip circle (Figure 4).

Contact lines for the meshing position considered.
Establishment of the equation of tooth surface with helix deviation
Equation of tooth surface with HSD
The typical rack-cutter consists of straight lines and tip circular fillet, which can generate involutes and fillets of typical involute tooth, respectively. The normal profile of rack-cutter and tool coordinate system are shown in Figures 5 and 6.17,18 The involute profile of helical gear is generated from straight line

Normal profile for rack-cutter.
Coordination system transformations.
The coordinate systems
The equation of the straight line

where t is the distance variable of the tooth profile,
The positive HSD is taken as the object of study. The straight lines DEF and MEH are the projection of HSD and design helix line (Figure 7). The actual helical angles can be calculated after the above parameters are determined based on the geometric relationship. Assuming that

Schematic illustration of helix slope deviation.
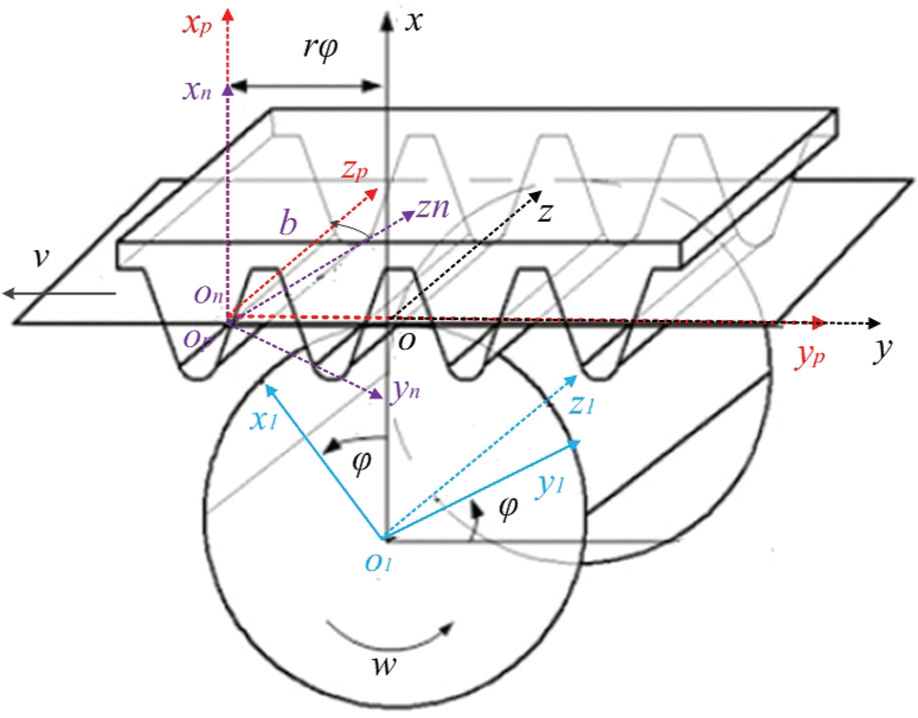
The concept of axode is applied in conjugate contact conditions of helical gears; 18 the instantaneous axis of rotation oz is listed in Sp as

The meshing equation of gear is listed in Sp as follows

where
Then, we transfer the coordinate Sn
to Sp
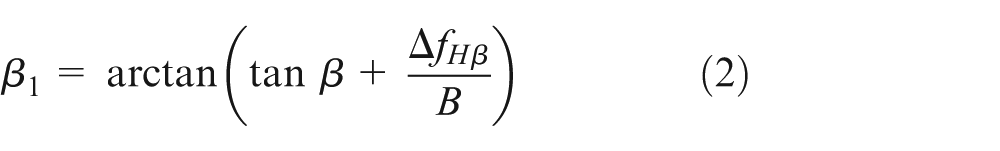
with helical angle

where B is the tooth width,
Equations (2)–(6) yield that

Then, the equation of tooth surface with HSD can be obtained, and the transformation equation of equation (6) in S 1 is
where for the symbols “±” and “∓” in this formula, the upper symbol represents the tooth surface equation with HSD between the middle section N 2–N 2 and the front cross section N 1–N 1 and the lower symbol represents the tooth surface equation with HSD between the middle section N 2–N 2 and the rear cross section N 3–N 3.
In a similar way, the equation of tooth root surface with HSD can be obtained

Equation of tooth surface with HFD
According to the method in “Equation of tooth surface with HSD,” the equation of the spur gear involute can be obtained in the coordinate system S 1 (Figure 6) as follows
where

For the HFD of sine wave

For the HFD of saw-toothed wave

where
To obtain the tooth surface equation of helical gear, the tooth surface equation of spur gear is mapped to the helical gear surface by coordinate transformation; transformation matrix

where
According to equations (10)–(13), the equation of tooth surface with HFD can be obtained in the coordinate system S 1 as follows

In a similar way, the equation of tooth root surface with HFD can be obtained in the coordinate system S 1 as follows

Establishment of FE model of helical gear with helix deviation
The analysis model was a pair of involute helical gears, with geometric parameters of gear teeth number Z 1/Z 2 = 19/29, module mn = 2.5 mm, pressure angle αn = 20°, face width B = 16 mm, and helix angle = 25°. The material of the pinion and wheel in this study was 20CrMnTi with the properties of Young’s modulus E = 206 GPa and Poisson’s ratio = 0.3.
There were three processes of developing approach for the FE models as follows:
Establish model of helical gear with helix deviation
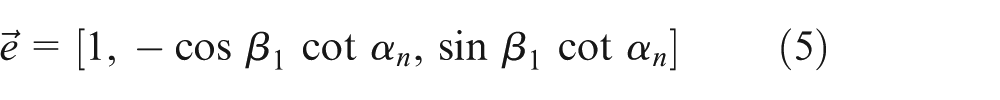
Step 1: Points of the tooth surface with HFD or HSD were generated according to the derived equations (8) and (9) or (14) and (15) in section “Equation of tooth surface with HFD.” The distributions of points were even along the longitudinal direction. While the other teeth points without helix deviation remained unchanged according to the equation of the involute, the tooth root fillet, transition curve of tooth root, and tooth top. 17 Thus, each curve segment was discretized into points in the corresponding coordinates, as shown in Figure 8(a).
Step 2: The tooth surfaces with and without helix deviation were reconstructed according to the generated points, as shown in Figure 8(b).
Step 3: Array those tooth surfaces along the circumferential direction and merge coincident surfaces. The full gear geometry model was accomplished using Boolean operation, as shown in Figure 8(c).
Step 4: The helix gear solid model with helix deviation was discretized with eight-node hexahedron isoperimetric elements. However, the total tooth model contained many nodes and elements. It was time-consuming when conducting a loaded tooth contact analysis (LTCA). Thus, a simplified FE model was further developed, where only five teeth in the meshing zone were included, as shown in Figure 8(d).
Illustrations of (a) points of the tooth surface, (b) reconstructed tooth surface, (c) the full gear geometry model with deviation and (d) simplified FEM.
Set contact pairs for the gears
Generally, the surface that has larger curvature would be chosen as the contact surface. Thus, the tooth surface nodes of driving pinion were picked as contact surface and the tooth surface nodes of driven gear were defined as target surface. 21 Two contact pairs are shown in Figure 9.
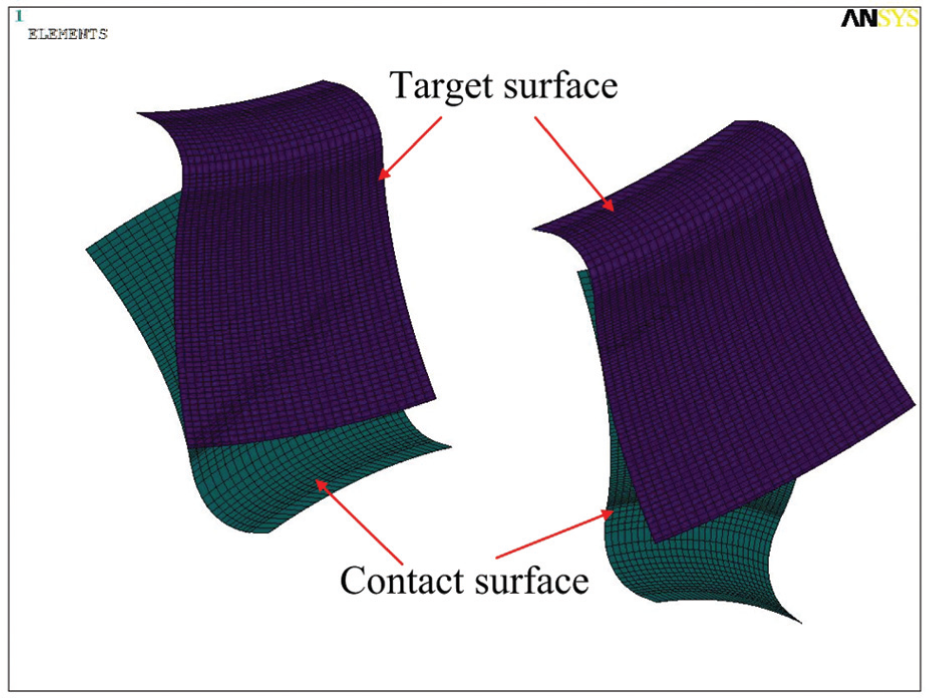
Definition of contact pairs when two tooth pairs are in contact.
Set boundary conditions and loads
The nodes of the inner ring of driven gear were fixed by restricting all degrees of freedom. The degrees of freedom of radial and axial movement of driving pinion were constrained, but the degree of freedom of rotation around the axis was reserved and coupled with the inner nodes of driving pinion (Figure 10). The transmission torque was exerted to the each node in the form of circumferential force.
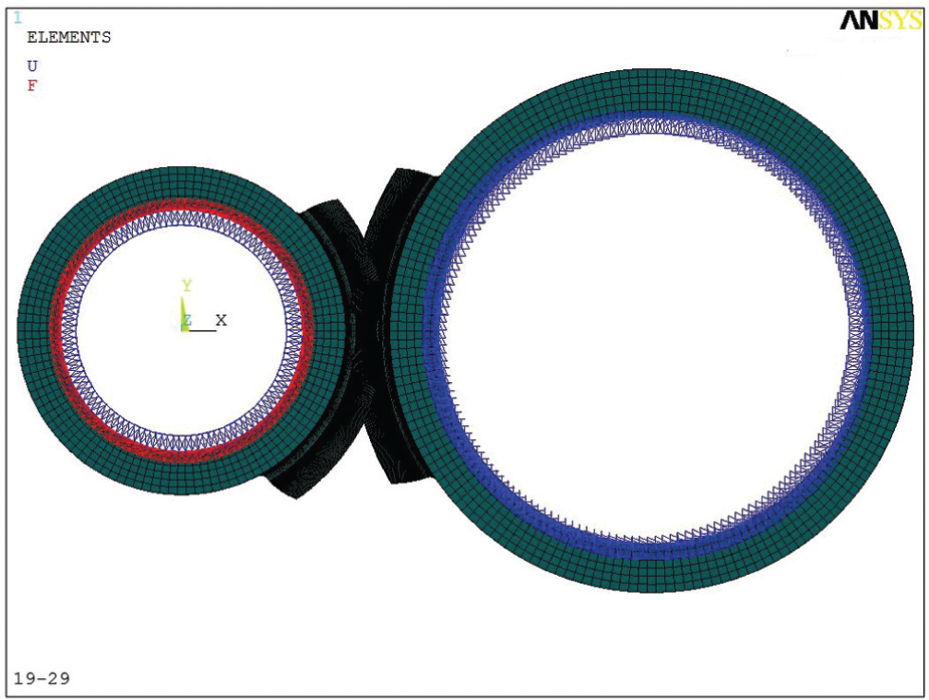
Boundary conditions and loading of force F at every node on inner hole surface of driving gear in rotational direction.
Results and discussion
Effect of the HSD on TSLD
The curves of TSLD along tooth longitudinal direction under the different accuracy grades (grade 5 and grade 7) are illustrated in Figures 11 and 12 when the torque (T = 90 N m) is applied. The distribution of contact stress and bending stress of Case A under grade 7 for the driving pinion is shown in Figure 12. The TSLD peak amplitude and percentage increments of HSD gear compared with no deviation gear under different accuracy grades are listed in Table 3. Through analysis based on Figures 11 and 12, the following results can be drawn:
The TSLD of tooth pair 1 in Case A and tooth pair 2 in Case D is very non-uniform in the longitudinal direction as shown in Figures 11(a) and 12(b). The TSLD occurs only in the contact areas B, C, and D, while it equals 0 in the non-contact area A. The TSLD between areas B and C is larger than no deviation. As the value of deviation increases, the maximum TSLD increases in areas B and C, while it decreases sharply with increasing deviation in area D. That is, the elastic deformation cannot compensate for deviations caused by deformation at the meshing point. As a result, the contact area, position, and length of the contact line are changed, resulting in the TSLD curves of the Figures 11(a) and 12(b) exerting noticeable changes.
It can be found from Figures 11(b) and 12(a) that the TSLD curves of tooth pair 2 in Case A and tooth pair 1 in Case D are almost parallel to each other and exert relatively small changes by comparing the curve of TSLD with no deviation. It is because there are no deviations on these tooth pairs. Moreover, it is found that HSD mainly affects the TSLD along the tooth longitudinal direction, while has little impact between tooth pairs by comparing those curves in Figures 11 and 12.
The distribution of contact stress and bending stress (MPa) of Case A with HSD for driving pinion is shown in Figure 13. It is found that the contact stresses at area a are larger than that at area b. That is because the elastic deformation at area a is always larger than that at area b when FE analysis of TSLD considers the model of Case A with HSD as the contact research object. Moreover, the contact stress (669 MPa) and the size of contact area occurred in area a are much larger than that occurred in area b.
Table 3 indicates that the maximum load increase is 81 N/mm for grade 7 and 41 N/mm for grade 5 in Case A, while it is 127 N/mm for grade 7 and 62 N/mm for grade 5 in Case D. That is to say, TSLD percentage increments of grade 7 are twice that of grade 5. Those results also reveal that the effects of Case D on the TSLD are larger than Case A.

TSLD of Case A with HSD: (a) tooth pair 1 and (b) tooth pair 2.

TSLD of Case D with HSD: (a) tooth pair 1 and (b) tooth pair 2.
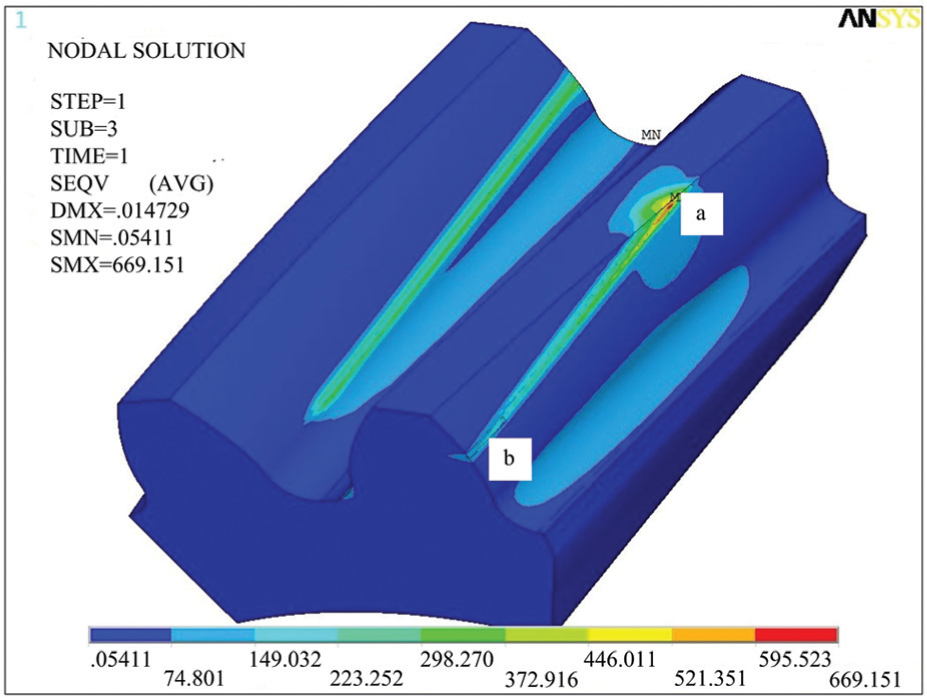
Distribution of contact stress and bending stress (MPa) of Case A with HSD for driving pinion.
TSLD peak amplitudes and percentage increment in grades 5 and 7 when compared with no deviation under Case A in tooth pair 1 and Case D in tooth pair 2.

TSLD: tooth surface load distribution.
The TSLD of tooth pair 1 in Case A and tooth pair 2 in Case D has a significant change through analysis based on Figures 11 and 12. Therefore, the worst load position model, Case E, the HSD on tooth pair 1 (or tooth pair 2), is the same as in Case A (or Case D) when these two pairs have HSD. Figure 14 shows the comparison of TSLD in Case A + D and Case E with grade 5 and grade 7. It is found that the incremental load in Case E is approximately equal to the superposition of Case A and Case D relative to the incremental load with no deviation, and the result of grade 7 is similar to grade 5 (Figure 14). Therefore, TSLD curves of Case E are in agreement with the superposition curves of Case A and Case D. The results indicate that the single HSD on TSLD shows “superposition” effect.

Comparison of TSLD in Case A + D and Case E with grades 5 and 7: (a) tooth pair 1 and (b) tooth pair 2.
Effect of the HSD on TRBS
Figures 15–17 show the effect of the HSD on the maximum TRBS on the tensile side of the pinion member, respectively. Some fundamental laws of the TRBS under different cases of the HSD are obtained through analysis based on Figures 15–17, as follows:
The maximum TRBS is varying under different cases of the HFD, thus exhibiting very complex contact behaviors as shown in Figures 15(a) and 16(b). It is found that Case A (or Case D) has a varying effect on the TRBS on tooth pair 1 (or on tooth pair 2). The changes in the TRBS in Case A are larger than no deviation when the axial distance is smaller than 8.57 mm. As the value of deviation increases, the maximum TRBS increases. TRBS decreases slowly with increasing the value of deviation when the axial distance is larger than 8.57 mm. Moreover, the changes in the TRBS are smaller than no deviation. Even if the TRBS attains high values under different accuracy grades, the corresponding TRBS keeps under tolerable amplitudes. It is also found from Figure 16(b) that the changes in the TRBS in Case D have the opposite variation laws. This can be explained qualitatively from the view of the TSLD, which has a significant on the TRBS.
Figures 15(b) and 16(a) indicate that the changes in TRBS on tooth pair 1 are almost parallel to each other and exert relatively small changes under different cases of the HSD. The results of TRBS are similar to the TSLD. That is because the distribution of TRBS is a response to the TSLD. The TRBS in positions 1 and 2 (Figure 16(b)) increases also revealing a linear correspondence with the deviation amplitude. Moreover, it is also found from Figure 17 that the effect of single HSD on the TRBS also shows “superimposed” effect.
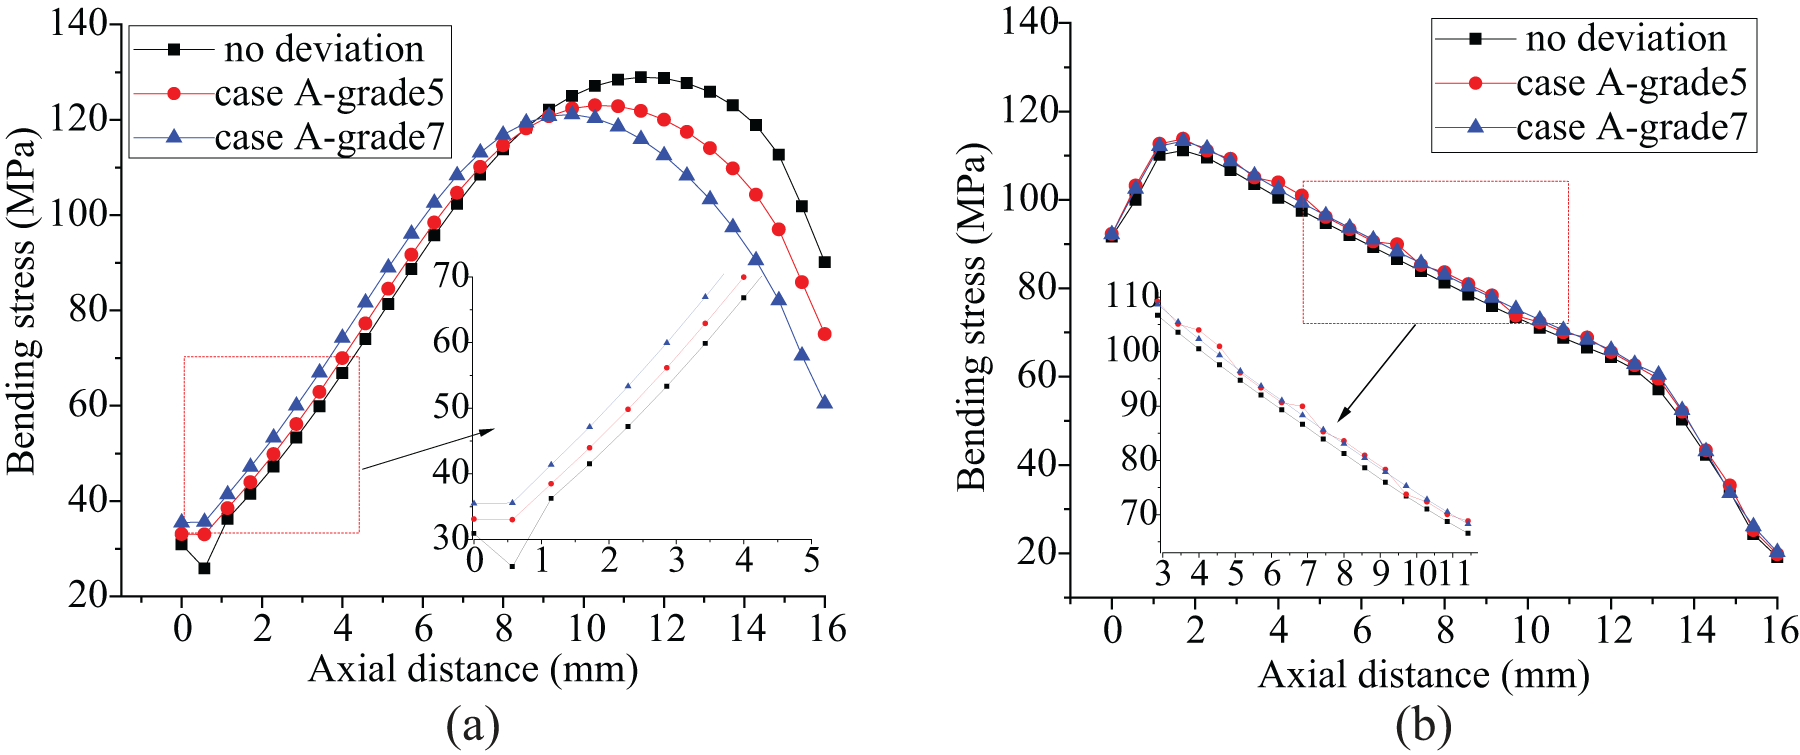
TRBS of Case A with HSD: (a) tooth pair 1 and (b) tooth pair 2.

TRBS of Case D with HSD: (a) tooth pair 1 and (b) tooth pair 2.

Comparison of TRBS in Case A, Case D, and Case E with grade 5: (a) tooth pair 1 and (b) tooth pair 2.
Effect of the HFD on TSLD and TRBS
Effect of different shapes of the HFD on TSLD
Figure 18 shows the effect of different shapes of the HFD on TSLD, respectively. Figure 19 shows the distribution of contact stress and bending stress of sine-wave deviation under grade 7 for the driving pinion. Some fundamental laws of the TSLD under different shapes of the HFD are obtained using a detailed analysis, as follows:
Figure 21 shows the TSLD distribution with two kinds of HFD. It is found from Figure 18(a) that the curve is even and the average TSLD is approximately 320 N/mm under the given different shapes of the HFD. While the TSLD curve in Figure 18(b) appears a large up-and-down wavy fluctuation, the maximum TSLD is approximately 1100 N/mm. That is because the elastic deformation fails to produce contact in the wave where TSLD falls to 0. Moreover, HFD leads to the sharp soar of local load when the tooth contact is in peak of wave, even exceeds the tolerable amplitudes. As the amplitude of deviation increases, the value of the maximum TSLD increases. The maximum contact stress is 746.99 MPa when the contact surface enters in mesh at special positions c, d, and e (Figure 19). It is much larger than that of other contact points, which results in localized stress concentration. As a consequence, TSLD is increased locally.
Taking two different shapes of HFD into account, the results indicate that the variation in TSLD on tooth pair 2 is more significant than on tooth pair 1 compared with Figure 18(a) and (b).
It is found that the maximum TSLD value approximately doubles when the grade changes from 5 to 7 (Table 4). The effect of a sine-wave deviation on TSLD is larger than saw-toothed wave deviation under the same accuracy grade. That is because the contact area and length are smaller in sine-wave deviation than saw-toothed wave at the meshing position. When the contact area and length are smaller values, the contact pressure becomes larger, resulting in the difference of the TSLD becoming larger.
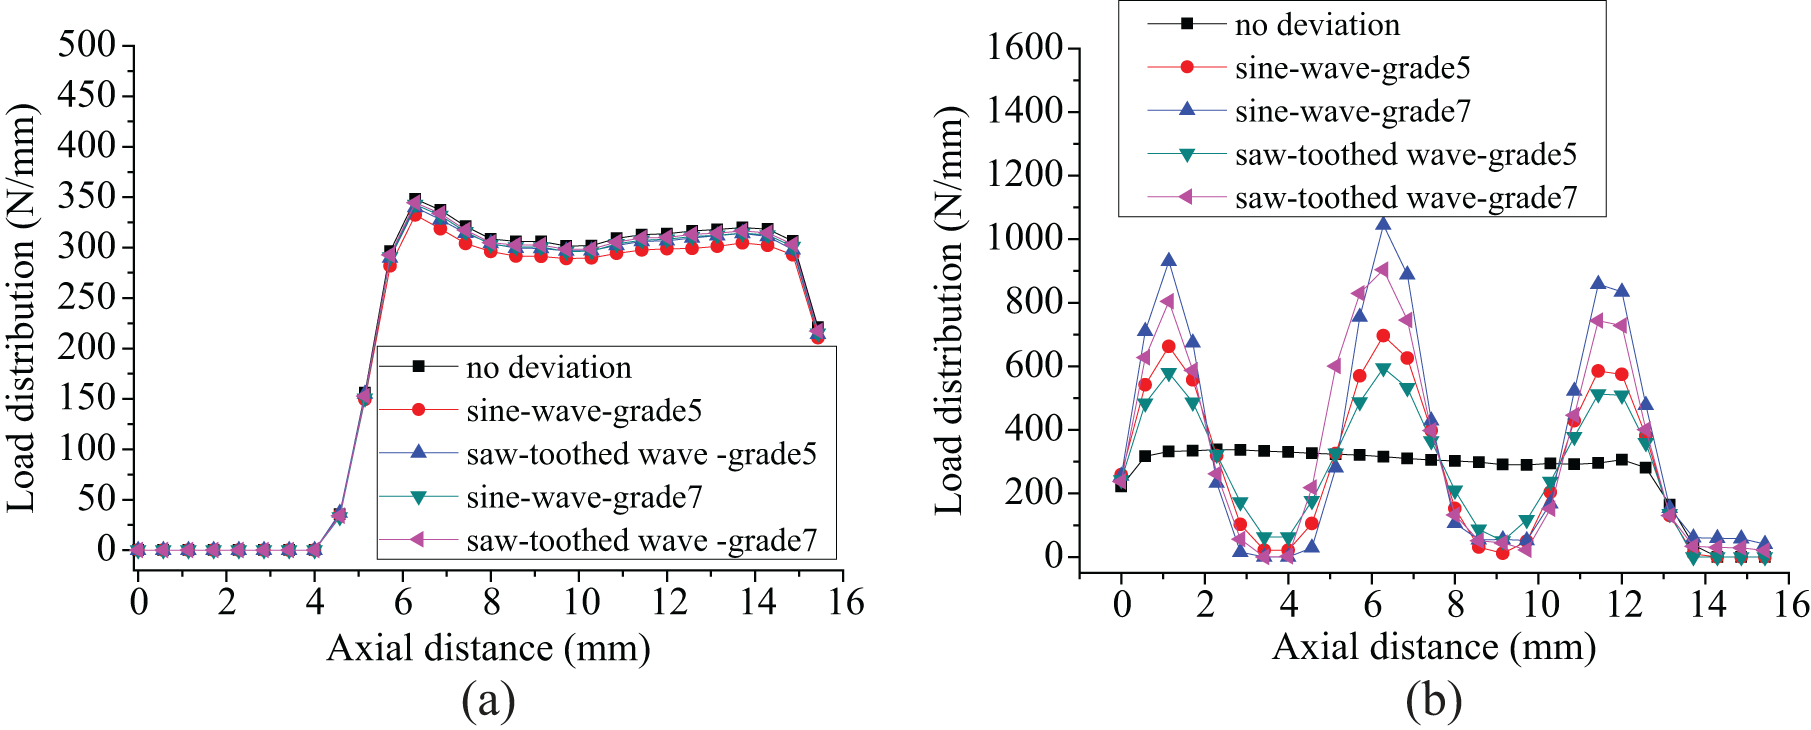
TSLD of cases with two kinds of HFD: (a) tooth pair 1 and (b) tooth pair 2.

Distribution of contact stress and bending stress (MPa) of sine-wave deviation for driving pinion.
TSLD peak amplitudes and percentage increment in grades 5 and 7 when compared with no deviation under two kinds of HFD.

TSLD: tooth surface load distribution.
Effect of different shapes of the HFD on TRBS
Figure 20 shows the TRBS distribution with two kinds of HFD. It is found from Figure 20 that the variation in TRBS on tooth pair 2 has a more important role than on tooth pair 1 when taking two different shapes of the HFD into account. This can be explained qualitatively from TSLD distribution in Figure 18(b), since TRBS distribution is a response to TSLD. Moreover, the effect of a sine-wave deviation on TRBS is larger than saw-toothed wave deviation. This is because the value of the tooth thickness becomes larger when the radius of curvature becomes smaller, 22 resulting in the TRBS becoming larger (Figure 20(b)). Thus, the TRBS is larger than saw-toothed wave deviation (Figure 20), since the tooth thickness of a sine-wave deviation is thinner than saw-toothed wave deviation. The maximum TRBS values under both the shape deviations are listed in Table 5. It is found that the effect of HFD on TRBS is less than TSLD under the same torque value compared with Table 4.

TRBS of cases with two kinds of HFD: (a) tooth pair 1 and (b) tooth pair 2.
TRBS peak amplitudes and percentage increment in grades 5 and 7 when compared with no deviation under two kinds of HFD.

TRBS: tooth root bending stress.
Effect of different periods of the HFD on TSLD
Figure 21 shows the contour lines of tooth contact pressure when HFD is at different periods. It is found that the variation in contact stress and contact area on tooth pair 2 rather than on tooth pair 1 is large when HFD is at different periods in Figure 21. The change amplitude of the maximum contact pressure increases as the contact area decreases. Moreover, the maximum contact pressure value nearly doubles when the grade changes from 5 to 7. It is also found that HFD at different periods exerts great effect on tooth contact area and length as shown in Figure 21(b)–(d) compared with Figure 21(e)–(g). The contact area and length decrease as the period of HFD increases.

Contour lines of tooth contact pressure: (a) no deviation; (b, e) 1T of grades 5 and 7; (c, f) 2T of grades 5 and 7; and (d, g) 3T of grades 5 and 7.Note: 1T/2T/3T is one/two/three periods of the HFD.
Figure 22 shows the TSLD distribution along the tooth longitudinal direction when HFD is at different periods. It is found that the TSLD curve is very non-uniform and exerts great fluctuation where the maximum TSLD follows the evolution of different periods of HFD.

Load distributions with different periods of helix form deviation: (a) tooth pair 1 and (b) tooth pair 2.
Table 6 presents the TSLD peak amplitude in relation to the corresponding theoretical value. These results are averaged values calculated at the peak position on tooth flanks. It can be seen from Table 6 that TSLD peak amplitudes gradually increase with increasing the period of HFD. Especially, the TSLD is increased sustain an average load of 1076.78 N/mm, equivalent to 244.35% of the mean peak value of 312.7 N/mm in the case of 3T under grade 7. Moreover, Table 6 also shows that the percentage increment of TSLD in grade 7 is twice as large as grade 5 under different periods of HFD. Therefore, increasing the quality of gear benefits gear load capacity analysis and improves the performance of power transmission systems.
TSLD peak amplitudes and percentage increment in grades 5 and 7 when compared with no deviation under different periods of HFD.

TSLD: tooth surface load distribution; HFD: helix form deviation.
Effect of different periods of the HFD on TRBS
Figure 23 shows the calculation results of TRBS along the tooth longitudinal direction. It is found that the variation in TRBS on tooth pair 2 rather than on tooth pair 1 is larger when HFD is at different periods in Figure 23, which has the identical variation rules with that shown in Figure 22(b). With the period of HFD increasing, the value of TRBS becomes smaller. This can also be explained from the change in TSLD and root radius of curvature. By comparing Tables 5 and 7, it is found that the percentage increment of TRBS (31.14%) is a much weaker effect of HFD on TRBS than TSLD (244.35%) in the case of 3T (grade 7). Moreover, the TRBS increase also appears proportional to the deviation amplitude of the tooth pair.

TRBS with different periods of HFD: (a) tooth pair 1 and (b) tooth pair 2.
TRBS peak amplitudes and percentage increment in grades 5 and 7 when compared with no deviation under different periods of HFD.

TRBS: tooth root bending stress; HFD: helix form deviation.
Conclusion
A design method for the helical gear model with HSD and HFD is proposed, where the equation of tooth surface with different HSD and HFD can be obtained directly via the given forming rack-cutter tool and the path for processing rack-cutter tool with deviation. Subsequently, a new approach for establishment of FEM with helix deviations and tooth contact analysis is conducted using the proposed methods.
HSD and HFD mainly affect the TSLD and TBRS along the tooth longitudinal direction, while have little impact between tooth pairs. Meanwhile, HSD leads to localized overloading and generates corresponding change in TRBS in the fillet zone. The maximum TSLD and TRBS increase nearly doubles when the grade changes from 5 to 7, where the deviation is doubled. It is found that the effects of single HSD on TSLD and TRBS have “superposition” effect compared with different cases of HSD.
TSLD and TBRS are affected by the different shapes, periods, and amplitudes of HFD. The result indicates that the effect of a sine-wave deviation on TSLD and TRBS is larger than saw-toothed wave deviation. With the period of HFD increasing, the value of TRBS/TSLD becomes smaller/larger.
The effect of HSD and HFD on TSLD is more sensitive than TRBS. Especially, TSLD sharply increases in the case of grade 7 and even beyond the allowable value of the material when there is HFD. While the TRBS remains within the allowable range. The result indicates that HSD and HFD mainly damage contact life and show little effect on the bending life.
Footnotes
Appendix 1
Academic Editor: Dr Filippo Berto
Declaration of conflicting interests
The authors declare that there is no conflict of interest.
Funding
The authors would like to thank the Natural Science Foundation of China (No. 51175392) and The National High Technology Research and Development Program of China (No. 2013AA040201) for the support given to this research.