
Abstract
Inlet chambers (IC) are the typical upstream component of centrifugal compressors, and inlet guide vanes in the IC have a great impact on its internal flow and aerodynamic loss, which will significantly influence the performance of the downstream compressor stages. In this paper, an experimental study was carried out on the flow characteristics inside a radial IC of an industrial centrifugal compressor, including five testing sections and 968 measuring points for two schemes with and without guide vanes. Detailed distributions of flow parameters on each section were obtained as well as the overall performance of the radial IC, and the causes of the flow loss inside the IC and the non-uniformity of flow parameters at the outlet section were investigated. Besides, numerical simulations were performed to further analyze the flow characteristics inside the radial IC. The experimental and numerical results indicate that, in the scheme without guide vanes, sudden expansions in the spiral channel and flow separations in the annular convergence channel are the major sources of flow loss and distortions generated in the radial IC; while in the scheme with guide vanes, the flow impacts, separations and wakes caused by the inappropriate design of guide vanes are the main reasons for the flow loss of the IC itself and the uneven flow distributions at the IC outlet.
Keywords
Introduction
In the aerospace, chemical, power, petroleum and energy industries, the raw materials, intermediate products, and final products are usually gases. In order to meet the requirements of various processes and ensure the continuity of industrial production, the compressors are employed to pressurize and transport the gases by converting mechanical energy into fluid energy.1,2 Centrifugal compressors, as one of the most widely used fluid machinery, are also a high-energy-consuming equipment, which are typically composed of an intake system (i.e. inlet chamber and guide vanes), rotors and stators (i.e. impellers, diffusers and return channels), and an exhaust volute.3,4 To reduce the energy consumption, previous improvements of centrifugal compressors are mainly achieved by the optimizations of the rotors and stators,5,6 ignoring the effects of upstream inlet chamber (IC) and downstream volute. With the gradual deepening of research, the performances of impellers and diffusers are increased closer to the aerodynamic limit. 7 Therefore, the improvements of inlet chambers and volutes are attracting more and more attention of the researchers. The research object of this article is a typical radial IC from an industrial centrifugal compressor, which transports the working fluid from the piping system or the atmosphere to the inlet of the impeller. Compared to axial inlet, the radial IC will introduce extra flow loss and distortion at the impeller inlet, which will negatively affect the performance of the compressor.8,9 However, due to the non-axisymmetric geometry of radial IC, a complex three-dimensional internal flow is formed, making the flow measurements more difficult and time-consuming; while without detailed experimental data, the reliability of numerical simulations on such a complex geometry cannot be guaranteed. 10
Since the 1990s, benefiting from the development of aerodynamic probes and numerical methods, 11 the cost of experimental and numerical research on the flow field inside complex geometries have been greatly reduced, which promoted a thorough analysis of radial IC. Flathers et al. 12 and Flathers and Bache 13 used three-hole probes to experimentally obtain the flow field at the IC outlet of an industrial pipeline compressor. The flow angles, static pressures and total pressures at 50 sampling points were measured, and the distribution of total pressure loss coefficients was given. Koch et al. 14 conducted an experimental study on an IC with different inlet pipes, and found that guide vanes arranged in the IC increased flow losses but benefited to overcoming flow distortions at the outlet section. Giachi and Taddei, 15 Michelassi and Giachi, 16 Michelassi et al., 17 and Pazzi and Michelassi 18 used a combination of experimental and numerical methods to study an inlet chamber of a centrifugal compressor with the model structure scaled at 1:2.5. According to the measurement and calculation of flow angle, Mach number and loss coefficient at the IC outlet, the distortion of flow parameters caused by the complex inlet geometry was revealed. Han et al.19,20 made a detailed measurement for the internal flow field of a radial IC from an industrial centrifugal compressor using spherical five-hole probes. A total number of over 900 measuring points at the inlet and outlet of IC, the outlet of intake channel and the outlet of spiral channel were selected for the experiment. It revealed that the flow from the inlet pipe was considered as uniform incoming flow, and began to accelerate when passing through the intake channel. After entering the spiral channel, the fluid flowing towards the bottom of the chamber was blocked by the splitter ribs, and generated two large-scale vortices with opposite rotation directions, resulting in significant decreases of Mach number and total pressure.
With the rapid progress of computer technology and CFD method, numerical improvements and multi-parameter optimizations were conducted for radial ICs. Kim, 21 Kim et al., 22 and Kim and Koch 23 found that the introduction of converging ribs inside the spiral channel could suppress the vortex at the bottom and enhance the uniformity of flow field at the outlet of the IC. This design improved the efficiency of the compressor stage and extended the range of its operating conditions. Saladino and Bielecki 24 focused on 13 independent geometric parameters that might have great impact on the performance of the IC, especially the parameters associated with the flow loss, and proposed a summation function as the objective function for the performance optimization of the IC. Yagi et al. 25 analyzed the distribution of the IC flow loss and the outlet flow distortion with numerical simulations, and found three important sections that greatly impacted the IC efficiency and the outlet flow. These three cross-sectional areas were selected as the variable parameters to optimize the geometric structure of the radial IC. Kozhukhov et al. 26 numerically studied the radial chambers with five different geometries for the same centrifugal compressor. The local loss coefficient distributions at the outlet section were compared in detail, and the geometric structures related to the flow characteristics inside different chambers were analyzed based on the numerical results. Sezal et al. 27 found that, compared to the traditional axisymmetric guide vanes, the non-axisymmetric adjustable guide vanes in the radial IC could better match the incoming flow angle and reduce around 40% of the flow loss. Besides the performance of radial IC itself, its influences on the downstream components have also been analyzed. Tan et al.28,29 numerically compared the effects of axial inlet and radial IC on the performances of a centrifugal compressor under different conditions. It indicated that, over the entire operating range, the radial IC led to an average decrease of 2.5% and 1% in the compressor efficiency and total pressure ratio, respectively, which also have negative impact on the regulation performance of inlet guide vanes. Xinqian et al. 30 used comb probes to measure the distortions of total temperature and total pressure at the impeller inlet, and carried out further studies to investigate their effects on the compressor performance. Han et al.31–33 developed an automatic probe system for large-scale measurements of the IC’s internal flow, the accuracy and stability of which were analyzed to provide guidance for subsequent numerical simulation and improvement design. Then, two radial inlet stages from different industrial centrifugal compressors were analyzed, focusing on the effects of two major factors, that is, the internal flow loss and the outlet flow distortion of radial ICs, on the performances of its downstream components.
Based on the research status of radial ICs for centrifugal compressors mentioned above, it can be found that most previous research was conducted with numerical simulation, and the few experimental studies mainly focused on the flow conditions at the outlet of radial IC, lacking detailed measurement data on its internal flow. It is of great significance to perform a systematic experimental study on the detailed flow condition inside radial IC to figure out the causes and locations of the flow loss and distortions, which can also provide validation data for the corresponding numerical study. Detailed flow field measurements assisted by numerical simulations are the most effective and reliable method to thoroughly investigate the flow patterns inside radial IC and explore how it affects the downstream centrifugal compressor. Therefore, in this paper, an experimental research as well as the corresponding numerical simulations are carried out on the detailed internal flow field of a radial IC, and a systematic analysis is performed on the influences of relevant structures including the inlet guide vanes, expecting to develop an in-depth understanding of its flow mechanism and provide reference for the subsequent research on the design and improvement of radial ICs.
Experimental facility and procedure
Experimental facility
The research object of this paper is a typical radial IC used for a pipeline centrifugal compressor. It adopts a casting structure, and the inner walls are polished and sprayed with surface materials. Compared to traditional welding structures, this kind of radial IC achieves a better geometry with smooth surfaces and favorable connections, which could bring down its flow loss and enhance the aerodynamic performance to a large extent. Figure 1 shows the detailed structure of the radial IC and the experimental platform for the flow measurements. It can be found that the radial IC is composed of an intake channel, a spiral channel and an annular convergence channel. The cross-sectional area in each channel gradually decreases along the flow direction, and a convergent structure along the circumferential direction is employed in the spiral channel to reduce the large-scale bottom vortices. Meanwhile, in the scheme with guide vanes, 8 inlet guide vanes are evenly distributed in the convergence channel at the 90° turning.

Experimental platform: (a) structure of the radial IC and layout of the test rig and (b) experimental site.
According to Figure 1, the experiment adopts an open-loop test rig, which mainly consists of an inlet pipe, the radial IC and an outlet pipe. In order to provide a uniform inlet flow for the measurements, a bell mouth and honeycomb screen are arranged at the entrance of the platform, and connected with the radial IC through a straight inlet pipe with the length 6 times of its diameter. At the exit of the test rig, a centrifugal blower is adopted as the driving force to suck air from the radial IC through a straight outlet pipe with the length 4 times of its diameter, which avoids the rotating influence of the blower on the IC’s internal flow. During the experiment, the rotational speed of the blower was set to 1700 r/min to ensure that the averaged inlet velocity was kept at 20 m/s (i.e. the inlet Mach number was 0.058), which matched the actual operating condition of the radial IC in the industrial product.
In order to obtain detailed experimental data of the flow field inside the radial IC with and without guide vanes, 71 sampling holes and 968 measuring points are arranged in the test facility. As shown in Figure 2, they are distributed on five testing sections: (a) Section inlet is the entrance of the radial IC; (b) Section P1 is the interface of the intake channel and the spiral channel; (c) Section P2 is the internal section of the spiral channel; (d) Section P3 is the exit of the spiral channel and entrance of the annular convergence channel; (e) Section outlet is the outlet of the IC. In order to optimize the measurement scheme, the internal sections P2 and P3 only locate on one side of the symmetry plane to reduce the testing workload and shorten the experimental period. Detailed distributions of the sampling holes and mearing points on each section are listed in Table 1. In each sampling hole, the measuring points were uniformly distributed with a constant interval, and the flow measurement was successively performed at each point twice. Finally, the averaged data of the round-trip measurements was employed as the measuring results to ensure the repeatability and accuracy of the experimental data.
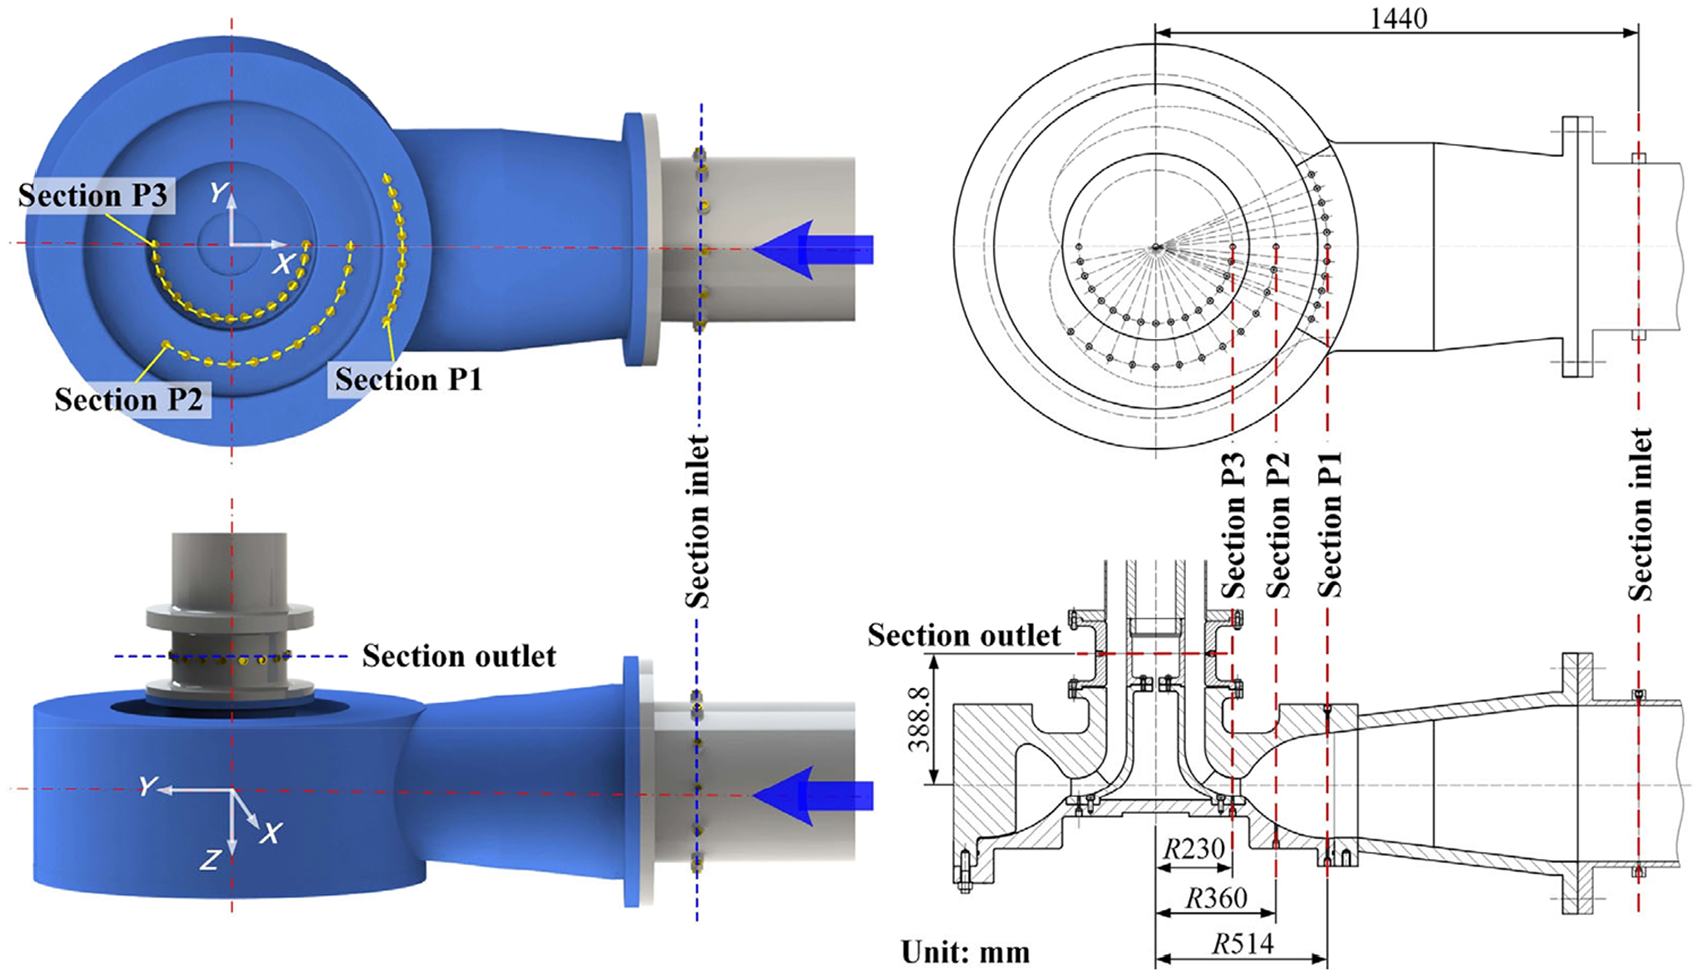
Testing sections and sampling holes in the radial IC.
Sampling holes and measuring points on each section.

Measuring system
Considering the great number of sampling holes and measuring points in the experimental study, a self-developed automatic five-hole probe system 33 was employed to reduce the workload of the experiment and ensure the accuracy and efficiency of the flow measurements. As shown in Figure 3, the hardware of this auto-measuring system consists of three parts, that is, a motion control module, a data acquisition module and an automatic coordinate frame. When measuring flow field in the radial IC, the five-hole probe is installed in the automatic coordinate frame, which realizes the linear and rotary motions of the probe to change the axial position in each sampling hole and adjust the angle of the probe head. The pressures measured by the five holes on the probe head are acquired and transported by the data acquisition module. Then, with the aid of the corresponding data processing program and the probe calibration database, the local flow parameters are calculated, including the velocity, Mach number, static pressure, total pressure, and flow angles. If the measured flow angle is out of the range required by the measuring system, the motion control module will command the coordinate frame to rotate the probe to a proper range; otherwise, a linear movement will be executed to move the probe to the next point. Details of the measuring instruments used in the flow measurements are listed in Table 2.
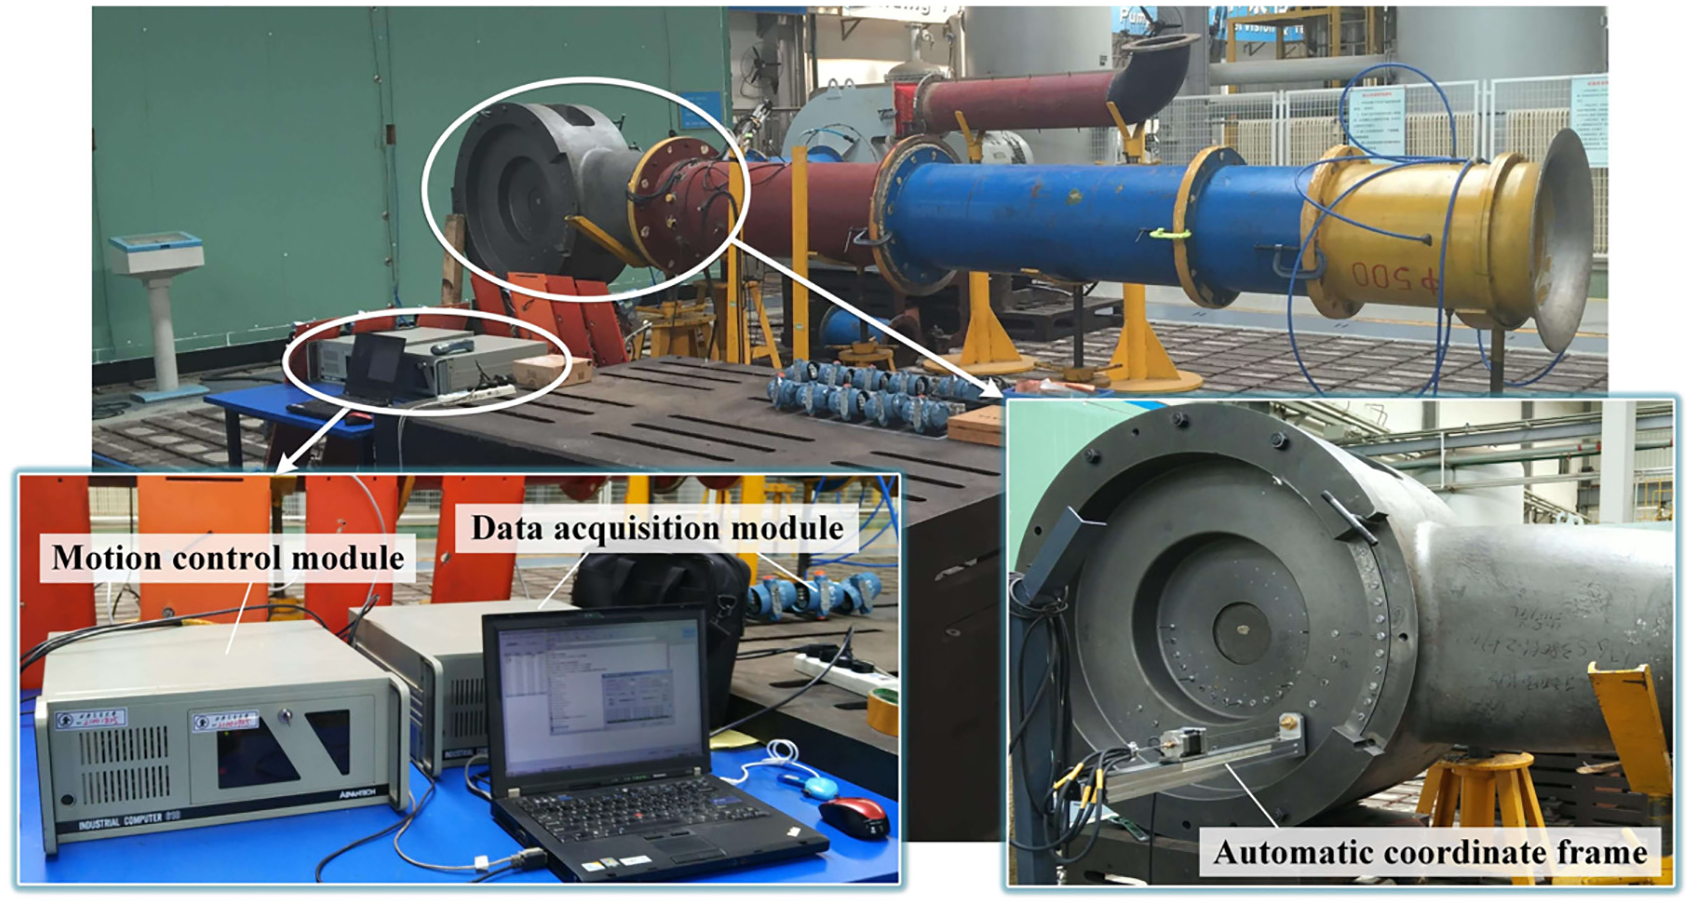
Measuring equipment of five-hole probe system.
Major instruments used in flow field measurements.

The measuring system used in the present study has been calibrated in a known flow field to compare the testing results with the actual flow parameters. The systematic error


where x represents the flow parameter (i.e. the pitch angle, yaw angle, velocity magnitude, static pressure, or total pressure), and
Numerical method
CFD code
Numerical simulation has also been carried out on the internal flow of radial IC to make a comparison with the flow measurements. Considering that it is a static experiment without the influence of downstream impeller, the continuity and momentum conservation equations are adopted as the governing equations for the steady and incompressible flow inside the radial IC, which can be expressed as follows:


where
The flow solver EURANUS from NUMECA software is used to solve the three-dimensional Reynolds-averaged Navier-Stokes equations. It applies a center-controlled volume scheme for the spatial discretization and a four-stage Runge-Kutta scheme for the temporal discretization. Besides, local time stepping and implicit residual smoothing technologies are adopted together with a multi-grid strategy to accelerate the convergence. In order to make the equation system closed, the Shear Stress Transport (SST) turbulence model is employed in the present research. As one of the most utilized two-equation low-Reynolds models, it has advantages in predicting flow separations under adverse pressure gradients, which is quite suitable for the flow simulations of radial IC, especially for the flow separations caused by the guide vanes and the 90° turning.
The calculation settings for the CFD cases of the radial IC with and without guide vanes were the same. The working fluid was treated as an ideal gas, and all the boundary conditions were imposed from the average values of the experimental data. For the inlet boundary, the measured total pressure, total temperature and flow angles at entrance of the test rig were provided. The mass flow rate calculated from the measured velocity and air density was set as the outlet boundary condition together with the measured pressure at the exit. All the solid walls were treated as hydraulically smooth surfaces with non-slip and adiabatic boundaries.
Computational grids
The computational model is also composed of the radial IC, inlet and outlet pipes as well as the corresponding guide vanes, which is consistent with the experimental facility. As shown in Figure 4, structured hexahedron grids are generated using NUMECA IGG/AutoGrid for all the components with particular refinements on the grids close to the solid walls.
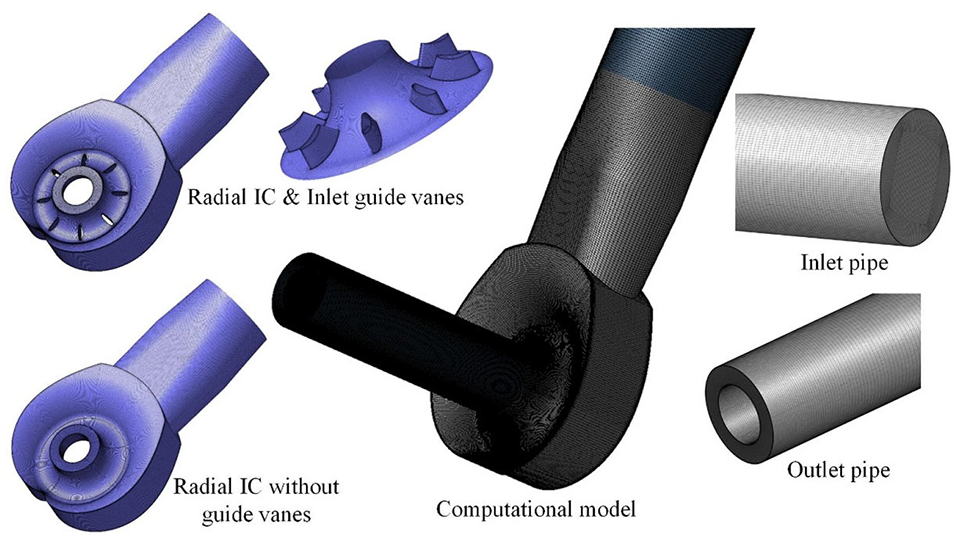
Computational grids for different components.
Grid convergency studies have been carried out to verify the mesh sensitivity of the numerical results. Seven schemes of meshes were generated for the computational model with grid numbers varying from 1.83 × 10⁶ to 1.47 × 10⁷, and the results obtained with different grid resolutions were compared, including the flow parameters on the main sections and the performance of the radial IC. Finally, the mesh scheme with 7700253 elements has been proved to have sufficient accuracy for the numerical analysis of the IC’s internal flow, and the maximum uncertainty caused by this computational grid is <0.025%. Besides, the numerical method and computational results in the present study have been validated against the experimental data. For the radial IC, the comparisons of detailed flow distributions made in Section 4 indicate that the predicted flow characteristics are consistent with the measurements; while for the compressor performance, the comparison with the model test from previous literature28,32 has revealed that the numerical deviations are <3% under most operating conditions. It further proves the reliability of the CFD method and numerical results in this paper.
Results and discussions
Experimental results
Performance analysis
In order to minimize the influence of environmental variables on the experimental results, dimensionless pressure coefficients are introduced as well as Mach numbers to analyze the pressure and velocity distributions in the radial IC. As expressed in equation (5), the dimensionless total pressure coefficient


where
According to the flow measurements, the total pressure loss coefficient between the major sections are shown in Table 3.
Flow loss between different sections in the measurements.

It can be found that, in each scheme of the radial IC (i.e. with or without guide vanes), nearly 40% of the total flow loss is generated in the spiral channel, and the annular convergence channel accounts for more than 50% flow loss of the entire IC. Therefore, the spiral and convergence channels are the major sources of flow loss in the radial IC, which are the key parts to be optimized in the improvement study. The results also indicate that, when there is no guide vane, the total pressure loss coefficient
Flow field on Section inlet
Figure 5 shows the measurement results at the inlet of the radial IC with guide vanes. It can be found that the dimensionless total pressure and Mach number on Section inlet obtained by flow measurements are evenly distributed in the circumferential direction, which are axisymmetric with respect to the center of the inlet pipe. The mainstream in the central area of this section appears a higher Mach number and total pressure, and the flow velocity and total pressure at large-radius locations are affected by the boundary layers of the solid walls. It reveals that the fluid flows into the bell mouth, passes through the honeycomb screen and the 6D inlet pipe, and finally becomes a fully developed flow at the inlet of the radial IC. The flow parameters are uniformly distributed in the circumferential direction on this section with little effect of the downstream IC. Therefore, the measured flow field on Section inlet of the Radial IC without guide vanes are almost the same as the results shown in Figure 5.

Experimental results on Section inlet: (a) Mach number and (b) total pressure.
Flow field on Section P1
Section P1 is the exit of the intake channel in the radial IC, which also connects to the entrance of the spiral channel. The fluid from the inlet section accelerates in the intake channel due to the decrease of the cross-sectional area, and suddenly expands at the entrance of the spiral channel. Therefore, according to the measurement results in Figure 6, the airflow with higher Mach number exists on the upper and lower sides of Section P1 owing to the structure convergence in this direction, and the low-speed streams appear on the left and right sides near the walls. The distributions of dimensionless total pressures in Figure 7 indicate that the total pressure is higher in the central part of this section, while it is low at the periphery. From the experimental results of the two schemes, the traces of sudden expansion vortices can be observed at the four corners of Section P1, and the corresponding loss coefficients of the intake channel in the two schemes are almost the same as listed in Table 3. According to the comparisons of Mach numbers and total pressures in different experimental schemes, it can be summarized that, since Section P1 is the interface where the convergent flow from the intake channel begins to expand into the spiral channel, the velocity here is relatively low, the total pressure drop is small, and the flow condition is almost unaffected by the downstream guide vanes as well.

Experimental results of Mach number on Section P1: (a) without guide vanes and (b) with guide vanes.

Experimental results of total pressure on Section P1: (a) without guide vanes and (b) with guide vanes.
Flow field on Section P2
Section P2 is the internal section of the spiral channel. When the airflow from the intake channel enters the spiral channel, it is divided into two main parts. One part of the airflow directly turns 90° in the radial direction on the inlet side, and enters the annular convergence channel in the axial direction with high velocity and high total pressure. The other part of the fluid flows along the circumferential direction to fill in the whole spiral channel, and gradually turns into the annular convergence channel with low total pressure and low speed, which will lead to a higher flow loss in the spiral channel. The experimental results of Mach number and total pressure on Section P2 are shown in Figures 8 and 9, respectively.

Experimental results of Mach number on Section P2: (a) without guide vanes and (b) with guide vanes.

Experimental results of total pressure on Section P2: (a) without guide vanes and (b) with guide vanes.
It can be seen from Figure 8 that there is a high Mach number region on the right side of Section P2, which is close to the inlet side of the radial IC; while a low Mach number region appears in the middle of the left side. The distributions of high and low total pressures in Figure 9 are consistent with that of the Mach number. It reveals that a vortex with low Mach number and low total pressure has been formed on left side of this section. Considering the symmetry of the radial IC, there are two vortices on both sides of the spiral channel, which are mainly caused by the sudden expansion of the airflow from the intake channel into the spiral channel.
Flow field on Section P3
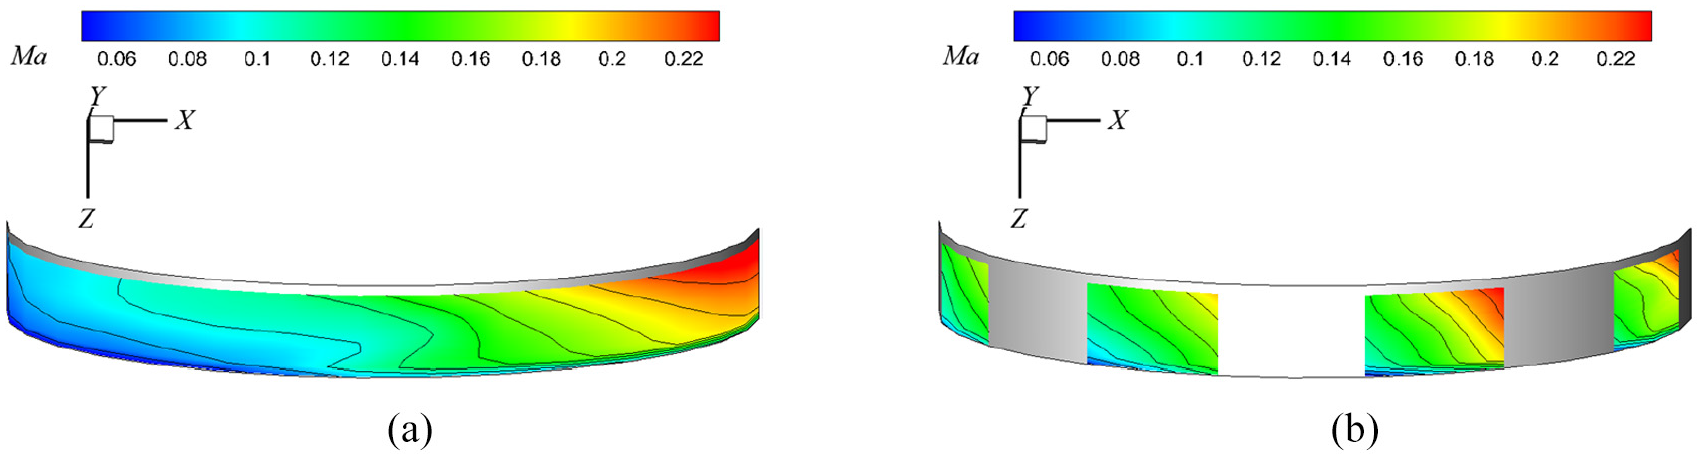
Since Section P3 is in the annular convergent channel, the flow field has been divided by the guide vanes into four regions, which can be obviously observed in the figures. According to the flow measurements, the vortex on Section P2 has developed and extend to Section P3, especially in the scheme without guide vanes. Compared to the Mach number distribution in Figure 10(a), the inlet guide vanes in Figure 10(b) make the velocity gradient of the flow field in each region increased, but the difference of velocity values in different regions becomes smaller. It reveals that the uniformity of velocity distribution in the circumferential direction is improved by the guide vanes. Figure 11 indicates that the flow fields in the two schemes have a similar total pressure distribution, but the inlet guide vanes induce a region with lower pressures in the blade passage on the right side. This is mainly because that the high-speed fluid on the inlet side impacts on the leading edge of the guide vane. Due to the flow impacts and separations caused by the guide vanes, the total pressure drop can be clearly seen in Figure 11(b), especially on the right side of this section.

Experimental results of Mach number on Section P3: (a) without guide vanes and (b) with guide vanes.

Experimental results of total pressure on Section P3: (a) without guide vanes and (b) with guide vanes.
Flow field on Section outlet
Section outlet is the exit of the radial IC, which is also the inlet of the downstream impeller in a centrifugal compressor. Figures 12 and 13 show the measured distributions of Mach number, velocity vector and total pressure on this section, where the dashed line represents the direction of the intake channel. Overall, in the two schemes of the radial IC, the Mach number on the right side is higher than that of the left side, and the speed is greater at the inner diameter than that at the outer diameter. However, there is an obvious flow separation on the side close to the intake channel, which is caused by the high-speed fluid flowing through the 90° turning. Compared to the results without guide vanes, although the influence of the flow separation close to the inlet becomes smaller in Figures 12(b) and 13(b), the Mach number is higher in the scheme with guide vanes, and the influences of flow separations and wakes induced by the guide vanes are greater. It further increases the unevenness of flow distortions on this section and the total pressure loss in the annular convergence channel.

Experimental results of Mach number and velocity vector on Section outlet: (a) without guide vanes and (b) with guide vanes.

Experimental results of total pressure on Section outlet: (a) without guide vanes and (b) with guide vanes.
Numerical results
Flow field on Section inlet
According to the numerical simulation, the flow field on Section inlet is shown in Figure 14, which agrees well with the experimental results. Compared to the flow field measured in the experiment, the numerical result of the mainstream area is larger with a higher velocity gradient close to the wall and a better symmetry of the flow parameter distributions. This is because that the influence of boundary layer on the main flow is smaller in the numerical simulation due to the smooth wall assumption, and the slight asymmetry of the experimental result in Figure 5 is caused by the processing deviations. Therefore, the numerical results perform well in capturing the major characteristics of the flow field and details of key parts, ensuring an acceptable accuracy for the numerical flow analysis.

Numerical results on Section inlet: (a) Mach number and (b) total pressure.
Flow field on Section P1
The numerical results on Section P1 are shown in Figures 15 and 16. It can be found that the Mach number and total pressure distributions of the numerical simulations on this section are consistent with the experimental results in Figures 6 and 7. In numerical results, the convergence flow on the upper and lower sides of this section is more obvious, and the total pressures in the mainstream region are higher. Since the smooth transition of the intake channel and spiral channel is simplified in the numerical modeling, the small separations at the four corners of Section P1 in the CFD results are more obvious with the Mach number and total pressure much lower than that of the experimental results. The numerical results also indicate that the flow loss

Numerical results of Mach number on Section P1: (a) without guide vanes and (b) with guide vanes.

Numerical results of total pressure on Section P1: (a) without guide vanes and (b) with guide vanes.
Flow field on Section P2
In the numerical results of Section P2 in Figures 17 and 18, the flow field also consists of two regions: a high Mach number and high total pressure region on the side close to the intake channel, and a low Mach number and low total pressure region on the side away from the intake channel. It is consistent with the flow distribution of the experimental results in Figures 8 and 9. The Mach number and total pressure of the numerical results are slightly higher than the experimental results, and the gradients of velocity and pressure are also larger. From the numerical results, it can be clearly observed that the low-velocity and low-pressure region on Section P2 is caused by the mixing of two vortices with opposite directions, the shape of which is not obvious in the experimental results. The comparison of the two IC schemes indicates that, whether guide vanes are arranged in the downstream, there is no significant effect on the distribution of flow parameters on this section. In the guide vane scheme, the non-uniformity of the Mach number distribution is improved, which may be related to the blocking effect of the guide vanes.

Numerical results of Mach number on Section P2: (a) without guide vanes and (b) with guide vanes.

Numerical results of total pressure on Section P2: (a) without guides and (b) with guide vanes.
Flow field on Section P3
Mach number and total pressure distributions on Section P3 are shown in Figures 19 and 20. The numerical results on this section also agree with the experimental results. It can be found that the vortex on the right side of Section P3 caused by the existence of guide vanes matches well with the experimental data. Compared to the results in Figures 10 and 11, the distributions of flow parameters in the numerical results are almost the same with the experiment, including the overall trends and the detailed flow characteristics. In the results with guide vanes, a more obvious vortex can be observed in the blade passage, which is consistent with the experimental result. It shows that when the airflow passes through the guide vanes, extra flow impacts and separations occur in the radial IC, which will adversely affect the flow condition in the downstream.
Numerical results of Mach number on Section P3: (a) without guide vanes and (b) with guide vanes.

Numerical results of total pressure on Section P3: (a) without guide vanes and (b) with guide vanes.
Flow field on Section outlet
Figures 21 and 22 show the numerical results of Mach numbers, velocity vectors and total pressures on Section outlet. It can be found that the numerical simulation also captures a pair of vortices with opposite rotational directions on the left side of this section, and the distributions of velocity and total pressure agree with that of the experimental data. Comparing the results of the non-guide-vane scheme, the low-pressure and low-speed separation area on the right side of this section is much smaller in the numerical results than that shown in Figures 12 and 13. According to the results of the scheme with guide vanes, the flow separation caused by the 90° turn in the measurement is replaced by a pair of distinct vortices in the numerical results. According to the analysis, the main reason for the disappearance of the separation and the generation of the vortices is the large thickness of the guide vane at the entrance of the annular convergence channel. When the high-speed airflow turns 90° into the axial direction, it encounters the blunt leading edge of the guide vane and slows down, which weakens the secondary flow separation caused by the turn. It further proves that the flow impacts, separations and wakes induced by the guide vanes bring in more vortices, distortions and flow loss to the downstream component.

Numerical results of Mach number and velocity vector on Section outlet: (a) without guide vanes and (b) with guide vanes.

Numerical results of total pressure on Section outlet: (a) without guide vanes and (b) with guide vanes.
Conclusion
Detailed flow measurements assisted with numerical simulations are the most effective and reliable method to thoroughly understand the flow characteristics inside the radial IC. Meanwhile, it also provides references for the research on the design and improvement of radial ICs. In this paper, an experimental research and corresponding numerical simulations have been carried out on the flow characteristics of the radial IC from an industrial centrifugal compressor, and a systematic analysis has been performed on the influences of related structures including the inlet guide vanes. Major conclusions are summarized as follows:
The flow field is evenly distributed at the inlet of the radial IC, and flow loss in the spiral channel is small. The unevenness and flow loss are mainly caused by the flow separations and vortices in the spiral channel and the annular convergence channel, which account for around 40% and 50% flow loss of the entire IC, respectively. Finally, the flow field at the IC’s outlet presents a higher pressure and higher velocity on the side close to the intake channel, leading to an uneven distribution of flow parameters in the circumferential direction.
Due to the inappropriate thickness of the guide vanes, the flow impacts and wakes in the guide-vane scheme significantly increase the aerodynamic loss in the radial IC. Compared to the non-guide-vane scheme, the inlet guide vanes almost doubled the flow loss of this particular IC. It also brings in extra vortices and distortions that are fused with the existed vortices. This further increases the flow unevenness at the outlet of radial IC, which will adversely affect the downstream component.
It can be concluded that, in the scheme without guide vanes, sudden expansions in the spiral channel and flow separations in the annular convergence channel are the major sources of flow loss and distortions in the radial IC; while in the scheme with guide vanes, the flow impacts, separations and wakes caused by the inappropriate design of guide vanes are the main reasons for the flow loss of the IC itself and the uneven flow distributions at the IC outlet.
Footnotes
Handling Editor: James Baldwin
Author contributions
F. Han and Z. Wang conducted the experiments/simulation and wrote the original draft. F. Han analyzed the results. Y. Mao provided technological comments and suggestions on the research. J. Tan gave industrial suggestions and carried on project administration. W. Li carried on funding acquisition. All authors have read and agreed to the published version.
Declaration of conflicting interests
The author(s) declared no potential conflicts of interest with respect to the research, authorship, and/or publication of this article.
Funding
The author(s) disclosed receipt of the following financial support for the research, authorship, and/or publication of this article: This work was supported by National Natural Science Foundation of China (52006022 and 51906026), China Postdoctoral Science Foundation (2020M670726 and 2020M680928), Fundamental Research Funds for the Central Universities (3132019368 and 3132020186), National Key Research and Development Program of China (2018YFC0309003), Natural Science Foundation of Liaoning Province (2020-BS-067) and 111 Project (B18009).