
Abstract
At present, in the aspect of numerical simulation of cycloid pump, most studies focused on CFD (Computational Fluid Dynamics) in analyzing the pump performance under different service conditions (such as speed, temperature, etc.). The characteristics of the pump under FSI (Fluid Solid Interaction) have not been considered yet. By means of the dynamic mesh technique in the rotating domain, the fluid structure coupling interface is set up on a cycloidal pump model building in COMSOL. The simulation results obtained by applying CFD and FSI are improved by experimental verification. The results show that: (1) the average flow rate of FSI simulation is closer to the test results, and the mean values of CFD and FSI pressure are closer to the actual outlet boundary settings; (2) by comparing the velocity and pressure of rotation region of CFD and FSI at different temperatures, it is concluded that the pressure CFD calculated in the region is more than FSI, and the velocity CFD calculated is less than FSI; (3) by comparing the pressure distribution at some contact point of the fluid structure coupling interface, it is concluded that the fluctuation value of the pressure of CFD with time is greater than that of FSI. Through the comparison, it is found that the coupling has a great influence on the calculation results. The FSI analysis of the pump makes the analysis results more real and more conducive to the analysis of the flow field and rotor dynamics characteristics of the pump.
Introduction
An oil pump is an essential part in a hydraulic system. Due to its small fluctuation, good performance, high accuracy, compactness and simplicity, Cycloid pumps is widely used in the automotive industry for fuel lift, lubrication and transmission systems. In geometric theory, Saegusa et al. 1 introduced the formation of rotor profile of hypocycloid oil pump. Fabiani et al. 2 analyzed the geometric kinematics of cycloidal rotor pump, calculated the volume between teeth quantitatively by integral-derivative approach and the new derivative-integral approach. Liu et al. 3 deduced the equation of cycloid tooth profile by inner rolling method and carried out numerical calculation. Hwang and Hsieh 4 put forward a mathematical model to improve pump efficiency and derived dimensionless rootless equation. On the basis of double cycloid, Choi et al. 5 inserted arc curve between inner cycloid and outer cycloid to form the equation of rotor tooth profile with no upper limit of eccentricity, thus avoiding undercutting. Jung et al. 6 designed the rotor profile formed by multi-section curve (ellipse-involute-ellipse), which eliminates oil trapping. In terms of model design, Frosina et al. 7 used one-dimensional commercial program to build pump model and validate it with experimental data. Gamez-Montero et al. 8 and Castilla et al. 9 used the contact point viscosity model to simulate the solid-solid contact between gears. In the aspect of numerical simulation, Rundo 10 introduced the analytical method of the 0–3D model used in the analysis of oil pump. Natchimuthu et al. 11 uses FLUENT to simulate the fluid dynamics of the oil pump. Frosina et al. 12 uses PumpLinx to simulate and analyze the oil pump of a motorcycle engine made by Aprilia Company. Suresh Kumar and Manonmani13,14 considered various operating conditions of the pump. Zhang et al. 15 study the effects of the inlet pressure, tip clearance, porting and the metering groove geometry on pump flow performance and pressure ripples through a large number of CFD simulations. After model validation, Altare and Rundo 16 changed several geometric characteristics to analyzed the influence of the pump performance. Frosina et al. 17 mainly studied the effect of cavitation on the pressure and flow rate of oil pump. Gamez-Montero et al. 8 and Ruvalcaba and Hu 18 studied the effect of leakage caused by clearance on pump performance. For the study of fluid structure interactions, Elabbasi et al. 19 used COMSOL Multiphysics to study the fluid-structure interaction of a Peristaltic Pump. Takashi et al. 20 and Sarrate et al. 21 described the equations of motion of fluid and rigid body with translation and rotation motion. Bathe and coworker 22 and Dettmer and Perić 23 introduced the finite element discretization equations for fluid, structure and the coupling interface, and described the solution procedures for fluid solid interaction.
At present, in the aspect of numerical simulation of cycloid pump, most studies focused on CFD (Computational Fluid Dynamics) in analyzing the pump performance under different service conditions (such as speed, temperature, etc.). There has not been reported about considering the characteristics of the pump under the fluid structure interactions. By means of the dynamic mesh technique in the rotating domain, the fluid structure coupling interface is set up on a cycloidal pump model building in COMSOL, including the corresponding boundary conditions. The simulation results obtained by applying CFD and FSI are improved by experimental verification. Finally by analyzing the two methods (CFD and FSI) in detail, a more realistic analysis method of cycloidal pump is obtained, which is more conducive to the flow field and rotor dynamics characteristics of the pump analysis.
The hypocycloid Gerotor Pump
Basic principle of cycloid
The main parameters of the hypocycloid profile are eccentricity, number of teeth, generation coefficient k and arc radius coefficient h. In this paper, the generation coefficient and arc radius coefficient which have the most significant influence on the tooth profile parameters are defined as follows:
(1) Generating coefficient: the ratio of the distance from the center of rotation of the outer rotor to the center of the arc of the tooth profile and the radius of the outer rotor pitch circle.
(2) Arc radius coefficient: the ratio of the arc radius of the outer rotor tooth profile to the pitch radius of the outer rotor.
Their expressions are as follows:

L (mm) – the distance between the rotation center of outer rotor and the center of arc of tooth profile
r2 (mm) – radius of pitch circle of external rotor
R (mm) – arc Radius of outer rotor tooth profile
Figure 1 is the schematic diagram of cycloid tooth profile formation.

Principle of tooth profile formation of cycloid rotor.
Among them, the point C1 is a cycloid formed by inner rolling method, the point M is the meshing point of internal and external rotor profile, r1 is the radius of the base circle and r2 is the radius of the rolling circle, L is radius of generating circle, R is the radius of tooth circle.
The tooth profile equation of inner rotor is shown in formula (2).

The relation of θ can be obtained from the meshing principle

Basic composition of cycloidal pump
A hypocycloid pump (see Figure 2) consists of two main components: an outer rotor and an inner rotor that has one less tooth than the outer rotor. For a pump, the inner rotor center-line is positioned at a fixed eccentricity from the centerline of the outer rotor. Both gears rotate in the same direction but at different speeds because of the relation between the teeth, with the internal gear being slightly faster than the external gear. The angular velocity ratio is Z − 1/Z.

Outer and inner rotor of gerotor pump.
This is one of many variations of the rotary positive displacement pump where fluid is delivered by changing the volume of that space. As the rotors rotate about their respective axes, fluid is drawn into the enlarging chamber up to a maximum volume. As rotation continues, the chamber volume decreases, forcing fluid out of the chamber.
Due to the processing and manufacturing errors, there is leakage in the operation of cycloidal pump, and the leakage clearance mainly includes:
(1) Axial gap: Clearance between rotor and end cover
(2) Radial gap: Clearance between inner rotor and outer rotor due to manufacturing error.
Table 1 shows the performance parameters of the experimented pump, and Table 2 shows the physical parameters of the lubricating oil.
Performance of experimented pump.

Physical parameters of lubricating oil.

Build cycloidal pump experiment bench
Cycloidal pump’s main performance parameters include flow, pressure, flow pulsation, etc. cycloidal pump experiment bench is built to experiment them.
Selection of experiment bench equipment
As shown in Figure 3 is the physical figure of cycloidal pump experiment bench, the main equipment used are shown in Table 3, and Figure 3 is the physical connection diagram of cycloidal pump experiment bench.
The main equipment in the experiment.


Physical connection diagram of cycloidal pump experiment bench.
Construction idea and operation of experiment bed
The structure of the experiment-bed is as follows: connect the motor 1, the torque meter 3 and the pump shaft 4 through the coupling 2, so that the motor can drive the pump to run and experiment the speed and torque through the torque meter; Connect the oil tank 11 with the inlet of the pump through the oil pipe, and connect the outlet of the pump with the oil tank to recycle the lubricating oil during the operation; Install pressure gage 5-1 and pressure transmitter 6-1 at the pump outlet to collect the pressure at the pump outlet, and install throttle valve 9, proportional overflow valve 10 at the pump outlet to regulate the outlet pressure; Install pressure gage 5-2 and pressure transmitter 6-2 at the outlet of throttle valve to experiment the pressure at the outlet of throttle valve, and install turbine flowmeter at the outlet of throttle valve to experiment the flow at the outlet of pump. Figure 4 is component connection diagram of experiment bench.
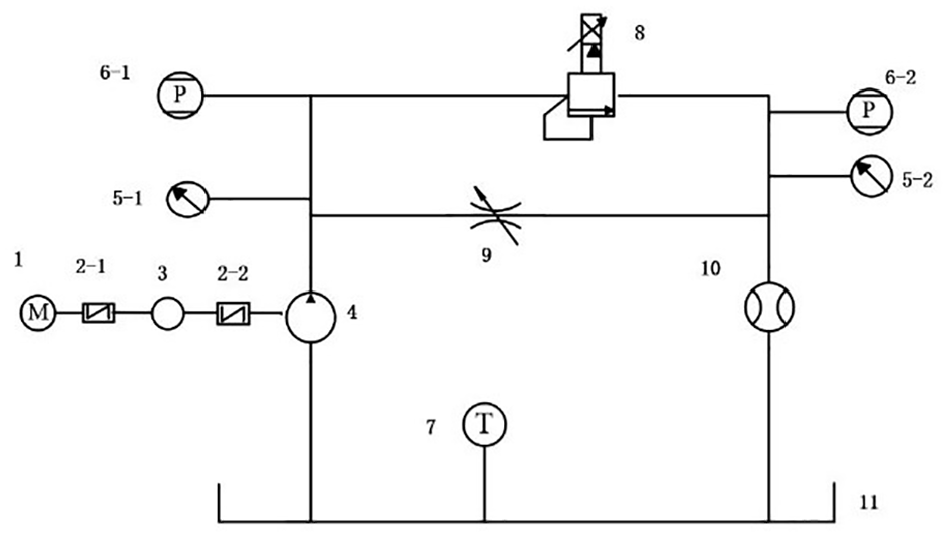
Component connection diagram of experiment bench. (1) Electric machinery; (2) coupling; (3) rotating speed and torgue sensor; (4) pump; (5) pressure gage; (6) pressure sensor; (7) temperature sensor; (8) relief overflow valve; (9) throttle valve; (10) flow sensor; (11) tank.
Basic operation process during the experiment:
① open the throttle valve to make the outlet pressure at low pressure;
② start the motor to let the pump run for a period of time, and carry out the next step after the flow, pressure and temperature are stable;
③ adjust the frequency converter to make the motor speed at the specified experiment condition;
④ adjust the throttle valve to change the outlet pressure of the pump;
⑤ observe the flow pressure characteristic curve and LABVIEW is used for data collection.
Error analysis and test results
The test error mainly comes from the sensor error and the test-bed pipeline error. The accuracy grade of the pressure sensor is 0.3, the range of the sensor is 0–2.5 MPa, and the error is ±7.5 kPa. When the measured value is 0.15 MPa, the actual measured pressure value is 0.1425–0.1575 MPa; The accuracy grade of the flow sensor is 1, the range is 3.3–20 L/min, and the error is ±0.2 L/min. When the measured value is 10 L/min, the actual measured flow value is 9.8–10.2 L/min, because the flow and pressure pulsation of cycloid pump is small, such error will affect the transient flow and pressure. Rubber tube is used in the pipeline of the test-bed, which affects the fluctuation of flow and pressure, thus affecting the test accuracy.
Figures 5 and 6 shows the change of flow rate and pressure at the outlet of the experiment pump with the speed of 1500 r/min and the outlet pressure of 0.15 MPa.

Instantaneous flow curve at outlet.
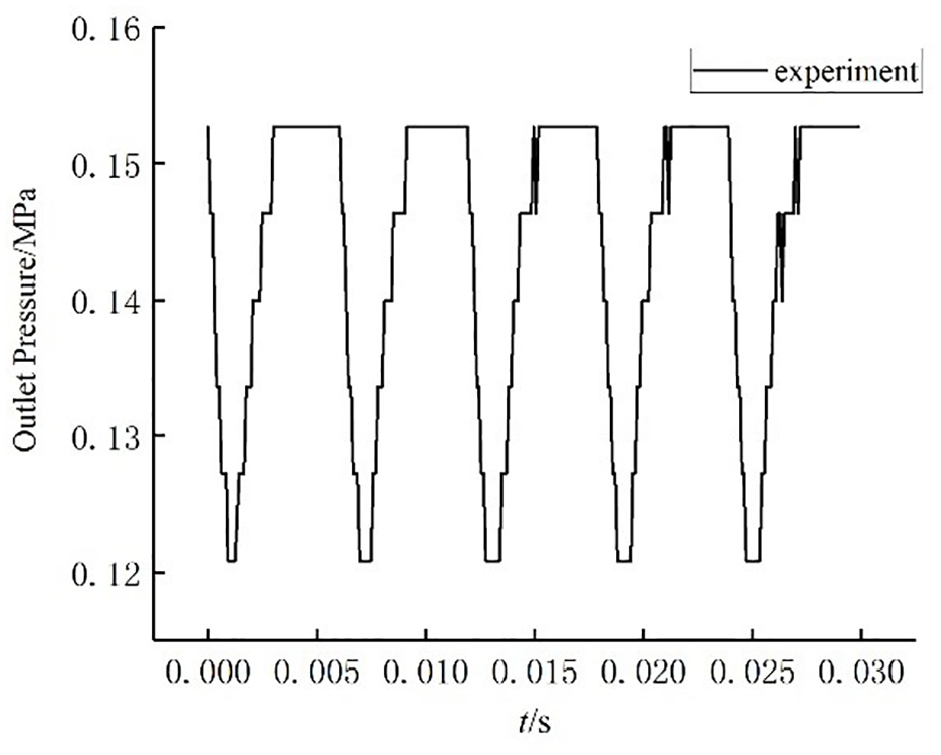
Instantaneous pressure curve at outlet.
Through the analysis in Figures 5 and 6, it is found that the outlet flow fluctuates up and down at 9.9 L/min, and the outlet pressure fluctuates up and down at 0.14 MPa, all of which show periodic changes.
Basic principle of cycloid pump simulation
Basic equation of fluid
Basic hypothesis of fluid: ① The fluid is Newtonian and incompressible. ② The fluid is initially stationary. ③ The flow is 3D and transient. ④ The body forces acting on the fluid are negligible. ⑤ The fluid is isothermal and has constant properties.
(1) The unsteady three-dimensional mass conservation or continuity equation at a point in a compressible fluid is given as:

(2) Conservation of momentum in an inertial (non-accelerating) reference frame and is described by the equation
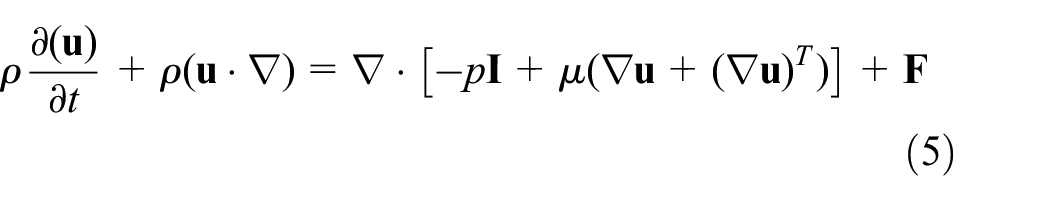
where ρ is the density (SI unit: kg/m3), p is the static pressure (SI unit: Pa), τ is the stress tensor (SI unit: Pa),
Basic equations of fluid structure interaction
In the ALE (Arbitrary Lagrangian-Eulerian) formulation, we can arbitrarily choose the standpoint to describe the governing equations, from the Lagrangian to the Eulerian, or the intermediate state, by specifying arbitrarily the distribution of the velocity of the reference points.
(1) ALE description of the Navier-Stokes equation
The momentum conservation law and the continuity equation for incompressible flow are formulated in the referential description as

where ρ,

where p represents the static pressure, µ denotes the fluid viscosity,
(2) Structure equation
The equation of structural motion is shown in equation (8).

where ρ is the material density,
In this paper, the rotor has translation and rotation motion, and its discretized equations can be expressed as follows [25].
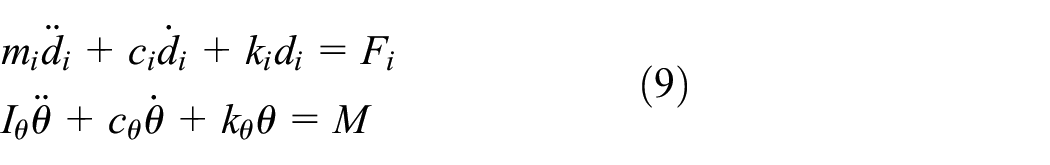
where displacements di are the components of the solid translation, whereas the angle θ describes the solid rotation, mi, ci, ki, Iθ, cθ and kθ denote the mass, the damping and the stiffness moduli for the translational and rotational degrees of freedom, respectively. The quantities
(3) Fluid-structure interaction
On the fluid-structure interface Γf-s, in a problem in which a viscous fluid flow is interacting with a solid, equilibrium and compatibility conditions must be satisfied at the fluid-structure interface. These conditions are

Also on Γf-s,
Through the theoretical analysis of CFD and FSI, it is concluded that: in the coupling interface, the hydrodynamic force and the motion of solid are not known in advance. Only after the whole coupling system is solved systematically, can their solutions be given. This is the feature of interaction and the difference with CFD. Without this feature, the problem will lose the nature of coupling.
Build the simulation model of cycloidal pump
In order to make the simulation model and the experiment model have the same performance, the geometry of the cycloidal pump is designed. Table 4 shows the specific structural parameters of the cycloidal pump.
The specific structural parameters of the cycloidal pump.

In the CFD numerical simulation of cycloidal pump, the fluid domain needs to be modeled. The fluid domain mainly includes the rotating region between the inner and outer rotors, axial leakage region, oil inlet and outlet chambers and oil inlet and outlet pipelines. The rotating region and leakage region are affected by the rotor, and their geometry changes. The oil inlet and outlet chambers and oil inlet and outlet pipelines are static fluid domains, and the detailed model diagram is shown in Figure 7.
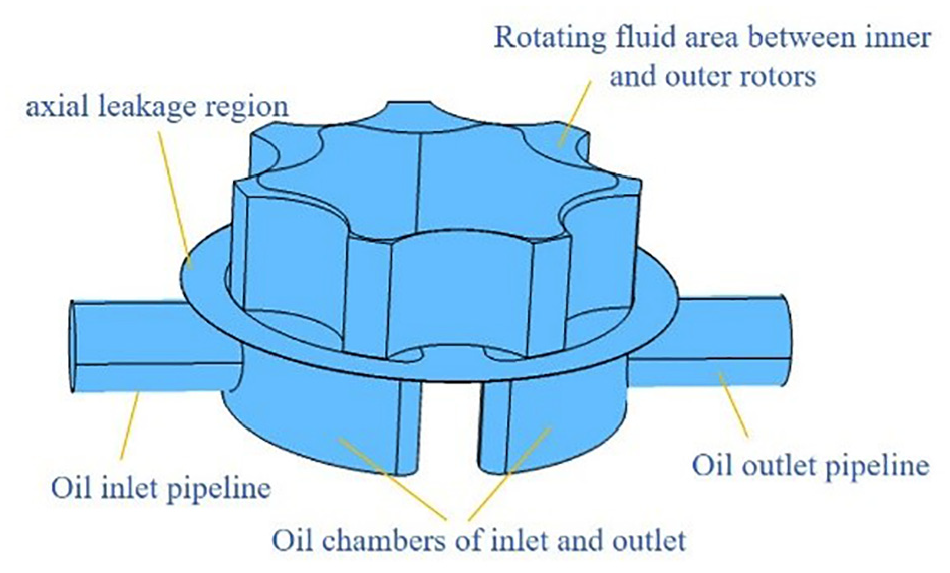
CFD model of cycloidal pump.
The cycloid pump is mainly driven by the inner and outer rotors continuously rotating to draw in and discharge the fluid, mainly because the inner and outer rotors contact with the fluid. Therefore, when analyzing the fluid structure interactions of the cycloid pump, it is necessary to establish the inner and outer rotor models. Figure 8 is the model established during the fluid structure interactions simulation, and Table 5 is the physical parameters of the fluid body and the solid.
Basic physical parameters of fluid and solid.

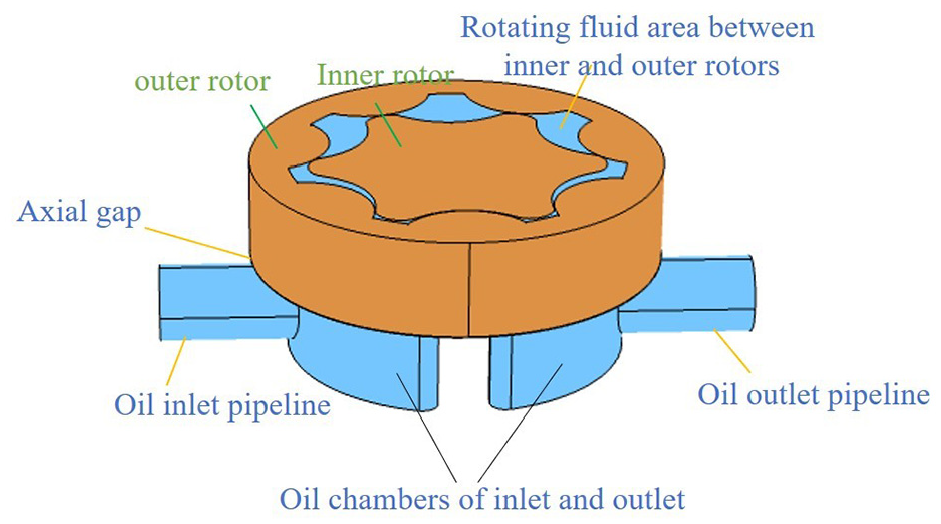
FSI model of cycloidal pump.
Boundary condition setting
Boundary conditions of fluid region
For the specific boundary conditions of the fluid domain, the inlet is local atmospheric pressure, and the outlet is 0–2.5 MPa. The static region and the dynamic region adopt the identity pairs to ensure the data transmission. Specify the fluid boundary movement of the inner and outer rotors. The dynamic deformation domain adopts ale dynamic grid method, and the specific boundary conditions are set as shown in Figure 9.

Boundary condition setting of fluid field.
Boundary condition setting of fluid structure interactions region
Figure 10(a) shows the setting of the coupling interface between the inner and outer rotors and the fluid between them, and Figure 10(b) shows the setting of the coupling interface between the rotors and the axial leakage field.

Fluid solid coupling interface: (a) coupling interface of the rotating rotation domain, and (b) coupling interface of the leakage region.
Grid generation
There is a gap of 0.1 mm between the inner and outer rotors in the rotating area, so the minimum grid size should be set as 0.01 mm, and the maximum grid size should not be too large. For the rotating area and the leaking area, the sweeping grid is used, and for other static fluid areas, the free tetrahedral grid is used. The specific grid is shown in Figures 11 to 13.

Grid division of fluid domain.

Grid division of axial leakage area.
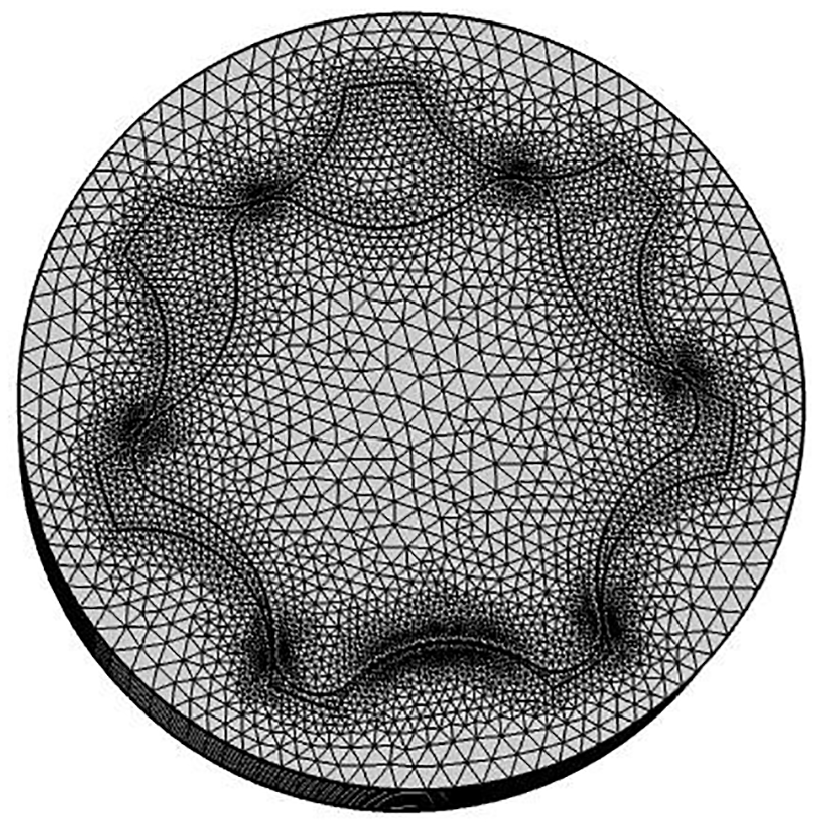
Internal and external rotors and rotating fluid grids.
Grid independence study
The details of the grid independence study are provided in Table 6 and Figure 14. Table 6 shows mean normalized flow and Figure 14 shows the instantaneous flow at the outlet for two mesh sizes.
Mean normalized flow for two mesh sizes.


The instantaneous flow at the outlet for two mesh sizes.
Through analysis, it is shown that the error in the mean normalized flow is 0.28% and 0.68% for the flow pulsation rate. Considering this minimum error (Figure 8) and the performance of the central processing unit, the simulation here is feasible with a grid of about 175,450 cells.
Comparative analysis of CFD, FSI and experiment
Comparative analysis of outlet flow and pressure characteristics
By analyzing the flow and pressure characteristic curve at the simulation outlet of CFD and FSI, and comparing with the experiment results, as shown in Figures 15 and 16, the comparison of CFD, FSI and experiment is made.

Instantaneous flow fluctuation.

Transient pressure fluctuation.
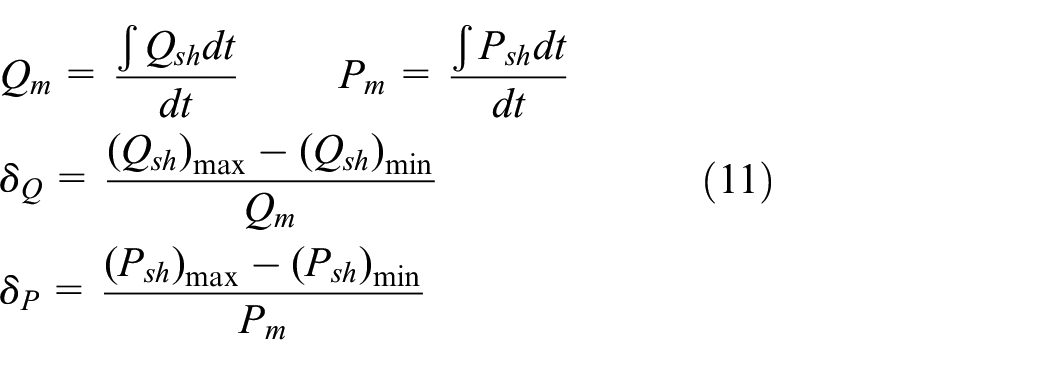
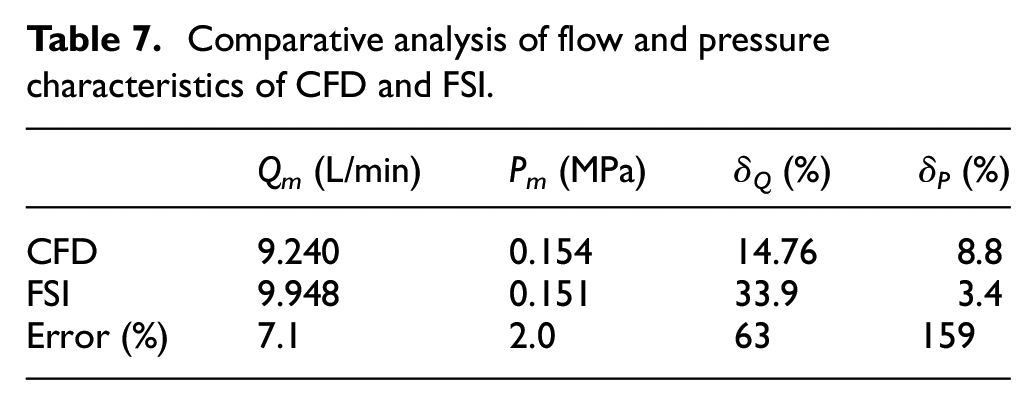
The average value of flow and pressure, flow pulsation and pressure pulsation of CFD, FSI and experiment are analyzed. The formula is the average value of flow and pressure and the calculation formula of pulsation rate. Tables 7 and 8 are the specific calculation results, and the errors between CFD, experiment and FSI are compared.
Comparative analysis of flow and pressure characteristics of CFD and FSI.
Comparison and analysis of flow and pressure characteristics between experiment and FSI.

where Qsh and Psh are the average flow and pressure respectively; δQ and δP are flow pulsation rate and pressure pulsation rate respectively.
Through the analysis of Figures 15, 16 and Tables 7, 8, it can be concluded that: (1) in terms of flow characteristics, the average flow value of FSI simulation is higher than that of test and CFD, but it closer to the experiment value. In CFD calculation, only rotation displacement is specified at the contact interface between the inner and outer rotors and the fluid, while the inertia force is applied to the fluid by the rotor during rotation, resulting in the CFD calculation result lower than the experiment value; The flow pulsation rate of FSI at the outlet is the largest, because the long rubber pipe is used at the outlet in the test, and it passes through the throttle valve, overflow valve and other components, and there is error in the test, resulting in very small flow fluctuation.
(2) In terms of pressure characteristics: the pressure average value of FSI and experiment at outlet is lower than the CFD simulation value, the pressure mean value of FSI is closer to the CFD result, and the pressure boundary condition at the outlet is 0.15 MPa, so the CFD and FSI results are more reasonable; compared with the pressure fluctuation of the CFD, FSI and experiment, the pressure fluctuation rate of CFD and FSI is relatively small, because of the complexity of the pipeline and the error of the parts such as the throttle valve, the overflow valve and the pressure sensor, the pressure pulsation rate at the outlet of the experiment is large.
Based on the above analysis, it is concluded that there are errors in numerical simulation and experiment, and there are differences in experiment, CFD and FSI results. In terms of flow, FSI is closer to the experiment, and in terms of pressure, FSI and CFD are more in line with the actual situation.
Combined with the theoretical analysis of CFD and FSI, it is concluded that the interaction between fluid and solid is generated by the rotor driving fluid motion during the operation of the pump. Since CFD only specifies the motion on the motion interface, FSI not only generates the motion at the fluid solid coupling interface, but also is affected by the solid force. The coupling has a great influence on the calculation results. Therefore, FSI simulation is closer to the reality.
Comparative analysis of CFD and FSI
In order to study the influence of coupling on the calculation results and further analyze the difference between CFD and FSI, because the flow and pressure of CFD and FSI are periodic fluctuations, choose a cycle to compare the CFD and FSI simulation results (such as choosing six time nodes in 0.015–0.022), choosing a section of rotating fluid domain (z = 7 mm) of CFD and FSI, and comparing the pressure and velocity distribution at the section. As shown in Figures 17 and 18, the cross-section pressure and velocity are compared.
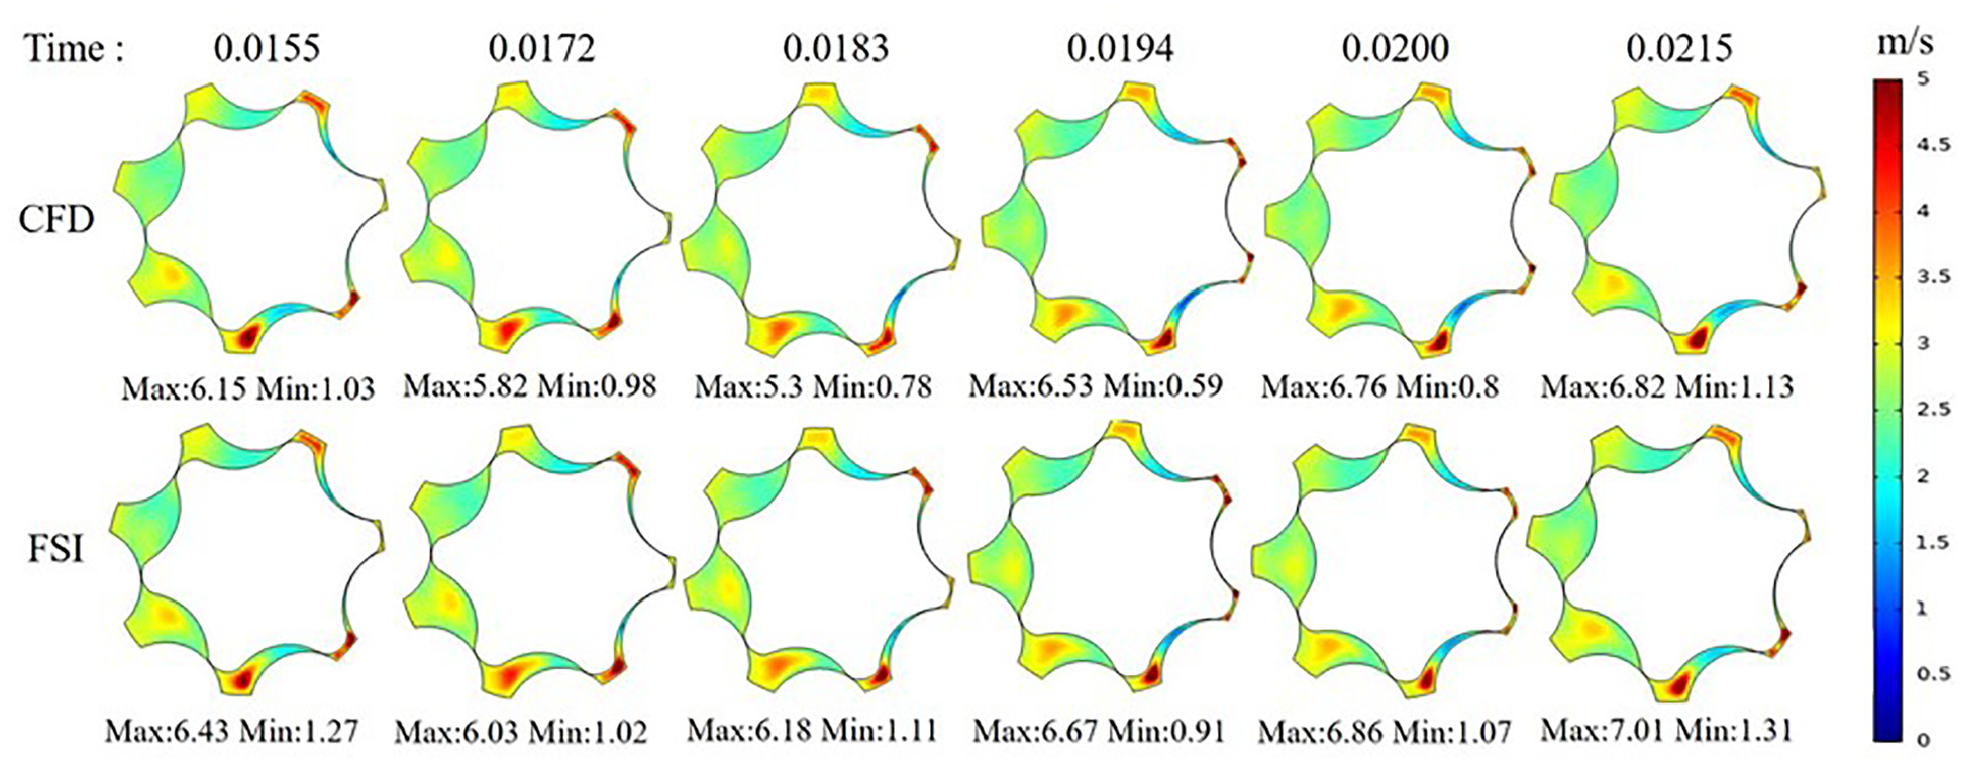
Comparison and analysis of velocity distribution on a section of CFD and FSI in the rotation region.
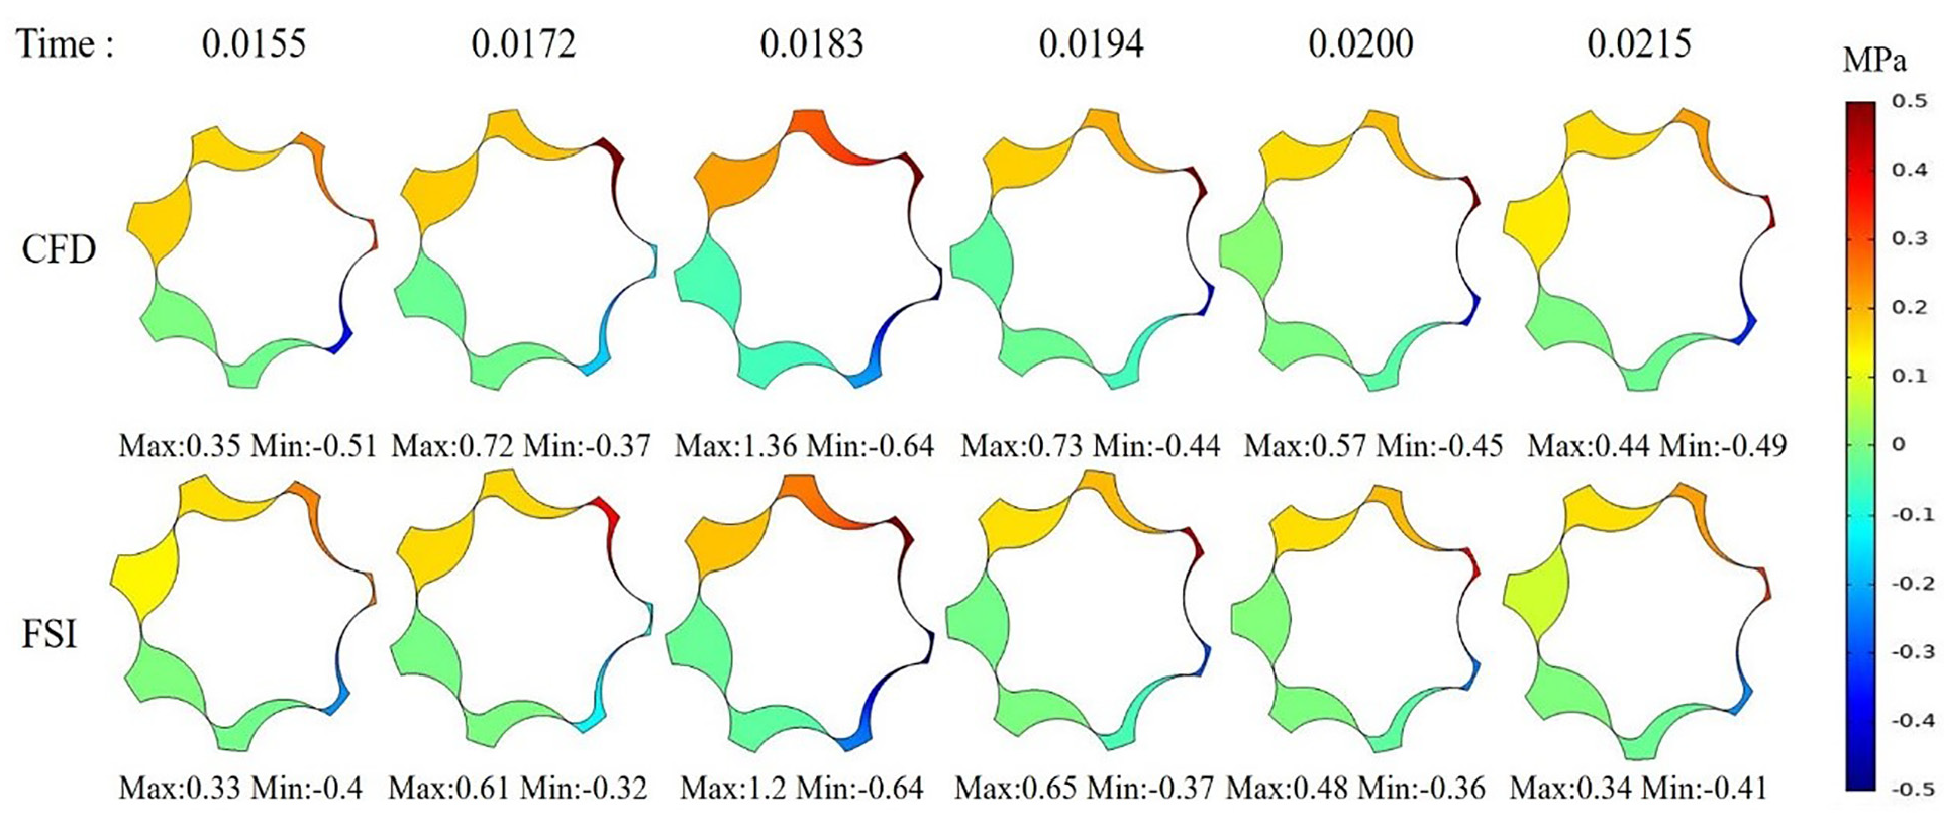
Comparative and analysis of pressure distribution on a section of CFD and FSI rotation region.
Through the analysis of Figures 17 and 18, it can be concluded that the average of minimum negative pressure difference between CFD and FSI in the oil absorption area is about 0.07 MPa, the average of maximum positive pressure difference between CFD and FSI in the oil absorption area is about 0.09 MPa, and the calculated velocity of CFD is less than FSI.
Furthermore, the contact area between the inner and outer rotors and the fluid is analyzed. Figure 19(a) and (b) shows the change of pressure with time at a certain point of the inner and outer rotors respectively, and Figure 20(a) and (b) shows the change of maximum pressure with time on the surface of the inner and outer rotors respectively.

The change of pressure at a certain point of the inner and outer rotors: (a) the change of pressure of the inner rotor at a certain point, and (b) the change of pressure of the outer rotor at a certain point.

The change of maximum pressure on the surface of the rotors: (a) the change of maximum pressure with time on the surface of the inner rotor, and (b) the change of maximum pressure with time on the surface of the outer rotor.
Through the analysis of Figures 19 and 20, it can be concluded that the pressure value of CFD at a point on the inner and outer rotors is greater than that of FSI. The maximum surface pressure of the inner and outer rotors of CFD during operation is also greater than that of FSI. The main reason for this difference is that the inertia force of the solid is used for the fluid in FSI, which changes the motion state of the fluid, increases the speed of the fluid, and thus the pressure reduced.
Comparative analysis of CFD and FSI at different viscosities
Because the main function of the oil pump is to provide lubrication and cooling for the moving parts, and the temperature of the engine can reach 20–200°C when it is running, it is necessary to analyze the characteristics of the oil pump at high temperature. Table 9 shows the physical property parameters of lubricating oil at 12°C and 40°C.
Physical parameters of lubricating oil at different temperatures.

Figure 21(a) and (b) shown the change of the flowrate and pressure characteristic curves at the outlet in different viscosity respectively, which based on the CFD method.
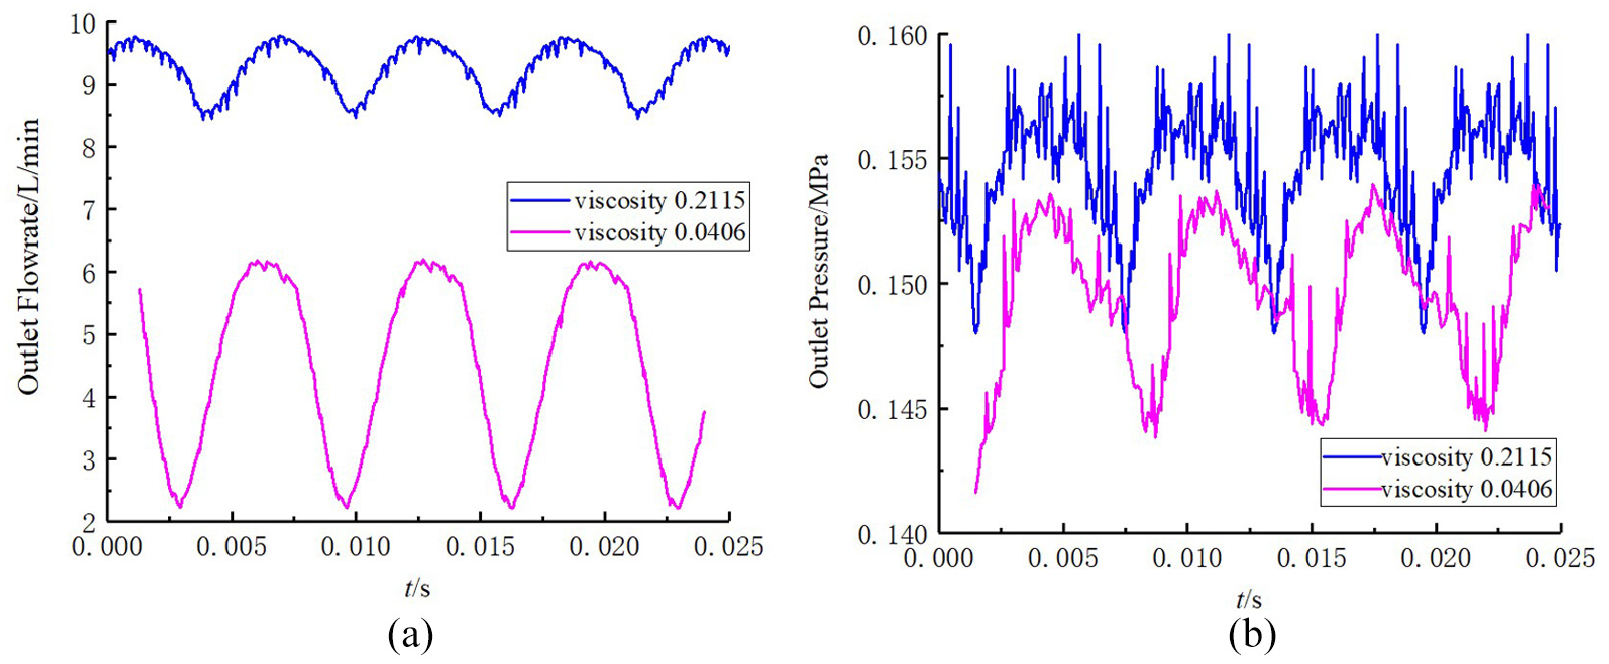
The instantaneous flow and pressure fluctuation at the outlet in different viscosity respectively: (a) the change of the outlet flowrate in different viscosity, and (b) the change of the outlet pressure in different viscosity.
According to the simulation method of CFD and FSI in Section 3.1, the characteristics of cycloidal pump at 40°C are simulated and analyzed. Figures 22 and 23 are the instantaneous flow and pressure characteristic curves at the outlet of CFD and FSI respectively.

Instantaneous flow fluctuation.

Transient pressure fluctuation.
The results show that there are some differences between CFD and FSI simulation results when the temperature is 40°C, and the coupling calculation has an impact on the results.
Furthermore, the CFD and FSI of the rotation section and fluid solid coupling surface of the cycloid pump are compared. According to Section 3.2, a certain section (z = 7 mm) of the rotating fluid domain of the CFD and FSI is selected, and six nodes of the time are selected from 0.015 to 0.022 to compare the pressure distribution of the section. As shown in Figure 24, the cross-section pressure of CFD and FSI is compared. Figure 25 is the maximum pressure distribution on fluid solid coupling surface at 40°C.

Comparison and analysis of pressure distribution on a section of CFD and FSI rotation region at 40°C.

Maximum pressure distribution on fluid solid coupling surface at 40°C: (a) the maximum pressure distribution of inner rotor on fluid solid coupling surface, and (b) the maximum pressure distribution of outer rotor on fluid solid coupling surface.
According to Figures 24 and 25, it is concluded that the negative pressure value of CFD in the oil suction area is higher than FSI, the positive pressure value of CFD in the oil discharge area is higher than FSI, and the maximum pressure value of CFD on the inner and outer rotor surfaces is higher than FSI. It is consistent with the analysis results in Section 3.2.
According to the analysis in Sections 3.2 and 3.3, the coupling has a great influence on the calculation results. Because the CFD specifies the displacement movement at the fluid interface of the rotor, the velocity at the boundary is determined. However, the fluid structure coupling has the interaction between the rotor and the fluid. Because the rotor is almost not deformed, the effect of the elastic force is not considered, but the rotor rotates at a high speed and has the inertial force. Through the interface the inertial force is applied to the fluid on the surface, so as to change the motion state of the fluid, thus increasing the velocity of the fluid and reducing the pressure of the fluid.
Conclusion
The cycloid pump model is established and according to the basic principle of CFD and fluid structure interactions, the corresponding boundary conditions and grid are set up, and then the CFD and FSI simulation analysis of the cycloidal pump is carried out, and compares with the experimental results. The results show that:
(1) In the aspect of flow characteristics, the average flow of FSI simulation is closer to the test value, in the aspect of pressure characteristics, the average outlet pressure of FSI and CFD is more practical, and the average outlet pressure of test is slightly lower. Combined with comparative analysis and FSI, CFD theory shows that the simulation of FSI is closer to reality.
(2) By comparing the velocity and pressure of a certain section between the inner and outer rotors of CFD and FSI at different temperatures, it is concluded that the negative pressure CFD calculated in the oil suction area is more than FSI, and the velocity CFD calculated is less than FSI; the positive pressure CFD calculated in the oil discharge area is more than FSI, and the velocity CFD calculated is less than FSI.
(3) By comparing the pressure distribution at some point of the contact boundary between the rotor and the fluid in CFD and FSI, it is concluded that the fluctuation value of the pressure of CFD with time is greater than that of FSI.
Based on the above analysis, it can be concluded that there are differences between CFD and FSI calculation results. Because CFD only specifies motion on the motion interface, FSI not only generates motion at the fluid solid coupling interface, but also is affected by the solid force. Through comparison, it is found that the coupling has a great influence on the calculation results. The coupling analysis of the pump makes the analysis results more realistic and more advantageous to analyze the flow field and rotor dynamic characteristics of the pump.
Footnotes
Acknowledgements
I would like to thank Prof. Liu and Prof. Wang for their guidance on paper writing, Prof. Mao Hu-ping for their help in the experiment, and finally, I would like to thank International Science Editing for their help in language modification.
Handling Editor: James Baldwin
Declaration of conflicting interests
The author(s) declared no potential conflicts of interest with respect to the research, authorship, and/or publication of this article.
Funding
The author(s) disclosed receipt of the following financial support for the research, authorship, and/or publication of this article: This project is supported by Applied Basic Research Programs of Shanxi Province in China (ABRPOSP, 201901D111131) and National Defense Science and Technology Key Laboratory of Tank Transmission (NDSATKL, 141009AT03091H).