
Abstract
The states of the machine tool, such as the components’ position and the spindle speed, play leading roles in the change of dynamic parameters. However, the traditional modal analysis method that modal parameters manually identified from vibration signal is greatly interfered by harmonics, and the process of eliminating interference is very inefficient and subjective. At present, there is a lack of a standard and efficient method to characterize modal parameter changes in different states of machine tools. This paper proposes a new machine tool modal classification analysis method based on clustering. The characteristics related to the modal parameters are extracted from the response signal in different states, and the clustering results are used to reflect the changes of machine tool modal parameters. After the amplitude of the frequency response function is normalized, the characteristics related to the natural frequency are acquired, and the clustering results further reflect the difference of the natural frequency of the signal. The new method based on clustering can be a standard and efficient method to characterize modal parameter changes in different states of machine tools.
Introduction
The structural vibration characteristics of the machine tool greatly affect the machining accuracy and efficiency.1–3 The scholars Jorgensen and Shin 1 found that the dynamic characteristics of the machine tool under the working condition will change due to the change of machine states, such as the working position of the table and the spindle speed. During the machining process, the changes of the table position or other state factors cannot be avoided. In the analysis of machine tool dynamics, the influence of the state of the machine states must be considered.
Due to the difference in the structure and assembly of the machine tool, the existing finite element simulation accuracy is still difficult to meet the needs of dynamics research. Therefore, the current research methods of machine tool dynamics are mainly based on experimental modal analysis methods, which mainly include the hammering method and the OMA (Operational Modal Analysis method) method.4–6
The hammering method is a method of exciting a machine tool by hammering, and the modal parameters of the machine tool are analyzed from the hammer response. The OMA method is a method of exciting a machine tool by the white noise signal of the natural environment, and the dynamics parameters are analyzed from the response. According to the OMA method, Li et al.,7,8 of Huazhong University of Science and Technology proposed a method that the random cutting force or the active running that meet OMA requirements is used to stimulate the machine tool to obtain the dynamic characteristics of the machine tool under the operating state, which brought new ideas to the research of machine tool dynamics. In 2009, based on the OMA method, Canadian scholars Zaghbani and Songmene 9 found that the modal parameters of the machine tool during operation are very different from those at rest, especially the damping ratio changes 2 to 10 times. On the other hand, the author encountered serious harmonic problems in the manual analysis process. Many research results also show that the influence of different states on the modal parameters of the machine is huge and complicated.9,10
However, whether the hammer method or the OMA method is adopted, the machine tool is excited in a specific single state. Then the signal is manually analyzed by special analysis software. The machine tool must be tested many times under different states, and whether the modal parameters have changed in different states only can be found after the manual analysis in various states. 11 With the interference from harmonic, the identification process of parameters is often complicated and difficult. The harmonic part is similar in shape to the natural frequency part, which researchers cannot directly distinguish. After a lot of hard calculation, people may eliminate the interference and get the modal parameter, but there are still subjective factors when judging whether it is harmonic or not based on the calculation. Beside, human error between different people will also make the analysis results different. So, it is not convincing enough to judge whether the modal parameters change according to the result of manual recognition. On the other hand, the identification process is also repeated, and many of the identified modal parameters are similar. The traditional analysis method is inefficient. When there is large number of samples to be analyzed, the method of manually identifying modal parameters will be not suitable. At present, there is a lack of an efficient and standard method to characterize modal parameter changes in different states of machine tools.
This paper, based on clustering, proposes a new modal classification analysis method, which can effectively show the influence that the state factors have on modal parameters of the machine tool. When studying the influence of machine state on the modal parameters of the machine tool, we are concerned about what happens to the modal parameters of the machine tool. The clustering algorithm is an efficient method to show the difference of samples. In the clustering algorithm, samples with small differences are grouped into one group, and those with large differences are grouped into different groups. The vibration signals of the machine tool acquired under different states are pre-processed to show the frequency domain characteristics. In the case of the same excitation, the output signals are clustered, and the samples of different groups correspond to different modal parameters. After cluster analysis of the signals obtained under different states, you can find that under what states the modal parameters of the machine are the same or different. Furthermore, when only two main modal parameters of the machine tool, the natural frequency and the vibration amplitude, are considered, the influence of the amplitude parameter is eliminated after the amplitude normalization, and the clustering result is only related to the natural frequency. After comparative analysis we can also find changes in vibration amplitude. Compared with the traditional method of analyzing and identifying modal parameter one by one in different states, the new method does not need to manually recognize the modal parameters, directly shows the differences between the modal parameters of the machine tool, simplifies the analysis process and reduces the manual error. The large amount of data condition that is difficult to be analyzed by the conventional method, the new method can be well adapted. The new method based on clustering can be a standard and efficient method to characterize modal parameter changes in different states of machine tools.
Principle of signal preprocessing and modal classification analysis method
Modal parameter characteristics
Based on the viscous damping model, the multi-degree-of-freedom system frequency response function expression is shown in equation (1).

Where:

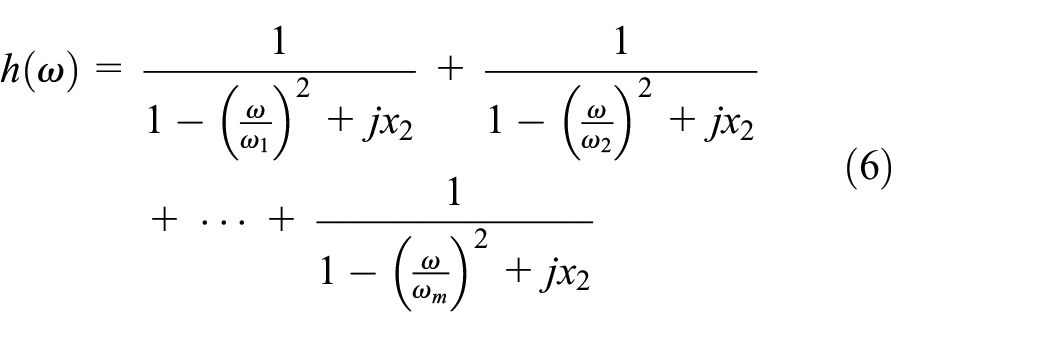
The values of the undamped natural frequency and the damped natural frequency can be approximately equal. The single-order modal expression of the frequency response function can then be reduced to the form of equation (3).

It can be seen from the equation (3) that the natural frequency corresponds to the peak position of the frequency response function. Generally, the influences of different orders are small. In view of this, the equation (3) is reduced to an equation (4) with only two unknown factors:

Where
Principles of signal preprocessing and characteristics extraction
The above analysis shows that the peak position of the frequency response function corresponds to the natural frequency of the machine tool, so the natural frequency information of the machine tool can be extracted by recording the peak positions. Then, clustering is performed, and the result of clustering is only sensitive to the natural frequency of the frequency response function.
Average the frequency response function

Given a coefficient k, we take
Given a coefficient m, we set the screening condition
The natural frequency related characteristic, that is, a vector with a natural frequency correlation
The new frequency response function contains the natural frequency information of the original frequency response function. Since the same
In order to obtain the modal parameters, the traditional OMA analysis method is interfered by the harmonic information. But in the same state, the modal parameters is often similar, and the harmonic information contained in the vibration response is often similar. Therefore, the extracted frequency domain features are similar, in the clustering results, signal with similar modal parameters and similar harmonic information will be one group. So the cluster analysis method is not affected by the harmonic interference of the machine frequency response.
Principle of machine tool modal classification analysis method based on clustering
After years of development, clustering has many applications in fault identification.12–14 Clustering has developed a variety of clustering methods for different scenarios. 15 In the study of dynamics research, due to the complexity of modal parameters, it is very difficult to determine the number of clustering groups in advance, so the fast clustering method that does not need to determine the number of clusters in advance is what we need. 16
The data set is

The distance between the samples is mainly determined by the parameter

The distance of

The distance
The implementation process of the algorithm is as Figures 1 and 2.

Clustering two-dimensional diagram.
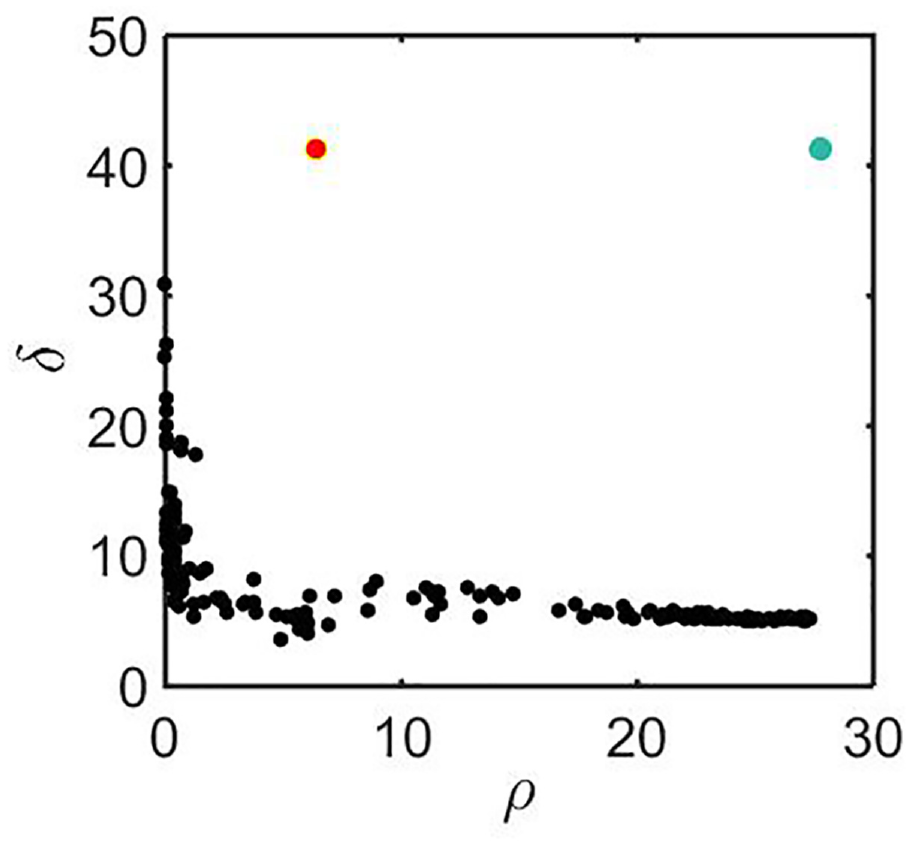
Decision graph.
The Figure 1 shows the distribution of sample points in a two-dimensional diagram, and the Figure 2 shows the decision map of density and distance values for each sample point.
The red and blue points with larger density values and distance values in the upper right corner of Figure 2 are more prominent in the decision graph than the other sample points, so these two points are the cluster center points. Figure 2 has a decisive role in determining the cluster center point and is therefore referred to as an algorithm decision map. After the cluster center found, the clustering process is completed by categorizing each sample point.
When the machine frequency response function is used as samples, the distance between n-order modal responses is as equation (7). The clustering results illustrate the differences between machine modal parameters. After the signal is normalized, the newly constructed frequency response function has the same amplitude parameter
In summary, the new modal analysis method applied to changing machine tool using clustering proposed in this paper is shown in the Figure 3.

Modal classification analysis method based on clustering.
First, the frequency response signal is obtained by processing the time domain response signal of the machine tool, and then preprocessed, the modal parameter change between the machine response signals can be found by clustering. Further, after the amplitude normalization process, the clustering results show the changes in the natural frequency of the machine tool. The response signal of the machine tool is obtained under different states. The influence of the machine state change on the modal parameters of the machine tool can be analyzed after cluster analysis.
Preprocessing and simulation data clustering experiment
Preprocessing
The number of experimental samples is large and the samples have group distribution are necessary for the clustering. The natural frequency of the machine are related to the structure and material of the component. The amplitude at the natural frequency is related to the inherent characteristics of the system and also related to the machine excitation signal. So the influence of the machine state on the modal parameters of the machine tool is very complicated. When experiment, it is difficult to encounter the same modal parameters of the machine in two or more positions. In order to ensure that the samples entering the cluster can be distributed according to the group, it should be able to ensure that the experimental samples with similar parameters are collected.
It is much more convenient to obtain data based on the OMA experimental modal analysis method than the hammering method. Therefore, in our experiment, the vibration response is stimulated by the self-excitation method based on OMA. According to OMA theory, the input needs to meet the white noise assumption. In the experiment, a special G code excitation sequence was designed to drive the machine to run autonomously. At the same time, in the same state, the same G code is used to excite the machine tool multiple times to obtain enough vibration signals. The respond signals under the same excitation and the same state are collected. There is only little noise difference between the frequency response functions of these signals and it often appears to be the same group in clustering.
When the response satisfies the white noise assumption, the Fourier transform of the machine output signal differs from the machine’s frequency response function by a constant coefficient, as equation (10) shows.

Therefore, the Fourier transform of the output signal can be used instead of the frequency response function of the system, and the self-power spectrum of the output signal is as shown in equation (11).

The self-power spectrum of the machine output signal has the same frequency domain performance as the frequency response function of the machine tool.
The measured time domain response of each point of the machine tool and its self-power spectrum are shown in the Figures 4 and 5.

Time domain response signal.

Self-power spectrum.
In the Figure 5, the low-frequency component of the self-power spectrum is very large, and this part of the value is abnormal, which will greatly affect the accuracy of the subsequent peak identification. Therefore, in the pre-processing process, the low-frequency component (less than 10 Hz) in the self-power spectrum is directly removed.
After the Amplitude normalization process, the frequency response function is reconstructed, and the new frequency response function is as Figure 6.

The self-power spectrum (blue) and the new frequency response function (red).
As shown in the figure, it can be seen that the newly obtained frequency response function has the same peak position as the original power spectrum signal, and the height of each peak has been substantially the same, and the normalization of the peak is completed.
Simulation data clustering experiment
We analyzed the natural frequency of the TC500 machine table at another different position, as shown in the Table 1.
The natural frequencies at two positions.

There is indeed a certain difference between the natural frequencies of the machine tool in the two positions. Based on the table above, the simulation data of the frequency response function of the machine tool is designed.
Experiment 1: Clustering of frequency response functions with different natural frequencies
Only the natural frequencies are different between the two sets of experimental samples, according to the equation (5), The natural frequency of the samples 1 to 50 uses the information of position 1 of TC 500 machine tool, while the natural frequency of samples 51 to 100 uses position 2, the damping coefficient is set to unity (0.01, 0.015, 0.03). In order to get closer to the measured data, each signal is also added with a noise of 10. The figure of sample 1 and sample 51 is shown in the Figure 7.

The sample 1 and sample 51 in experiment 1.
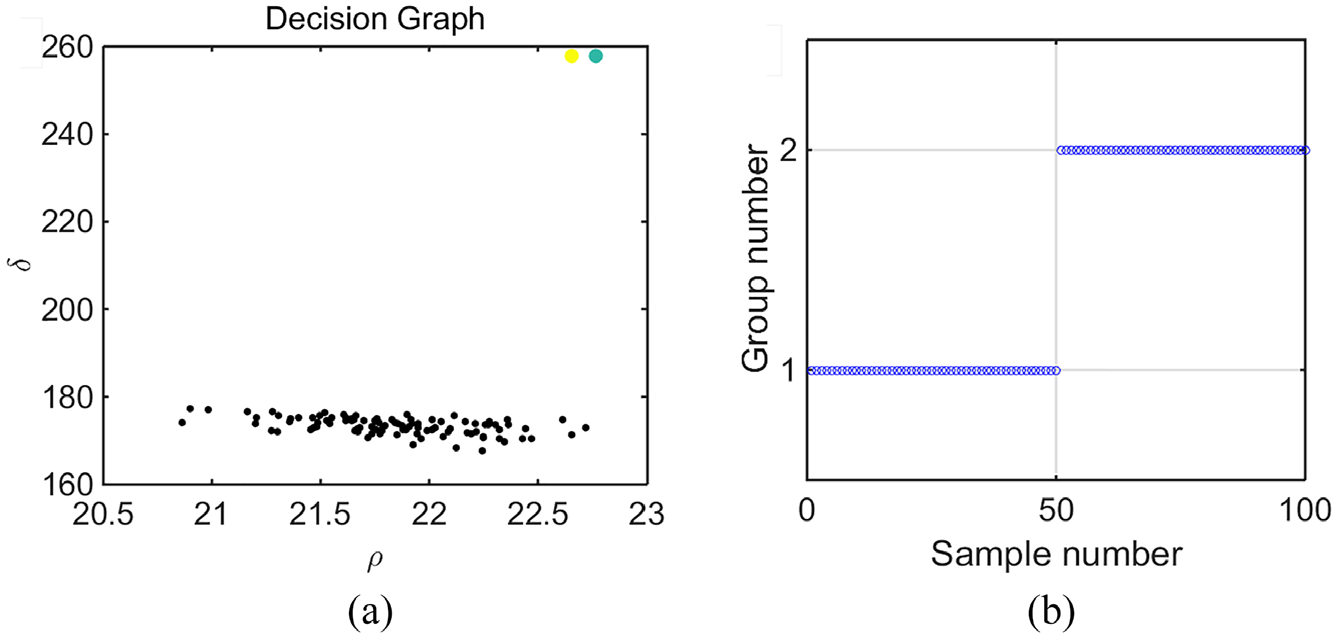
The central decision map after clustering and the distribution map of each sample are shown in the Figure 8.

Decision graph (a) and distribution of samples (b) in experiment 1.
There are obviously two points as cluster centers in the cluster center decision graph, and 100 samples are divided into two categories, the distribution of each sample corresponding to the design simulation parameters. This shows that the clustering results can characterize the changes of natural frequency due to positional changes.
Experiment 2: Clustering of frequency response functions with different damping
Damping parameters mainly affect the amplitude characteristics of the frequency response function. Damping different frequency response function is also the focus of research. The third-order damping value of samples 1 to 50 to set as (0.01, 0.015, 0.03), while samples for 51 to 100 (0.015, 0.03, 0.01), the natural frequency parameters for all samples use the natural frequency information at position 1 of TC500 machine tool. The schematic diagrams of sample 1 and sample No. 51 are shown in the Figure 9.

The sample 1 and sample 51 in experiment 2.
It can be seen from the figure that the peak positions of the two signals are the same and the amplitudes of the peaks are different. The cluster center decision graph and sample distribution map are shown in Figure 10.
Decision graph (a) and distribution of samples (b) in experiment 2.
There are obviously two points as cluster centers in the cluster center decision graph, and 100 samples are divided into two categories, the distribution of each sample corresponding to the design simulation parameters. This shows that the clustering results can characterize the change in amplitude characteristics due to changes in damping parameters among samples.
Experiment 3: Clustering of frequency response functions with different natural frequencies and damping
Actual analysis, natural frequency and damping parameters of the response signal may have changed. The clustering effect of samples with different natural frequencies and amplitudes is also needed to research. The Table 2 gives the parameters among the simulated experimental samples.
Natural frequency and damping ratio coefficients of each sample.
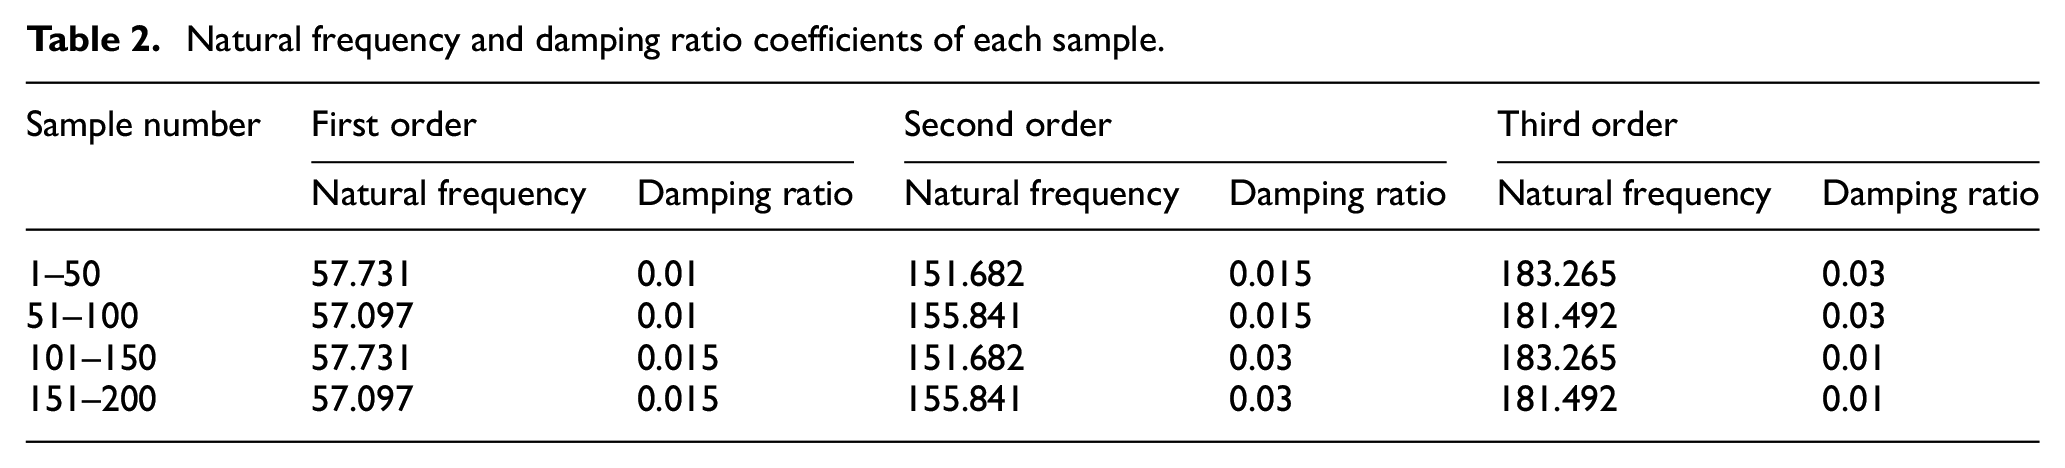
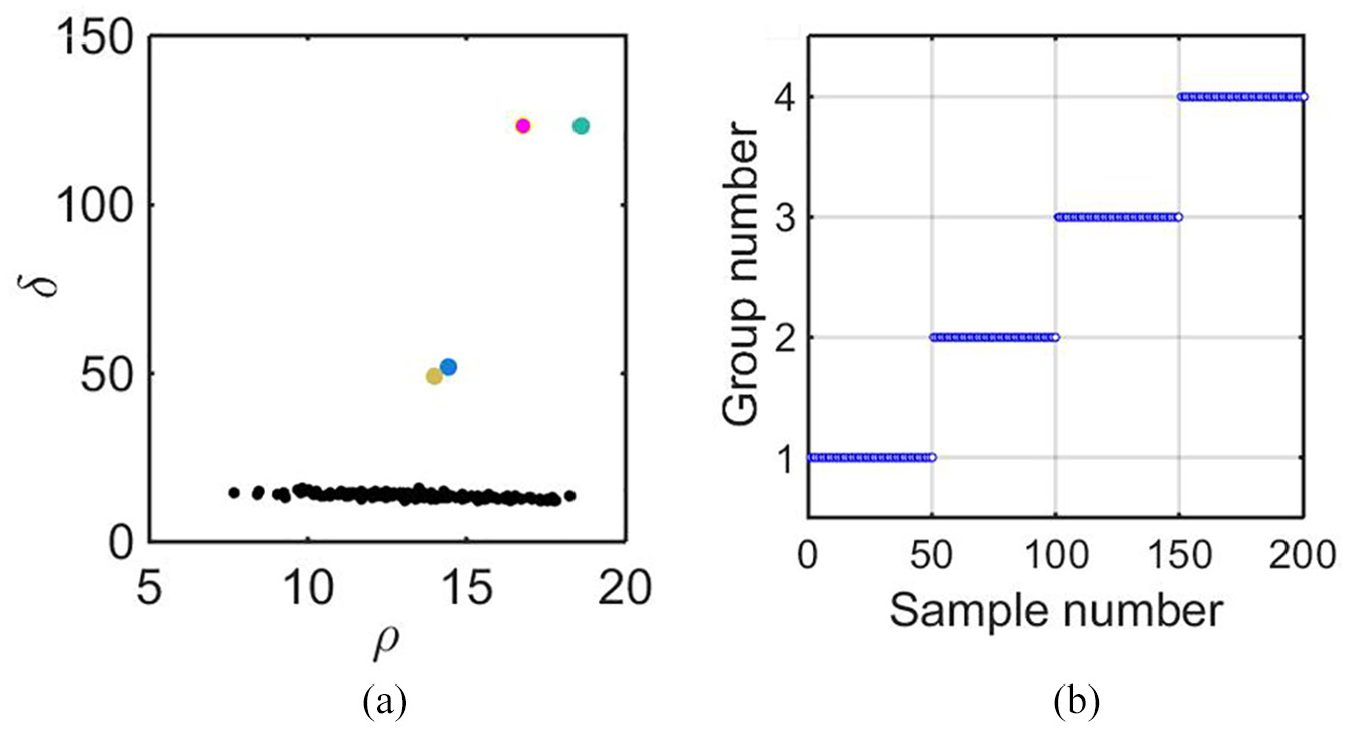
It can be seen from the above that the samples 1 to 50 and the samples 51 to 100, the samples 101 to 150 and the samples 151 to 200 have different natural frequencies but the same amplitude, the samples 1 to 50 and 101 to 150, the samples 51 to 100 and the sample 151 to 200 has the same natural frequency but different amplitudes. The four sets of experimental data were compared with each other. The above 200 experimental data were clustered, and the cluster center decision map and the distribution of each sample are shown in Figure 11.

Decision graph (a) and distribution of samples (b) in experiment 3.
Among them, the samples numbered 1 to 50, 5 to 100, 101 to 150, and 151 to 200 are grouped into four groups, consisting with the four sets of samples of the simulation data. The clustering results show that either the natural frequency or the amplitude of the machine tools’ frequency response function changed will make the data cluster into different groups. The change of the modal parameters caused by the change of machine tools’ state can be analyzed by clustering method.
Experimental verification
The cluster-based machine tool modal analysis method should be verified from two aspects: (1) whether the clustering result can identify the difference between the modal parameters of the vibration signal; (2) whether the signals of different machine tools states can be grouped into different groups during the clustering.
For problem 1, we designed the first verification test: the parameter sensitivity verification test of the cluster-based modal classification analysis method. For problem 2, we designed a second verification test: the state sensitivity verification test of the cluster-based modal classification analysis method.
The parameter sensitivity verification test
Different components of the machine tool often have different natural frequencies, and the natural frequencies of the points on the same component are the same. Due to the vibration modal, the amplitude of the points on the same component is different. The TC500 machine tool can be divided according to the composition as shown in Figure 12. Signals of different modal parameters can be obtained according to the distribution of the measuring points.

TC500 machine tool component: (a) Main view and (b) Overall view.
In this experiment, the specific G code is used to control the workbench of the TC500 machine tool to perform random acceleration and deceleration in the X direction to excite the machine tool, The sensor is located at the position No. 1 and the position No. 2 in the machine table, the position No. 3 and the position No. 4 in the column to record the acceleration signal of the machine tool. The length of each signal was 4s, and a total of 50 experimental data were collected by the LMS Text Lab, the sensor positions and the scene picture are shown in Figures 13 and 14.

The sensor position in TC500.

The scene picture.
The signal number: the response number of position No. 1 is No.1–50, the response number of position No. 2 is No.51–100, the response number of position No. 3 is No.101–150, and the response number of position No. 4 is No.151–200.
The logarithm of the self-power spectrum for the above 200 samples is clustered without normalization, and the obtained cluster center diagram is as shown in the Figure 15.
Decision graph (a) and distribution of samples (b) in parameter sensitivity experiment.
The Figure 10 shows that there are four reliable cluster centers, which are distributed in hierarchical clustering, indicating that the samples are clustered into four categories. The above four points are selected as the center, and the 50 samples collected from each point are grouped into one group.
The above 200 sample amplitudes are normalized and clustered. The decision map of the cluster center is shown in the Figure 16.

Decision graph (a) and distribution of samples (b) after normalized in parameter sensitivity experiment.
The two points in the upper right corner are reliable cluster centers. So these two points are selected as the cluster center. It can be found that the samples from the workbench numbered 1 to 100 are grouped into one group, and the samples from the column numbered 101 to 200 are grouped into another group.
In the clustering, the samples that are not normalized are grouped into four groups, corresponding to the four collection points. After the normalization of the amplitudes, they are clustered into two groups, corresponding to the two components in which the collection points are located.
The data analyzed by LMS software is shown in Table 3. The data in Table 3 are also consistent with the source of the data, indicating that this new method is feasible in the multi-point response analysis of the machine tool to identify changes in modal parameters. The result illustrate that the clustering method can identify the difference of parameters between different signals. In other words, the clustering result is sensitive to the modal parameters of the machine tool.
Results analyzed by LMS software.

The state sensitivity verification test
In this verification test, the G code is used to control the spindle of the planer type milling machine acceleration and deceleration to excite the machine tool. The spindle positions are at coordinates (0, 0, 0), (0, 0, 250), (0, 0, 500), and (0, 0, 750), representing the four states of the machine. The x-direction acceleration signal of the same point in horn is collected. Take 16 samples per position and number them 1 to 64 in order.
The results of clustering without normalized are shown as Figure 17.

Decision graph (a) and distribution of samples (b) in state sensitivity experiment.
The results show that the clustering results of the vibration signals are classified according to the position. So the change of the modal parameters of the vibration signal caused by the positional factors can be recognized by the modal classification analysis method.
Further, the signals are first normalized, and then the processed data is clustered. The results are as Figure 18.

Decision graph after normalized in state sensitivity experiment.
After the amplitude normalized signal, there is only one reliable clustering center in the clustering result, which indicates that the natural frequencies of response at these locations are not much different. Therefore, it can be concluded that in this test, the position change mainly causes the amplitude change, and the change of the natural frequency is not obvious.
Concluding remarks
Due to the large number of repeated analysis processes, the traditional manual analysis scheme is inefficient, and there is inevitably a manual error. And there is no operability in the scene with large amount of data. Therefore, this paper proposes a new modal analysis method applied to changing machine tool using clustering. The special G code is used to control the machine tool acceleration and deceleration to stimulate the machine tool. The frequency domain features are extracted, and the clustering process is used to react the influence of different states of the machine tool on the modal parameters. Further, the clustering result after amplitude normalization can be used to analyze which modal parameter changes caused by the machine tool state change.
In this paper, the verification experiments are given from two angles of signal parameters and different states. Experiments show that the cluster-based machine tool modal analysis method can accurately display the changes of machine tool modal parameters caused by machine state changes. Compared with the traditional method that whether the modal parameters changed only can be judged after manually identifying the parameters, this method avoids the manual error and the harmonic interference, simplifies the analysis process, improves the analysis efficiency, and provides an efficient standard method for the study of the influence of machine state changes on machine tool modal parameters.
Footnotes
Acknowledgements
The authors are grateful to the participants of the project for their cooperation.
Handling Editor: James Baldwin
Declaration of conflicting interests
The author(s) declared no potential conflicts of interest with respect to the research, authorship, and/or publication of this article.
Funding
The author(s) disclosed receipt of the following financial support for the research, authorship, and/or publication of this article: The research is supported by the Natural Science Foundation of Hubei Province (grant no. 2020CFB180), and supported by the Major scientific and technological innovation projects in Shandong Province (grant no. 2019JZZY010442).