
Abstract
A prediction model of the structural vibration responses induced by the running trains is established. The modal parameters of the structure are identified using a double-confirmation analysis method based on the auto-spectrum, and the vibration responses of the building are calculated from a limited number of measuring records by inputting the measured vibration information to the foundation of the updated building model. The proposed method is validated by an in-situ experiment of a five-floor residential building near a railway. It was found that the calculated vibration level corresponds well with the measured ones in the concerned frequency bands.
Introduction
Because of its large capacity and dependable operation schedule, railway transportation has become widely used in recent years. However, the increased use has also resulted in increased vibration and secondary noise in the buildings near railway, which in turn increased the train speeds and axial loads. Because both the buildings and the people who live and work in them are seriously affected by the vibration and noise, and these conditions cannot be ignored. Therefore, it is important to predict the target structural vibration responses induced by the running trains in order to avoid potential harm to the surrounding environment.
The prediction model can be divided into several parts, including vibration resources, wave transfer laws in free field, interaction between the soil and the foundation, vibration of the target building, and so on. In order to establish the prediction model, many researchers have used field measurements and the numerical method to study the parts of the model introduced above.1,2 The literature3,4 established a mathematical model to simulate vibration sources. Ju 5 developed a finite element method (FEM) as well as theoretical and experimental methods for simulating complicated vehicles. Kouroussis et al. 6 presented a combined experimental and numerical study of high-speed rail vibrations for tracks on three types of support. O’Brien and Rizos 7 presented an efficient method for analyzing the vibrations in a railroad track system induced by the passage of conventional and high-speed trains. Colacoa et al. 8 used a sensitivity analysis to quantify the dominant train properties that contribute to ground-borne vibration generation. Transfer laws of vibration signals in free field9–14 were studied by means of measurement and numerical analysis, and the field tests were also carried out in the building.15–17 Additionally, Mhanna et al. 18 established a numerical model for the analysis and prediction of ground vibrations due to road traffic. Kuo et al. 19 predicted the ground vibration induced by running trains using a combination of experimental measurements and numerical modeling. Sheng et al. 20 presented comparisons between a theoretical ground vibration model and measured data at three sites. Many other researchers have established models or proposed methods to predict vibration of the target buildings. Yao et al. 21 and Kouroussis and Verlinden, 22 for example, carried out research on predicting building vibrations induced by moving trains. Xu and Hong 23 proposed a framework for quantifying traffic-induced building vibration in a stochastic way. Galvin and Dominguez 24 presented a numerical model of soil motion due to high-speed train passage and analyzed the effects on nearby ground and underground structures. Ju 25 used FEM to investigate the behavior of building vibration induced by high-speed trains moving on bridges. Xu et al. 26 compared two-dimensional (2D) and three-dimensional (3D) prediction models for environmental vibration induced by underground railway with two types of tracks. Chen et al. 27 developed an acceleration response spectrum that can be used in vibration serviceability assessment of civil engineering structures. Zou et al. 28 conducted field measurement of vibration and noise and proposed and then verified a prediction model for the vibration and noise of a metro depot based on existing models.
It is difficult to arrange measuring devices inside buildings because of the disturbance caused by the people living in the building, and field measurement is often disturbed by environmental vibration. Therefore, it is necessary to establish an effective predicting model so that the vibration responses of the building can be obtained without a detailed field test of each parts concerned. Therefore, a new prediction model is established in this article that solves this problem and also provides reference for structural designers and environmental vibration researchers.
Prediction model
In order to establish the prediction model, the modal parameters of the structure are first identified by analyzing field test data and then optimized by heuristic algorithm that has been tested as an effective method to solve this kind of large-scale optimization problem.29–32 Thus, the updated FEM of the target structure can be established and its vibration responses are calculated, as shown in Figure 1.
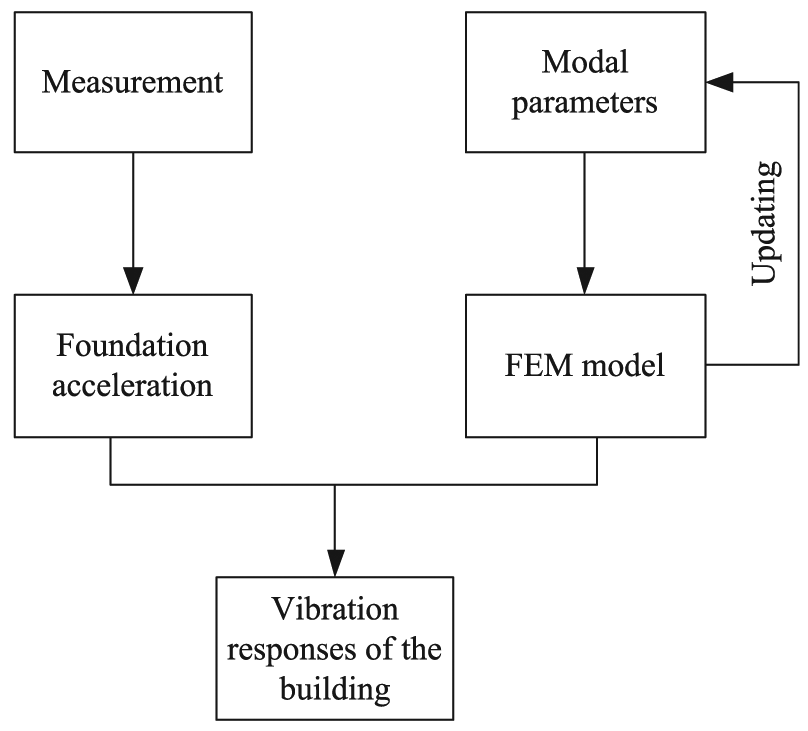
Sketch of the prediction model.
Modal parameters identification
Because the acceleration of the key position on each floor is induced by environmental vibrations and running trains, it is impossible to obtain accurate acceleration signals with free attenuation of the structural vibrations. This makes it difficult to identify the structural modal parameters using the time domain and traditional frequency domain methods. The literature 33 provides a new method in which the modal parameters can be identified by comprehensively analyzing the auto-correlation and frequency response functions of vibration signals of the test points, and the transfer and cross-correlation functions between different test points vibration signals.
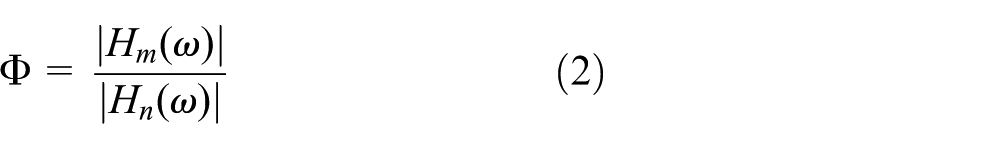
The frequency response function H(ω) is defined as follows

where Gyy(ω) and Gff(ω) are the auto-power spectrum of the structural vibration responses and the excitation force, respectively.
If the environmental vibration excitation is given as the white noise excitation, namely, Gff(ω) = C, and then the natural frequencies of the structure can be obtained by the auto-power spectrum of the structural vibration signals. Because the vibration responses of the building are disturbed by the environmental vibrations, it is necessary to use the cross-power spectral density function between different measuring points in the building to enhance the analysis accuracy. If the peaks of the auto-power spectrum and the cross-power spectrum appear at the same frequency point, the frequency corresponding to each peak can be regarded as one of the natural frequencies of the structure.
The transfer function is defined as the frequency response ratio of the measuring point and the reference point under environmental excitation. The vibration response signal of the reference point is defined as input signal, the vibration response signals of the measuring points are defined as output signals under the influence of the environmental vibration excitation, and the coefficients of vibration modes are defined as follows

where

where


where
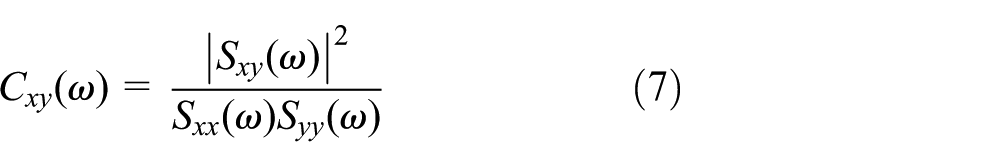
The coherence function is the index of the correlation degree between two vibration signals in the frequency domain. The coherence function is defined as follows
Calculation method of building vibrations under multi-support excitations
The dynamic equation of a discrete building model is as follows

where M, C, and K are the mass, damping, and stiffness matrices of the building, respectively;
The large mass method is applied to represent the forced movement, and the multi-lumped-masses are attached to the excited positions of the building foundation, and then the freedom along the j-direction of the excited positions is released and the force Pj is applied to the lumped-mass in the same direction. The calculated equation is as follows

where M0 is the virtual lumped-mass, and

The jth component of equation (10) is expanded as follows
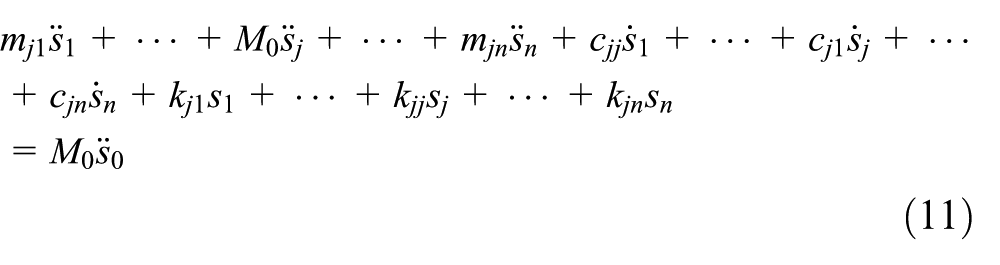
The large mass M0 is much larger than the rest of m on the left of equation (11); thus,
Vibration field test of a building near the railway lines
General information of the test
The field experiment was carried out in a five-story brick masonry structure near a railway line, as shown in Figure 2(a). There are eight railway lines near the building. The distance between the tested building and the nearest railway line, which is for the heavy haul trains, is 30 m. The overall dimension of the structure is 49.2 m × 9.6 m, the height of each floor is 3 m, and there is no basement. The foundation of structure is rubble with ring beams. The layout of the masonry structure is shown in Figure 2(b), where the direction perpendicular to the railway line is defined as the X-direction (D → A is a positive direction, as shown in Figure 2(b)), the direction along the railway line is defined as the Y-direction (D → C is a positive direction, as shown in Figure 2(b)), and the vertical direction is defined as the Z-direction.

(a) Tested building and (b) top view of the one-third building (mm).
To reduce the influence caused by surrounding environmental vibration, measurement was carried out at night. There are three units in the building, and the measuring points were arranged in the unit closest to the railway line. All the measuring points were arranged in a vertical line, as shown in Figure 3. The vibration histories at each measuring point were measured in three directions.

Arrangements of measurement points.
An INV3020 data recorder and 941B acceleration sensors were used in the experiment. According to the characteristics of the environmental vibrations and the structural vibrations induced by the running trains, the sampling frequency of this test was set to 256 Hz.
Analysis of the vibration signals in the frequency domain
The dominant frequency distribution of the structural vibration can be obtained by frequency spectrum analysis of the structural vibration responses induced by running trains. The acceleration frequency spectrum is obtained from the field test recorded data, and the results among the data in the same direction are very close. The acceleration frequency spectra of the third and fourth floors in the Z-direction are shown in Figure 4.

Acceleration spectra of building floors in Z-direction: (a) the third floor and (b) the fourth floor.
It can be seen from Figure 4 that the distribution of vertical dominant acceleration frequency of different floors is similar about 5–20 Hz. In order to study the dominant acceleration frequency band of the floors, the element model of the floor was established, and the natural frequency of the floor was calculated. The results are shown in Figure 5. As can be observed that the first three natural vibration frequencies of the floor are within the dominant frequency bands, so the vibration responses can be regarded as the resonance of the floors induced by passing trains.

First three natural vibration frequencies.
Model updating and validation
Updating of the building FE model
Identification of the structural modal parameters
According to the theory proposed in section “Modal parameters identification,” the measuring point of the first floor is selected as the reference point for calculating the cross-power spectral density function between different measuring points. The auto-spectrum of the third floor acceleration and the cross spectrum between first and third floor accelerations are shown in Figure 6.
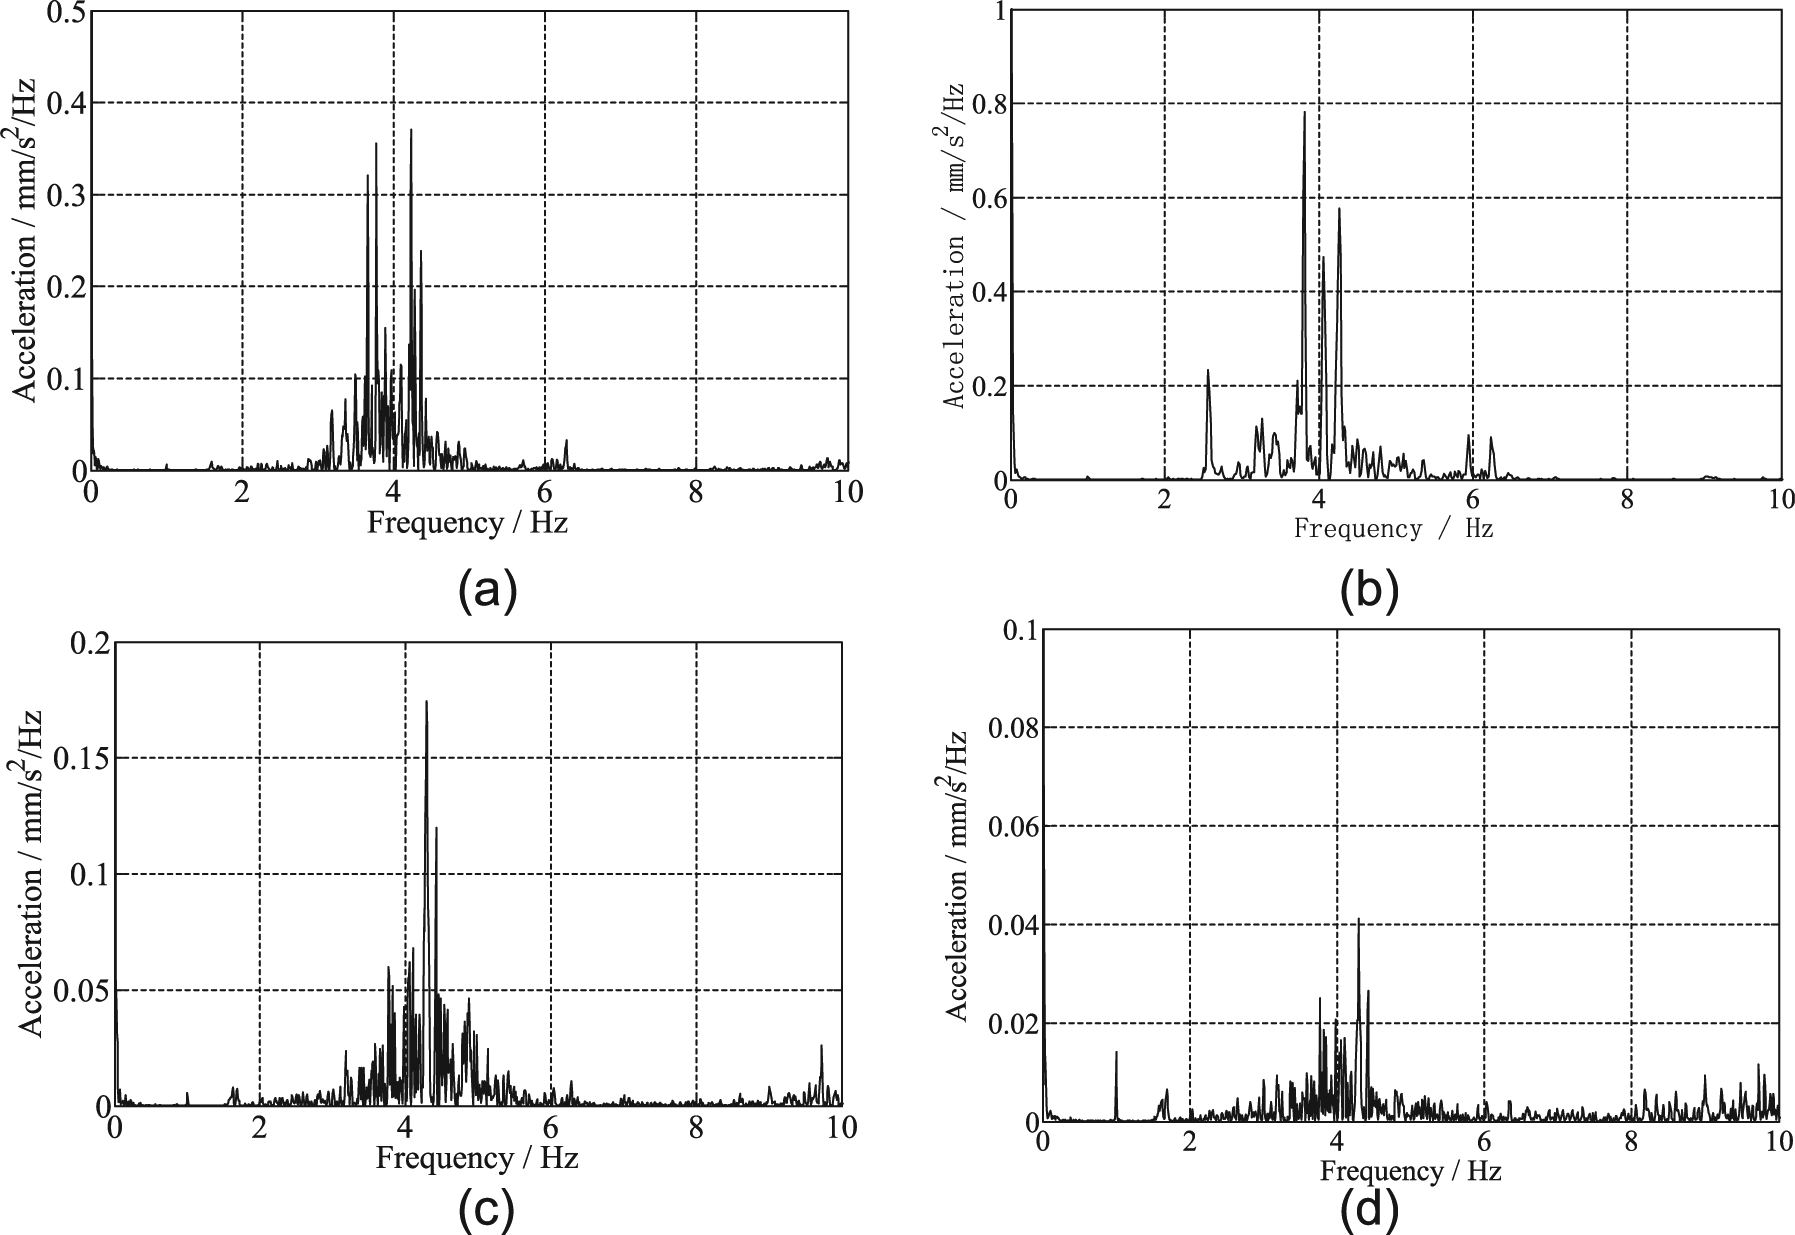
Self-power spectrum and cross-power spectrum of measure point accelerations: (a) auto-spectrum of the third floor acceleration (X-direction), (b) cross spectrum between first and third floor accelerations (X-direction), (c) auto-spectrum of the third floor acceleration (Y-direction), and (d) cross spectrum between first and third floor accelerations (Y-direction).
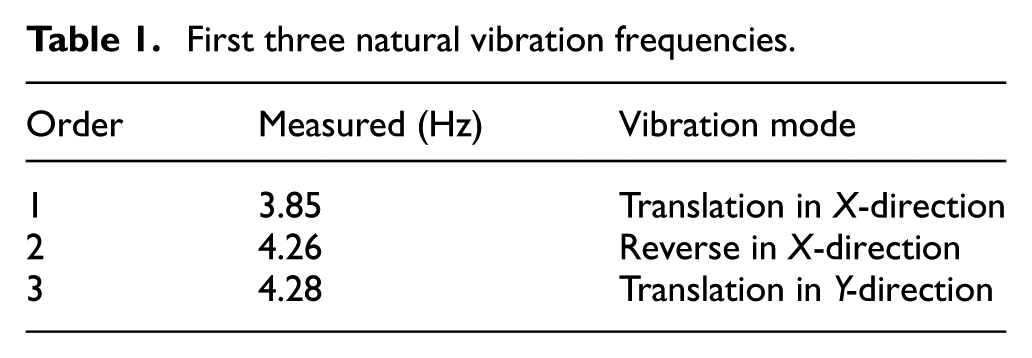
The first two natural frequencies of this structure in the X-direction and the first natural frequency of this structure in the Y-direction can be obtained through analyzing the data shown in Figure 6 and Table 1. The structural vibration mode coefficients are obtained and shown in Table 2.
First three natural vibration frequencies.
Structural natural frequency corresponding to modal factor of each floor.

FE model of structure and its experimental verification
Combined with the design and actual construction of the structure, the FE model of the masonry structure is established by ANSYS. BEAM188 is used for the construction columns and the outer ring beams as well as lintels, with a size not more than 1.5 m; and SHELL181 is used for the walls and the floors, with size not more than 1.5 m × 0.8 m. The FEM of the structure is shown in Figure 7.

FEM of the structure.
The parameters for the element model are constantly adjusted according to the identified modal parameters by the measured records: the elastic modulus of the concrete is adjusted from 2.5e4 to 3.5e4 kN mm−2; the elastic modulus of the brick is adjusted from 1.3e3 to 3.94e3 kN mm−2; the density of the concrete is adjusted from 2.3e3 to 2.6e3 kg m−3; and the density of the concrete is adjusted from 2e3 to 2.3e3 kg m−3. The finally adopted parameters for the element model are shown in Table 3.
Parameters for the element model.

The calculated natural frequencies and modes are compared to the tested data, as shown in Table 4. The first three mode shapes of the building are shown in Figure 8.
First three order of natural frequencies of the structure.

FEM: finite element method.
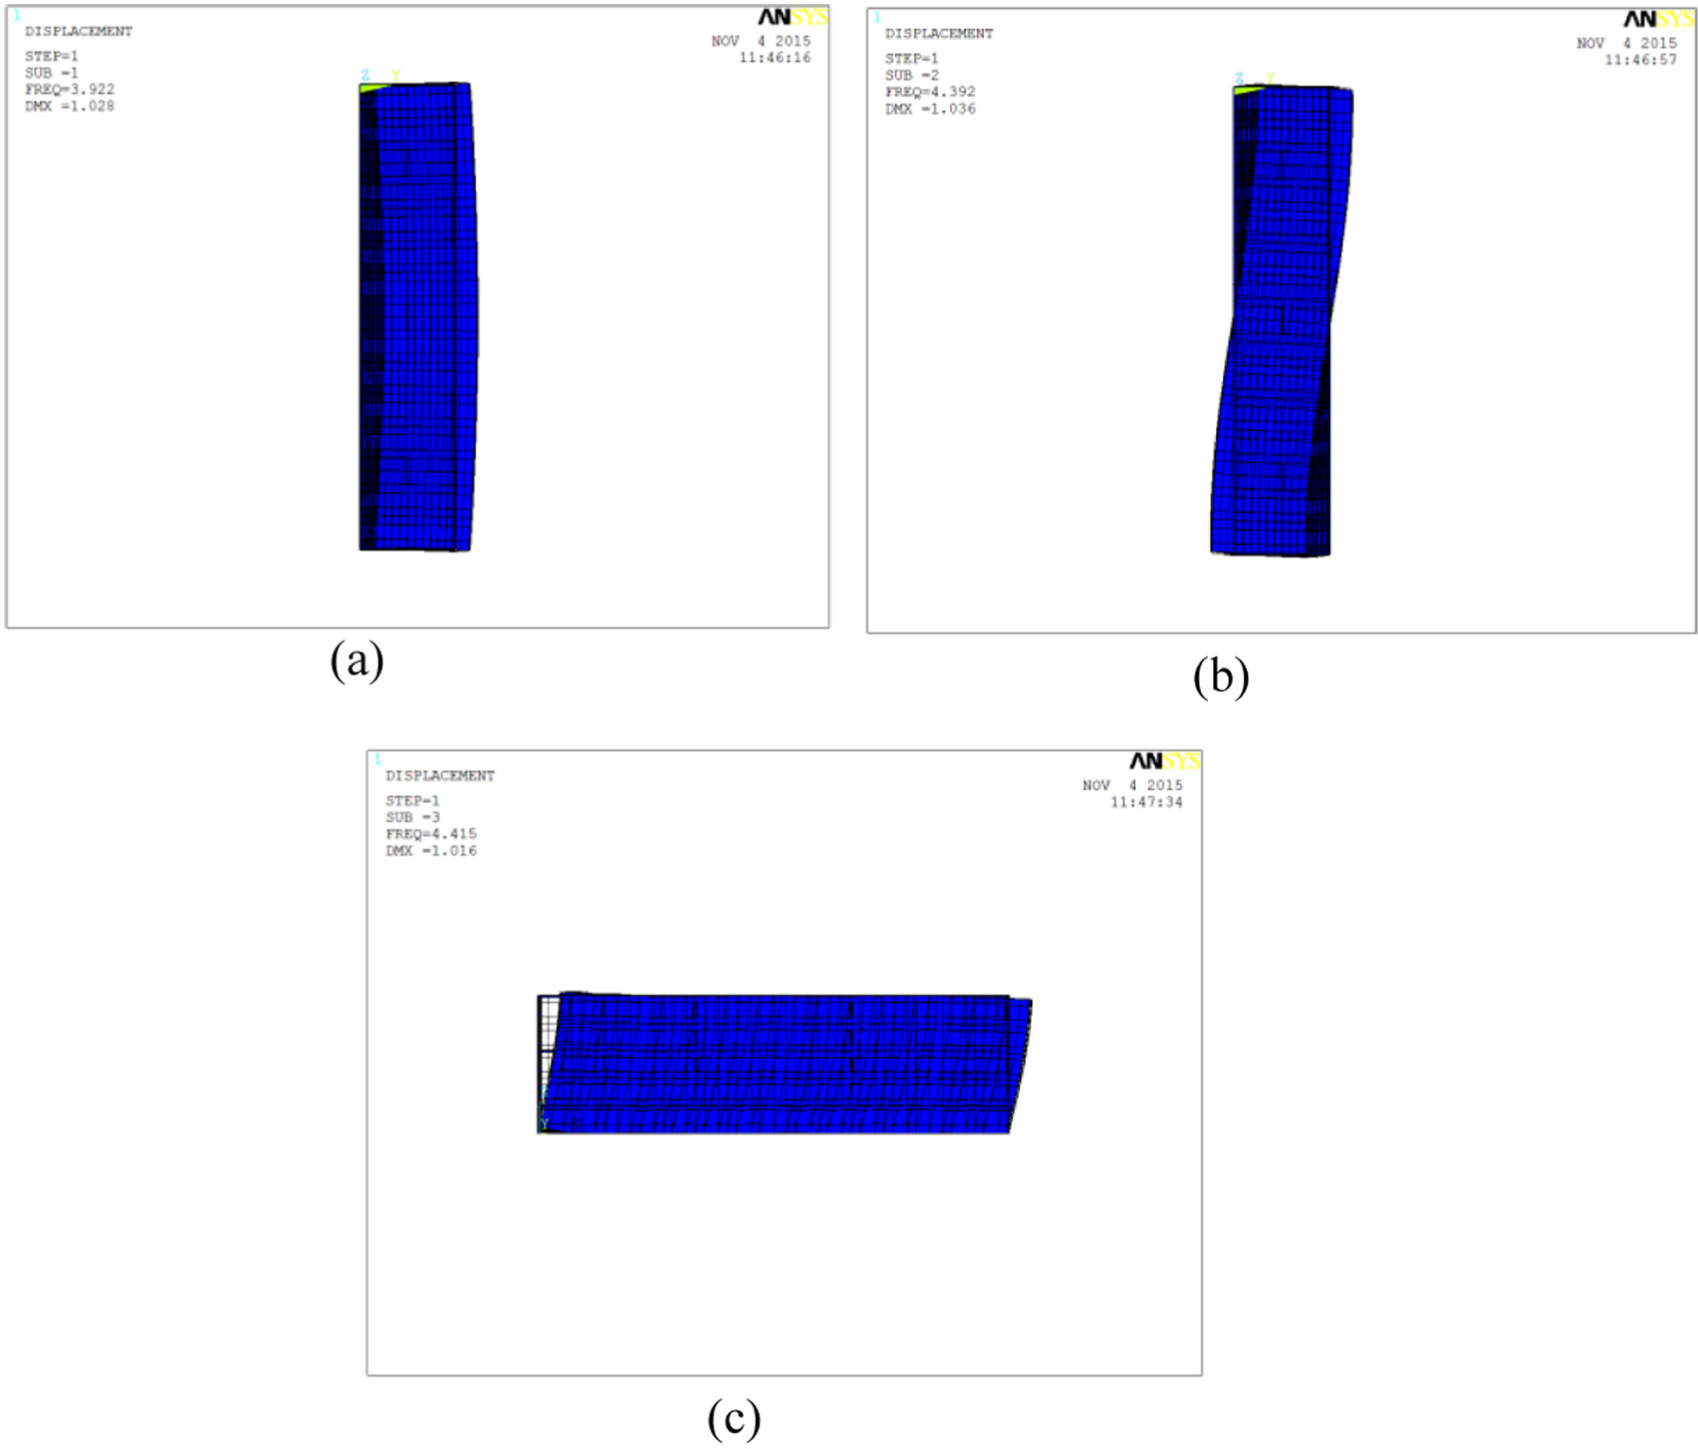
Modes of the building structure: (a) first mode in X-direction, (b) second mode in X-direction, and (c) first mode in Y-direction.
The normalized coefficients of vibration modes of the structure by experiment and calculation are shown in Figure 9. The relative error of the natural frequency for the updated model is within 3%.

Modal factor between identification and numerical calculation.
Numerical analysis of the vibration response of the floors
The signal-to-noise ratio of the acceleration signal in the Z-direction is larger than the other two directions, so the acceleration of each floor in the Z-direction is calculated and analyzed. Also, it is important to note that the vibration level limit in the vertical direction is provided in the existing code. 34 In addition, the uniform acceleration histories are inputted to the FE model in the case study. It is assumed that the foundation of the building is rigid, so the tested acceleration of the first floor can be regarded as excitation that is uniform with that of the building foundation. The tested acceleration of the first floor is shown in Figure 10.

Acceleration time history of the first floor.
Time domain
The accelerations of the measured points on each floor are obtained by numerical calculation using the proposed method and are compared with the tested data. The comparison of the dynamic responses of the fourth floor is shown in Figure 11. As can be seen in Figure 10, the vibration responses of the building obtained by FEM are close to the tested data.
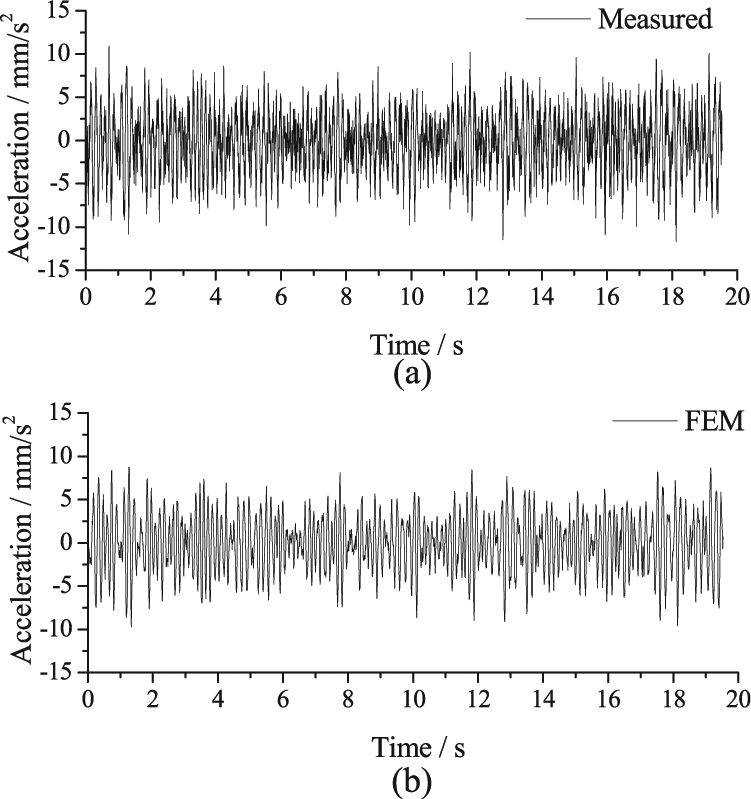
Time histories at the measuring points.
Frequency domain
In order to validate the prediction model, the accelerations obtained from the calculations and the field measurements in the Z-direction are compared according to the one-third octave process, as shown in Figure 12.

Comparison between numerical calculation and measured data for each floor: (a) second floor, (b) third floor, (c) fourth floor, and (d) fifth floor.
As the spectrum analysis results show, the main frequency distribution is within 5–20 Hz; analyzed frequencies higher than 40 Hz are ignored in the calculation. It can be seen that the vibration grade is larger in higher building floors, while the frequency components are similar in all the floors. The dominant frequency band of the measured vibration is 5–20 Hz, indicating that the calculated results correspond with the measured results quite well. Some errors are seen in the higher frequency bands. These are due to the following reasons: (1) the signal-to-noise ratio is low because of the high-frequency component attenuation in the train-induced vibration; (2) the error of damping ratio taken in the building model; and (3) some structural damages are not considered in the building model.
Evaluation of the structural vibration
Because the building is a residential building, it is necessary to evaluate the vibration responses in occupied parts of the building. To account for the vibrations of human activity within the building, the acceleration vibration levels are calculated based on corrected weighting factors with different frequencies. 34 The acceleration vibration levels can be expressed as follows

where aref = 10−6 m s−2;

where
The acceleration vibration levels of each floor at the measuring points induced by the running train are shown in Figure 13.

Acceleration vibration levels of each floor.
Using the prediction model, the acceleration vibration levels of each floor induced by the running trains at other positions can be obtained. For example, the acceleration vibration levels for each floor at point P induced by the running trains can be calculated without requiring measuring devices to be arranged in throughout building, as shown in Figure 14.

Acceleration vibration levels of each floor at the predicting point P: (a) position of point P and (b) acceleration vibration levels of each floor.
It can be seen from Figures 13 and 14 that the acceleration vibration levels of the fourth and fifth floors are beyond the limitation values, 35 so some measurements should be taken to control the vibration of the building for the living comfort of the residents.
Conclusion
A prediction model of structural vibration induced by the running trains is proposed and also validated using an in-situ experiment. In this model, the building FE model is updated using the double-confirmation analysis method based on the auto-spectrum, the cross spectrum, and the frequency response function of the concerned structure. The vibration histories and vibration levels are calculated by inputting the measured vibration information to the foundation of the updated building model. The vibration responses of the building can be obtained effectively through this prediction model without the requirement of a detailed field test of each part.
Footnotes
Academic Editor: Gang Chen
Declaration of conflicting interests
The author(s) declared no potential conflicts of interest with respect to the research, authorship, and/or publication of this article.
Funding
The author(s) disclosed receipt of the following financial support for the research, authorship, and/or publication of this article: The authors would like to acknowledge the financial support from key project of national natural science foundation (Grant No. 51338001, the State Fundamental Research Funds “973” Program (Grant No. 2013CB036203) and the National Science Foundation (Grant No. U1434205) of China.