
Abstract
When light alloys used in coal mine, the sparks generated by mechanical friction and impacts are the main effective ignition source. While the hot surfaces are concomitant in friction process, prior to the occurrence of mechanical sparks, whether the hot surfaces will be an effective ignition source. Then this paper focuses on the development of hot surfaces generated by TC4 titanium alloy at the low friction velocities. Experiments and finite element simulation methods were used together to describe the temperature field of TC4 titanium alloy. It was found that the temperature of hot surfaces increased with the load and increased much faster at higher relative speed. By means of regression analysis, the variation law of friction coefficient and contact pressure with loads and the variation law of hot surface temperature with friction coefficient and pressure were studied, then the fitting curve of hot surface temperature was obtained. The results of calculations and experiments indicate that hot surfaces generated by light alloy was possible to be an effective ignition source for methane air mixture in coal mine.
Introduction
For non-electrical equipment intended for use in coal mine, an ignition hazard must be assessed, which includes a consideration of all potential ignition sources. 1 In general, hot surfaces and sparks generated by friction and impacts are major ignition source. Non-sparking or less-sparking materials may be used in the field of explosion protection, such as bronze and steel. For small components, the nature of materials has little effect on their mass. While for electrical equipments are always set in flameproof enclosures house which is made by steel to isolate them from explosive gas. 2 For example the electrical equipments of coal mine rescue robots, because of the need for a steel explosion-proof housing, the quality of them are about 200 to 500 kg.3–6 Even more, a few coal mine rescue robots are too bulky resulting in a poor walking performance to enter the disaster sites. 7 So the use of materials like copper and steel greatly increases the quality of the equipments, which is not conducive to meet economical and ecological needs. 8 While using light alloys instead of heavy metals in potentially explosive atmospheres, have to take measures against ignition sources due to mechanical friction and impact. 9 Light alloys tend to produce frictional impact sparks, since the limiting ignition curves lie below or in the area of the spark limit curve, if hot surfaces will be an effective ignition source. Meyer. 10 studied the hot surfaces generated by friction contacts of five different types of steel and proved that the hot surface could ignite ignitable mixture. And the main influencing factor of the hot surface becoming the ignition source is the thermal conductivity of the materials. Bronze is generally regarded as a non-sparking material, the friction velocities between 1 m/s and 20 m/s and surface pressures between 1 N/mm2 and 40 N/mm2 did not cause any mechanically generated friction sparks, for friction partners made of aluminum bronze the effective ignition source originated from the hot surface. 11 Both steel and bronze are less prone to generate mechanical sparks, the hot surface my become an ignition source. The hot surface generated by the friction contacts of alloys under which conditions would become effective.
The aim of this research project is to study the hot surfaces generated by friction contacts of TC4 titanium alloy. Q235A steel is selected as the friction partner because the national standard which check the safety of mining light metal materials stipulates the experimental plate materials is Q235A steel. This sliding dry friction system of titanium alloy block and steel ring is set to explore the influencing factors for the temperature of hot surfaces and frictional temperature field. Considerable research has been done on the prediction of surface temperatures under various working conditions. Blok 12 first built an analytical model to calculate the temperature distribution on a moving band heat source. Jaeger 13 then developed a temperature rise model in which a point heat source slides in a semi-infinite region. He also used heat distribution to analyze the temperature distribution, but the model targeted the average temperature rise rather than the maximum temperature rise. Archard developed a much simpler and more widely used treatment of the Jaeger analysis. 14 With the great development of computing power, finite element simulation technology is used to visually observe the development of frictional heat.15–17 Here finite element simulation and experiments are used to predict the development of hot surface temperature with the relevant heat transfer theory.
TC4 block and steel ring rotating friction model
TC4 block and steel ring rotating friction test was performed on Friction and wear testing machine M-2000. The steel ring was rotated by the eccentric wheel and the TC4 block was fixed, the two samples were impact by load on block top. The model were shown in Figure 1. The upper specimen was a 10 mm × 20 mm × 10 mm cube, the lower one was circular ring with inner diameter of 20 mm, outer diameter of 40 mm and thickness of 10 mm. The surfaces of the two specimens were burnished, the surface roughness was Ra100. The material of upper specimen was Ti6Al4V and the lower one was Q235A as shown in Figure 1. The center of the steel ring was the origin of the coordinate system, the circle rotated around the Z axis, and the longitudinal direction was the Y axis.

TC4 block and steel ring rotating friction model.
The friction tests were carried out under dry rotating conditions at different normal loads of 200, 300, 500, and 800 at different rotating speeds of 210 n/min and 330 n/min. Then the loads and velocities combined eight groups test conditions. Under each test condition to obtain the coefficient and instantaneous temperature.
Related theories
The temperature field of an object is defined as the sum of instantaneous temperature distributions or temperatures at all points inside the object. The numerical calculation of the temperature field is based on the solid heat conduction equation, if there is no heat source inside the object, the three-dimensional transient heat transfer equation is expressed as:
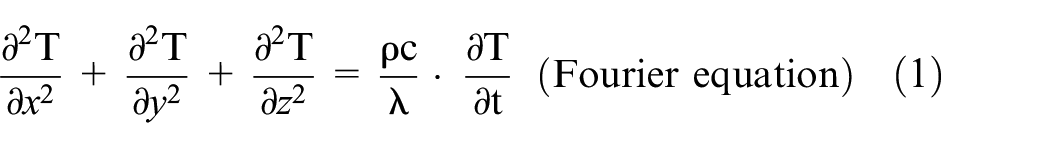
where ρ is the density of material, c is its specific heat, λ is the heat conduction coefficient of material.
When the heat transfer process enters a steady state, its heat transfer equation is expressed as:

The boundary conditions should be set to get a certain solution for the heat transfer problem. There are four types of boundary conditions for heat conduction:
(1) The first type of boundary condition
Specified the temperature distribution at the boundary of the object:

(2) The second type of boundary condition
Specified the borderline heat flux density:

where
(3) The third type of boundary condition
Specified the surface heat transfer coefficient h, the temperature of object boundary Tω and the surrounding temperature of object boundary Tf.

(4) Thermal radiation boundary condition
Objects transfer electromagnetic radiation energy to each other through electromagnetic waves without passing through the medium.

where T is the boundary temperature of object, TR is the surrounding temperature, σ is Boltzmann constant, Fϵ is emissivity function, FG is geometric viewing angle coefficient.
Calculated model temperature field
Related hypotheses
The actual contact surface of the friction is equal to the theoretical contact surface;
The normal load at the friction contact interface is equal;
The heat transfer of the steel ring in the air only occurs on the outer surface, and the afferent coefficient is independent of the position, and the heat transfer on the inner surface is negligible;
The heat generated by the friction is all absorbed by the block and the ring, and the heat conduction to the clamp is not in the short surface of the top surface A1;
The physical property parameter is a constant, and the change in the unit volume caused by the temperature change of the entire object is negligible;
Ignoring heat radiation;
All materials are homogenious and isotropic.
Differential equations and boundary conditions for temperature field analysis of experimental titanium alloy block and steel ring
The friction test of titanium alloy block and steel ring was exposed to the air while the surrounding temperature was 10°C and the components temperature was also 10°C. The convective heat transfer between the friction pair and the surface of the fixture was: the boundary surfaces A1, A5, and A6 were inserted into the fixture of the testing machine. The inner surface of the annular hole A8 was in direct contact with the rotating main shaft, and the A10 was in direct contact with the end surface of the rotating shaft. The heat on these boundaries could be free transfer to the fixture and the shaft, no heat conduction occurs in a short time, the temperature was consistent with the room temperature, and the boundary belongs to the first type of boundary condition which could be expressed as equation (3):

The boundary conditions at the friction bottom of the block could be expressed as equation (4):

where Q was the friction heat.
The boundary surfaces A2 and A4 were in direct contact with the surrounding air, and there was convective heat transfer, which belong to the third type of boundary conditions. It could be expressed as equation (5):

Where hair is the surface heat transfer coefficient of the ambient air, Tf is the ambient temperature.
The boundary conditions of the steel ring are as follow.
The friction area:
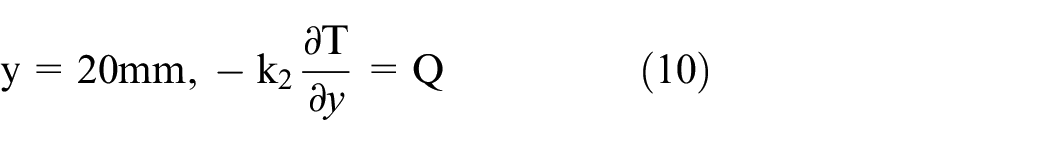
where k2 was heat conduction coefficient of Q235A.
Except the friction contact zone, the boundary A3 had a convective heat transfer between the exposed part with the air. It was also the third type of boundary condition, the ring rotated at a certain speed, the boundary A9 belong to external slab forced convection and the boundary A10 belong to externally swept single tube forced convection were all second type of boundary condition but the heat transfer coefficient was different.
Calculation of heat transfer coefficient:


where Nu was Nusselt number, Pr was the Prandtl number, Pr = ν/a, a was the thermal diffusivity; Re was the Reynolds number, Re=vl/ν.
Calculate the heat flux of the friction zone
The friction system consisted of a rotating ring and a fixed block. The distribution of friction heat flux was influenced by the load, relative velocity and friction coefficient. The total frictional heat flux of the system could be expressed as:

Transient friction heat flux density could be expressed as:

where P(t) was instantaneous pressure at a certain point and at a certain moment.
The total frictional heat flux of the system was distributed to the ring and block, then the distribution ratio was related to the properties of the materials. The relevant equations18,19 were listed as follows:

where β was the heat flux density distribution ratio; Q1 and Q2 were respectively the heat fluxes entering the TC4 block and Q235A ring. ρ, k, c were densities, heat conduction coefficients and specific heats of the two materials, respectively. β here was 25% via calculation.
Experimental and simulation analysis of friction model
Experiment
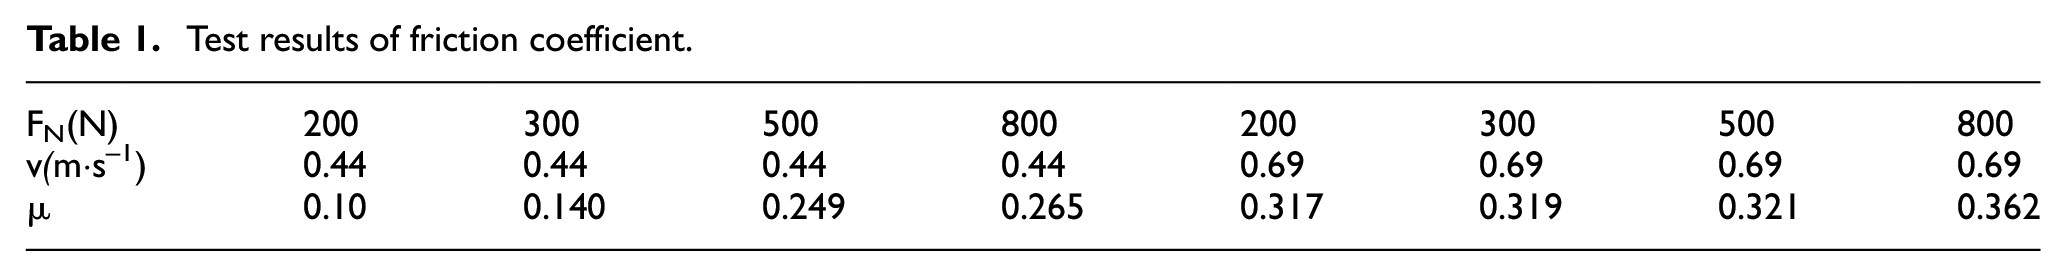
The accuracy of the friction coefficient was one of the most critical factors affecting the simulation results. The friction between TC4 block and Q235A ring was dry friction. As the friction time increased, the wear on the surface of the block was more serious. The increase of the wear would affect the pressure and influence of friction coefficient simultaneously. Experimental results showed that the friction coefficients increased with the friction time. Then to determine the friction coefficient, it was necessary to determine the friction time first. As the housing material does not belong to the long-term frictional element in mining, in order to obtain the consistent friction condition between the experiment and the simulation, the frictional time would be short and the wear may be in a negligible range. So record the friction time when the maximum depth of wear was less than 0.1 mm under different friction conditions. It was friction time and the average friction coefficients in this time were used to simulate.
We used Full Factorial Approach for carrying out the experiments, eight groups of experimental conditions were composed of different loads and speeds. The average friction coefficient measured by repeating three times in each group of experiments which was shown in Table 1.
Test results of friction coefficient.
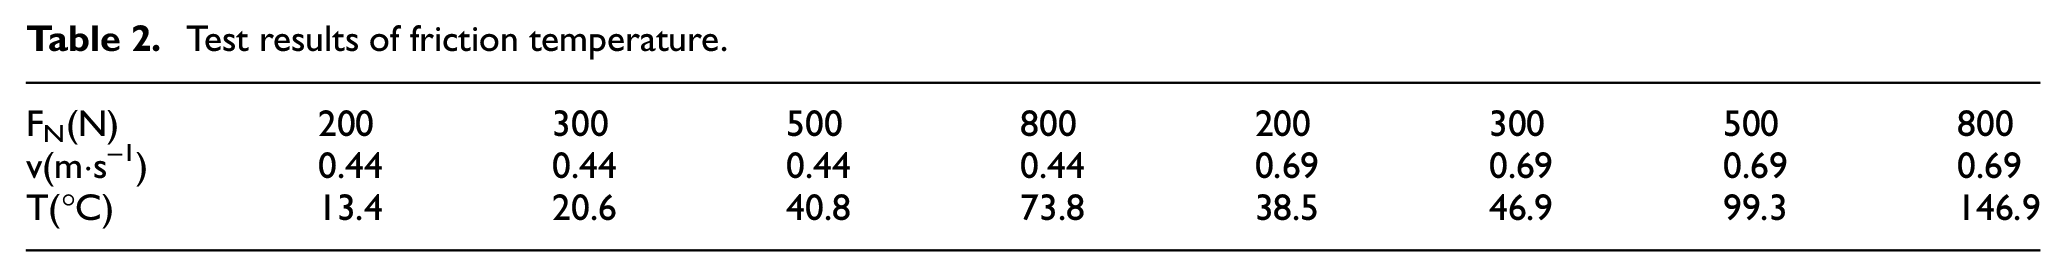
Generally, the temperature at each point of the friction zone was inconsistent, which difficult to measure all. We measured the highest temperature with infrared camera as contrast temperature. The average values measured by repeating three times in each group of experiments which was shown in Table 2.
Test results of friction temperature.
The images of temperature field taken by infrared camera were shown in the Figure 2. It was seen that the highest temperature occurred in friction-contact area. Along with heat conduction and heat dissipation, the temperature in other areas are higher than room temperature, but much lower than the friction-contact area.

Images of the infrared camera: (a) 800 N, 0.44 m/s and (b) 800 N, 0.69 m/s.
Simulation analysis on temperature field
Simulation of temperature field for the friction system was carried out on analysis software ABAQUS 6.16. Dynamic analysis in ABAQUS fell into two broad categories: mode superposition and direct solution. The mode superposition method was widely used in linear analysis. The direct solution which could be divided into standard dynamic analysis and explicit dynamic analysis was mainly used to solve nonlinear dynamic problems. Although standard calculations usually required a large number of iterative calculations and were not easy to converge, the simulation results were more accurate. So this paper used standard dynamic analysis to solve the problem.
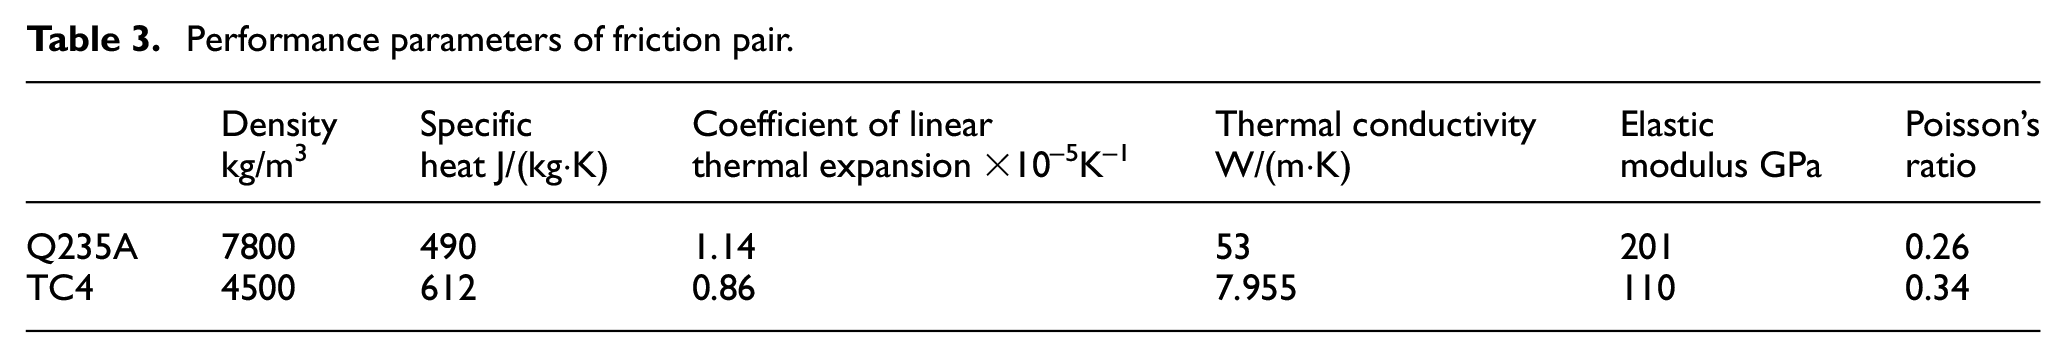
The physical parameters of the two materials involved in the simulation are listed in Table 3. Next, mesh generation is very important because it determines convergence, computation and accuracy of results, so it needs to be adjusted repeatedly. In order to obtain an accurate temperature distribution in the frictional contact area, the grids was drawn encrypted in this area. In other regions, ensuring convergence, the grid was as sparse as possible to reduce the computation and improve the operation speed. After several adjustments, the grid is drawn as follows (Figure 3). The mesh of the steel ring had approximately global size 2 in circumferential direction, and it is encrypted radially outward, and minimum approximately global size is 0.4. The titanium mesh is encrypted from the outside to the inside, from both ends to the center, with the maximum size of 2 and the minimum size of 0.4 (compared with the mesh with the minimum scale of 0.2, the differences are very small, and the minimum size is finally determined to be 0.4). Other parameters for simulation are the indoor temperature and the specimens temperature during the experiment were all 10°C.
Performance parameters of friction pair.

Mesh grid of the friction system.
Then the simulation results are as follows: the contact between the two samples was a line contact and the pressure was not easy to calculate so only could be obtained from the simulation (Figure 4). The pressure of the specimens under different experimental conditions were shown in Table 4.

Contact pressure on block.
The pressures on TC4 block.

Simulation of temperature field for Q235A ring and TC4 block were showed as follow. The maximum temperature appeared in the center of the friction area which did not change much with time. With time increased the temperature generated by friction gradually propagated to the block and the ring respectively with the stable distribution ratio and a little part of it was lost in the air. The highest temperature of TC4 block dropped gradually from the center to surrounding, temperature spread into the interior of the block and temperature gradient was dropping from the lower surface to the upper surface. Figure 5 was at the condition of load 200 N and speed 0.44 m/s which showed the temperature propagation process of the ring and block, and Figure 6 was temperature distribution for the bottom of TC4 block.

Temperature distribution of the system.

Temperature distribution friction of TC4 block.
Most of the previous researches focused on the relationship between the maximum temperature in the friction contact area and the friction conditions (such as load, relative speed, contact area, etc.). For the distribution of friction temperature, it is captured by infrared camera, which is basically not combined with computer simulation. The temperature field captured by infrared camera is mostly similar to Figures 2 to 5. Frames and imaging resolution is determined by the equipment parameters, the highest temperature of frictional contact zone can be accurately measured. However, this temperature distribution and temperature expansion details are not as clear and intuitive as that obtained by simulation, and the temperature at any point of the model, especially the temperature at the internal point of the sample, cannot be accurately obtained. The simulation can directly obtain the temperature value at any point inside the sample for comparison, and it is convenient to obtain the process data. Only by combining simulation and experiment can the friction temperature field be fully interpreted.
In the simulation, three analysis steps were used to stabilize the model. The load was gradually added in two analysis steps. The rotational friction starts from the third step, and 100 data were output in this analysis step. Figure 7 shows the temperature curve of a node at the center of the friction zone of the TC4 block at the condition of load of 500 N and relative speed of 0.44 m/s. As the model starts to rotate, the temperature of friction increased rapidly in the initial stage, and then gradually increased slowly, finally the temperature increase rate basically reached the equilibrium state. Figure 8 showed the temperature curve of the central node of the TC4 block under different friction conditions. The temperature in the friction center region increased with the increase of the loads (Figure 8(a)). At high rotation speed, the temperature increased with the loads rapidly (Figure 8(b)). When the friction condition was 800 N and the relative rotation speed was 330 n/min, the temperature was highest which reached to 150°C. As the load and speed increased simultaneously, the maximum temperature increase of the friction zone was greater.

Center node of TC4 block temperature curve at 500 N-0.44 m·s−1.

Center node of TC4 block temperature curve: (a) At low speed and (b) At high speed.
Contrast between simulated and experimental values of temperature
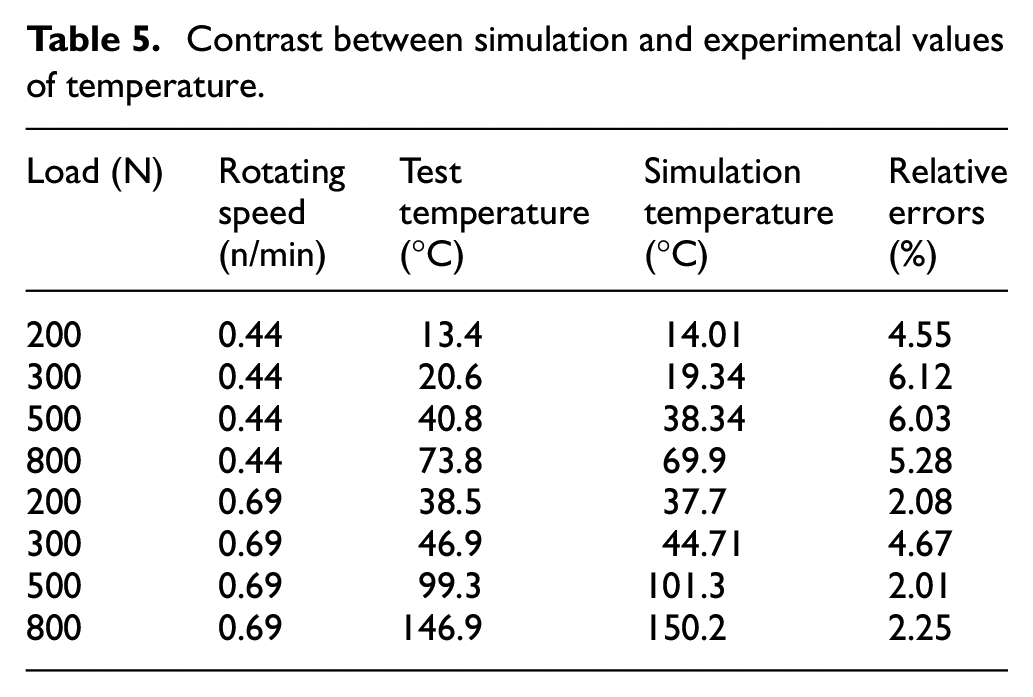
Compared test value and simulated value of the highest temperature for friction area at different experimental conditions. Used Tt to indicate the test temperature and Ts to indicate the simulated value. The relative errors δ could be expressed as:

The comparison results were shown in Table 5. The relative errors were not too large, so the simulation and test value agreed well. It was proved that the nonlinear transient temperature field problem could be solved by simulation.
Contrast between simulation and experimental values of temperature.
Prediction of the frictional surface temperature
In order to obtain a more accurate fitting curve, the relevant datas under three groups of load conditions were measured. The friction coefficient, pressure and temperature values obtained from the experiments or simulations under different loads were listed in Table 6. Firstly, matlab software was used for regression analysis and significance test, and the fitting curves of friction coefficient and pressure under different loads were obtained with the rotational speed was 0.69 m /s.
Friction coefficient, pressure and temperature under different loads.

For the variation of friction coefficient with loads, among the feasible fitting curves, the quadratic and cubic curves fit well and are basically consistent (Figure 9) and the two curves basically overlap, and the quadratic curve is not visible. However, it can be seen from the adjusted values and square error values that the fitting degree of the quadratic curve is good (Table 7), and for the contact pressure, the fitting degree of the straight line is good (Figure 10). Therefore, when the relative velocity is 0.69 m/s, the linear model of friction coefficient and contact pressure are:


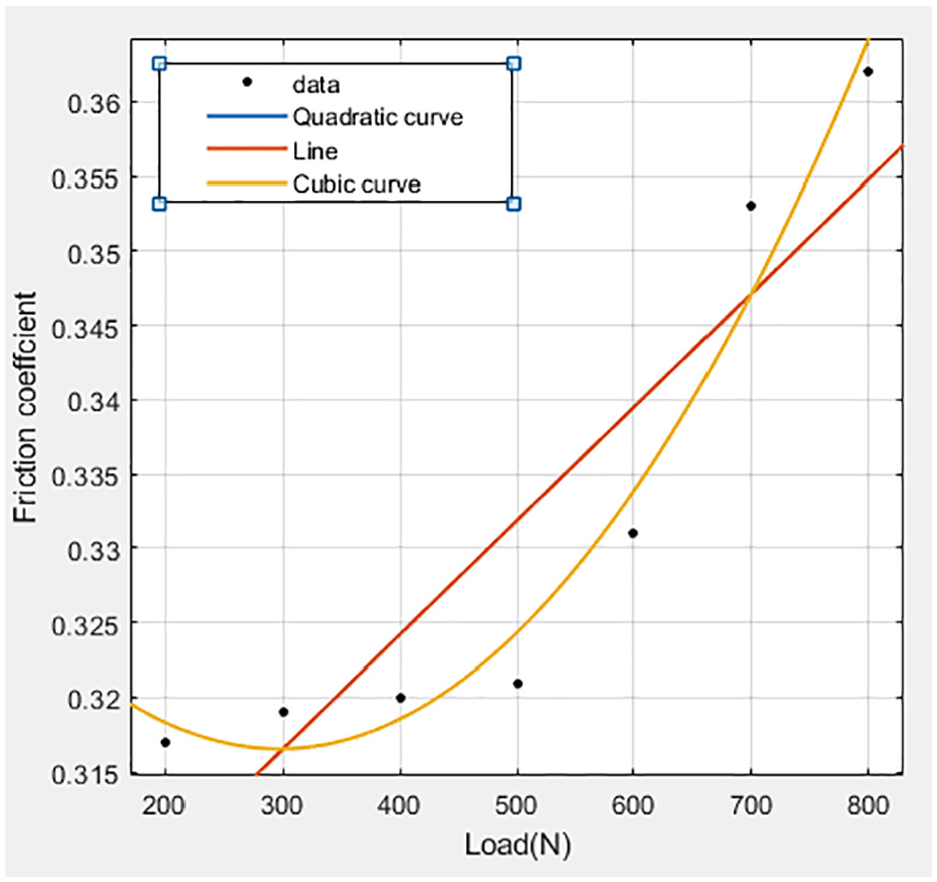
Fitted curves of friction coefficient.
Regression analysis table of the friction coefficient.

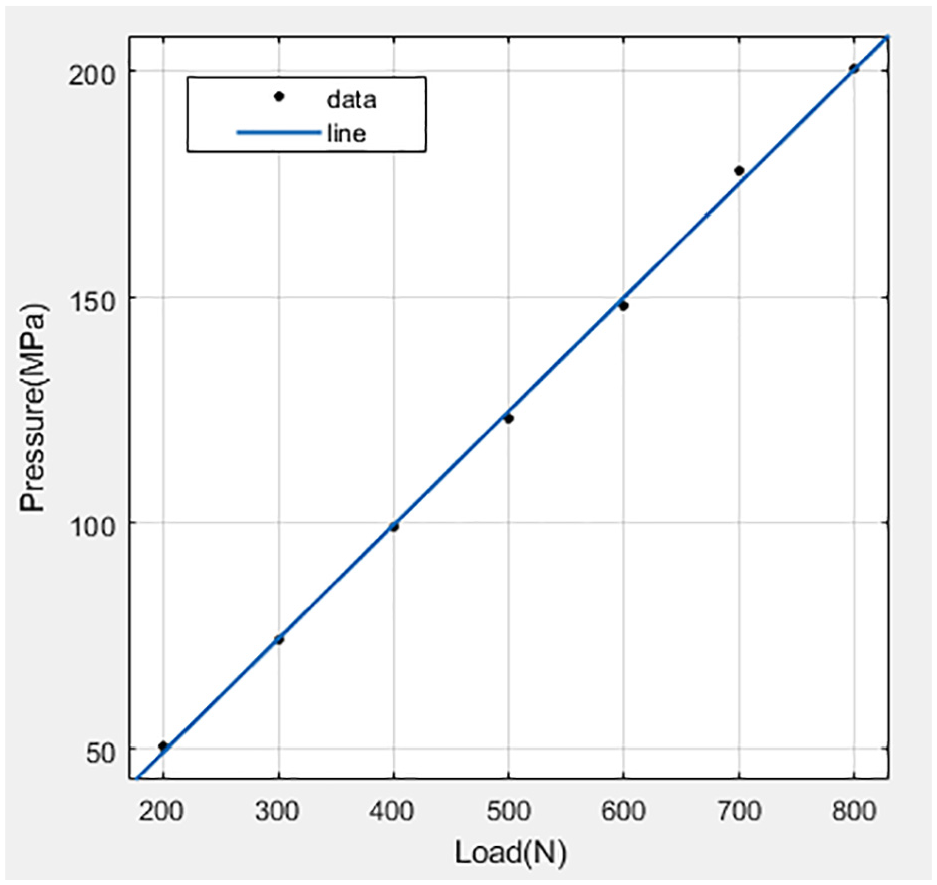
Fitted curve of pressure.
By means of regression analysis, the fitting equation of the temperature of hot surfaces changing with friction coefficient and contact pressure was obtained. By comparing different fitting surfaces, it is found that the fitting effect of the plane is the best (Figure 11), the scattered points are uniformly distributed above and below the plane, and the adjusted values and the square error values are the lowest.
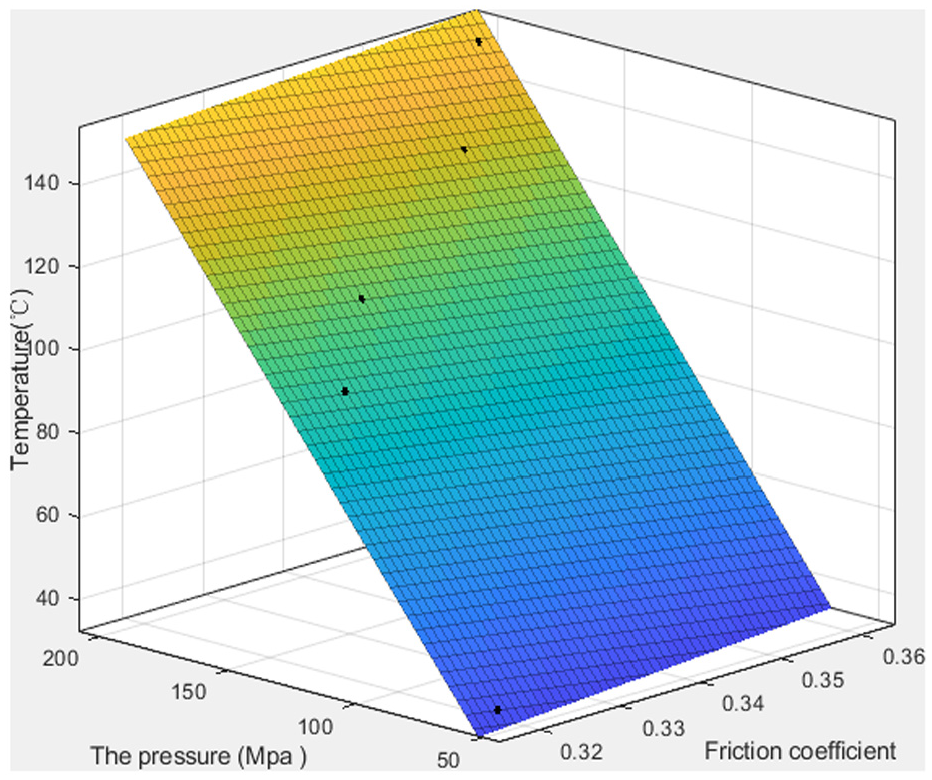
Temperature fitting surface.
The fitting formula was:

According to the formula 17–19, it could be calculated that the temperature of the hot surface reached to gas ignition point, the load needed to exceed 2377.51 N at the relative rotational speed of 0.69 m/s.
This result only indicates that the increase of load can bring the hot surface temperature to the ignition temperature of methane. However, the highest temperature of the two contact surfaces generally occurs at the wear point, where there is no contact with the surrounding environment, and the heat transfer of the hot surface needs to rely on the thermal conductivity of the material. Therefore, when the load exceeds 2000 N, the risk of the hot surface becoming the ignition source increases. Further experiments are needed to see if the hot surface can ignite the methane-air mixture.
Conclusion
Friction between TC4 and Q235A did not generate sparks at the friction velocities below 1 m/s and surface pressures below 200 N/mm2. The temperature of hot surfaces generated by TC4 titanium alloy increased with the load and increased much faster at higher relative speed. The main factors affecting the temperature of hot surface were friction velocity, pressure and physical parameters of the material. Theoretically, if no friction sparks would be generated, the relative rotational speed less than 1 m/s, then the increase of the load would bring the temperature of the hot surface to the ignition point of methane.
Footnotes
Handling Editor: James Baldwin
Declaration of conflicting interests
The author(s) declared no potential conflicts of interest with respect to the research, authorship, and/or publication of this article.
Funding
The author(s) disclosed receipt of the following financial support for the research, authorship, and/or publication of this article: The research described in this paper was financially supported by the Joint Funds of the National Natural Science Foundation of China (Grant No. U1610251).